Regular Article
Characteristics of Inclusions in Low Carbon Al-Killed Steel during Ladle Furnace Refining and Calcium Treatment
2013 Volume 53 Issue 8 Pages 1401-1410
Details
2013 Volume 53 Issue 8 Pages 1401-1410
A plant trial of the productions of LCAK steel was performed, and characteristics of inclusions during LF refining and calcium treatment were investigated. Besides, thermodynamic diagram among magnesium, aluminum, and oxygen as well as calcium, magnesium, aluminum, and oxygen in the steel melt were studied to understand the fundamentals of inclusion modification by calcium treatment in LCAK steel. Furthermore, the change mechanisms of oxide inclusions and the precipitation of calcium sulfide were discussed. The experimental results showed that oxide inclusions were partly changed along with the path of Al2O3→MgO·Al2O3→(MgO·)CaO·Al2O3, which was a little different from the thermodynamic calculation results due to the limited kinetic conditions. Calcium treatment somehow modified the inclusions, however, many large inclusions were generated, and the modification effect would be dramatically decreased by the formation of large amount of CaS inclusions, which appeared with three main distribution forms. The formation of inclusions after calcium treatment were discussed based on the thermodynamic analysis. In order to reach the target of modification, sulfur concertration in steel should be reduced to a small amount to decrease the formation of CaS.
Low Carbon Aluminum Killed (LCAK for short) steel is well used to produce cold rolled sheets for automobiles, family appliances, etc. Thus, the quantity, size, morphology, and distribution of inclusions need to be well controlled.
As secondary refining approaches for LCAK steel, ladle treatment with gas stirring, CAS or RH refining are well used, and many relevant studies on steel cleanliness during these refining processes have been reported.1,2,3,4,5,6,7) Recent years, ladle furnace (LF) refining is also chosen to produce LCAK steels, especially for thin slab casting processes.8,9) To prevent the breakout during thin slab continuous casting process, the sulfur content in steel need to be relatively low. Thus desulfurization is needed during secondary refining process. For thin slab casting process, calcium treatment is needed to prevent nozzle clogging, and LF refining is good to perform calcium treatment. During LF refining, high basicity and low FetO content slag are used to prevent [Si] pickup and guarantee stable Ca treatment. The temperature fluctuation and temperature drop are also small compare to the refining processes of RH and CAS.
In the current study, the characteristics of inclusions in a LCAK steel produced by “BOF→LF→Calcium treatment→Continuous casting (CC)” process are investigated. The composition, amount, size distribution, morphology and formation mechanism are discussed.
Industrial trials for the production of two heats LCAK steel were performed in 300 t ladles with magnesia carbon lining. The production route is “BOF→LF→Calcium treatment→CC”. During tapping of BOF, a certain amount of aluminum was added into the molten steel to decrease the dissolved oxygen to several ppm. Approximately 1500 kg synthetic slag was added into the ladle during tapping to reduce FeO and MnO in the slag to less than 1%. During LF refining high basicity slag (approximately 2500 kg) was used and aluminum was added to improve the deoxidation. After the refining, 570 kg and 418 kg Ca–Fe wire were added for Heat 1 and 2 respectively.
Steel and slag samples were taken before LF refining, at the earlier stage, the middle stage, and the end of LF refining, after Ca treatment, and after soft blowing for two heats. Since the entire refining time of the two heats is different from each other, for the two heats, samples were not taken at the exactly same time, but at the same refining stages.
The contents of C, S and total oxygen (T.O.) of the steel samples were analyzed using infrared analysis. The concentrations of calcium, magnesium, silicon, manganese and the dissolved aluminum were analyzed using ICP-AES. The nitrogen content was analyzed using thermal conductance method. The slag composition was analyzed using fluorescence analysis.
Inclusions on the cross-sectional of each steel sample were detected using automated SEM/EDS inclusion analysis (ASPEX). ASPEX is a computer-controlled scanning electron microscope that is designed for the automated imaging and elemental analysis of a wide spectrum of surfaces and particulates. The system provides a fully integrated SEM and EDX platform for addressing the micro-scale visualization needs. It can simultaneously detect the size, shape, area, number, location and elemental composition of inclusions in steel samples. Rotary Chord Algorithm (RCA) is used to determine the characteristics. After the center of a inclusion is found, 16 chords are drawn through the center with interval of 11°. Based on the size combination of the chords, the shape and size (including the maximum diameter, the minimum diameter and the average diameter) of the inclusion can be determined. In the current work, the working magnification was set at ×225 and the minimum detectable inclusion is ~1.0 μm, and the maximum diameter was chosen as the size of inclusion.
Two statistical parameters, area fraction and number density, are defined as the following two equations to characterize non-metallic inclusions.
| (1) |
| (2) |
The chemical compositions of slag and molten steel samples are listed in Tables 1 and 2 respectively. The dissolved oxygen content of the steel measured by oxygen probes before LF refining of the two heats was 0.0007% and 0.0051% respectively. Table 1 shows that the slag basicity is high after the addition of synthetic slag in LF refining process especially for the second heat, which is benefit for desulfurization of the molten steel and reducing FeO and MnO in the slag. The variation of sulfur content in steel and sulfur distribution ratio (defined as LS = (%S) / [%S]) is presented in Fig. 1.
| Heat No. | Process | SiO2 | Al2O3 | CaO | MgO | S | CaO/ SiO2 | T.Fe +MnO |
|---|---|---|---|---|---|---|---|---|
| 1 | BOF End | 10.97 | 1.86 | 37.13 | 8.61 | 3.38 | 29.60 | |
| LF 4 min | 10.78 | 25.79 | 37.90 | 7.70 | 0.020 | 3.52 | 8.69 | |
| LF 15 min | 8.24 | 22.75 | 51.88 | 6.52 | 0.056 | 6.30 | 2.24 | |
| LF 29 min | 8.81 | 23.07 | 51.47 | 7.08 | 0.056 | 5.84 | 1.24 | |
| Soft blowing 3 min after Ca | 9.88 | 26.02 | 48.89 | 6.27 | 0.104 | 4.95 | 0.89 | |
| Soft blowing 13 min after Ca | 11.41 | 21.99 | 49.97 | 6.20 | 0.112 | 4.38 | 0.90 | |
| 2 | BOF End | 13.74 | 2.02 | 45.91 | 8.64 | 3.34 | 20.03 | |
| LF 3 min | 7.19 | 19.82 | 54.22 | 5.23 | 0.028 | 7.54 | 3.64 | |
| LF 14 min | 7.66 | 18.82 | 54.27 | 5.03 | 0.028 | 7.08 | 3.85 | |
| LF 25 min | 7.13 | 19.41 | 55.98 | 5.73 | 0.036 | 7.85 | 2.63 | |
| LF 35 min | 6.80 | 19.97 | 53.13 | 5.53 | 0.048 | 7.81 | 4.28 | |
| After Ca–Fe wire injection | 5.79 | 21.57 | 57.16 | 6.24 | 0.048 | 9.87 | 0.80 | |
| Soft blowing 9 min after Ca | 5.26 | 23.55 | 55.31 | 6.21 | 0.052 | 10.52 | 1.30 |
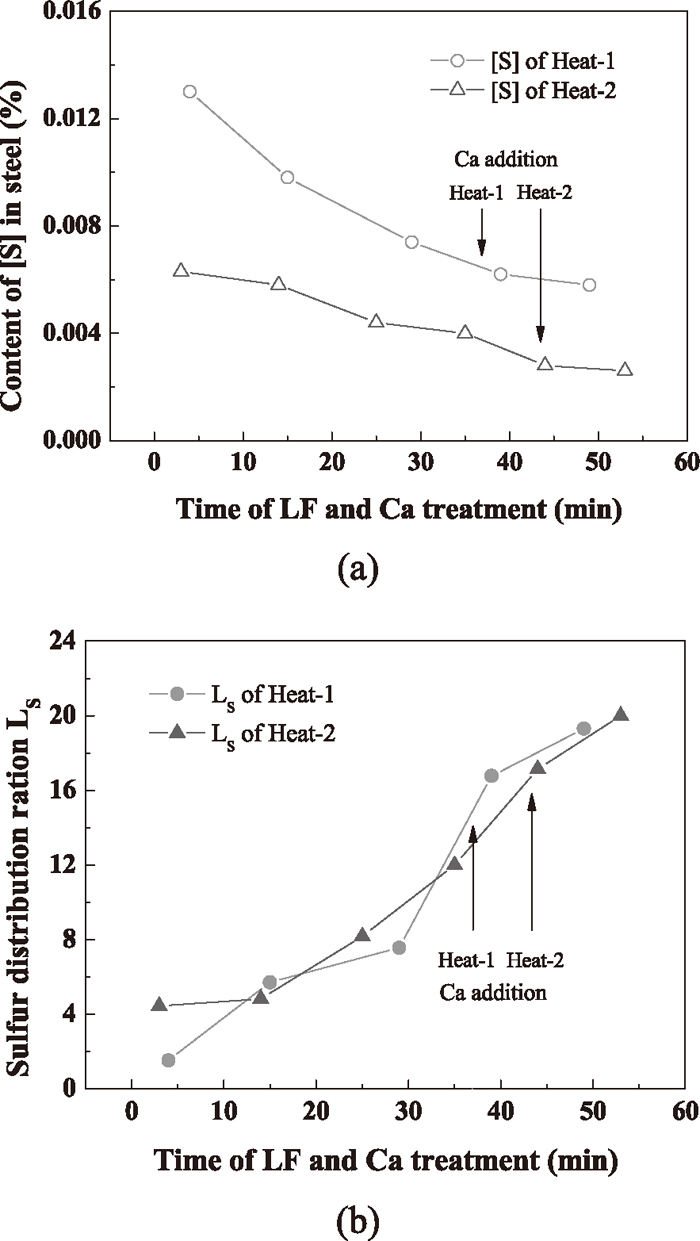
Variation of (a)-[S] and (b)-LS during the refining process.
Table 2 and Fig. 1 indicate that the sulfur content decreased significantly with increasing refining time, and the second heat had lower sulfur content. Before calcium treatment, the sulfur content is 0.0074% for the first heat and is 0.0040% for the second one. A higher initial sulfur may be owing to more carry-over of the BOF during tapping. The variation of sulfur distribution ratio of the two heats is almost the same no matter the big difference of the initial sulfur content.
| Heat No. | Process | C | Si | Mn | P | S | T.Ca | T.Mg | Alsol |
|---|---|---|---|---|---|---|---|---|---|
| 1 | LF 4 min | 0.042 | 0.016 | 0.19 | 0.0082 | 0.0130 | 0.0007 | 0.0003 | 0.019 |
| LF 15 min | 0.0098 | 0.0003 | 0.0003 | 0.015 | |||||
| LF 29 min | 0.039 | 0.014 | 0.21 | 0.0102 | 0.0074 | 0.0004 | 0.0003 | 0.045 | |
| Soft blowing 3 min after Ca | 0.0062 | 0.0037 | 0.0007 | 0.036 | |||||
| Soft blowing 13 min after Ca | 0.041 | 0.029 | 0.21 | 0.0102 | 0.0058 | 0.0031 | 0.0005 | 0.036 | |
| 2 | LF 3 min | 0.039 | 0.001 | 0.17 | 0.0076 | 0.0063 | 0.0008 | 0.0004 | 0.0018 |
| LF 14 min | 0.0058 | 0.0004 | 0.0003 | 0.016 | |||||
| LF 25 min | 0.0044 | 0.0004 | 0.0003 | 0.041 | |||||
| LF 35 min | 0.046 | 0.018 | 0.18 | 0.0084 | 0.0040 | 0.0006 | 0.0003 | 0.062 | |
| After Ca–Fe wire injection | 0.0028 | 0.0029 | 0.0006 | 0.048 | |||||
| Soft blowing 9 min after Ca | 0.040 | 0.025 | 0.19 | 0.0084 | 0.0026 | 0.0033 | 0.0007 | 0.049 |
By adding synthetic slag and aluminum to the slag, the content of (T.Fe + MnO) in slag was decreased to <1.5% at the end of LF refining, which ensures the stable subsequant Ca treatment and prevent the reoxidation of the dissolved aluminum into alumina by FeO and MnO in the slag.
3.2. Total Oxygen and Nitrogen in SteelTotal oxygen in steel is well used to be a cleanliness criterion, especially for LCAK steel, and it really represents the level of small oxide inclusions (less than 50 μm) only.10,11,12) The difference in nitrogen content between steelmaking vessels is an indicator of the air entrainment during transfer operations.12,13)
The variation of nitrogen and total oxygen in steel samples is shown in Fig. 2. Owing to the deoxidation and the removal of inclusions, the total oxygen decreased significantly during LF refining process, especially at the earlier stage. After Ca treatment, both the total oxygen and nitrogen increased more or less, which might be attributed to the reoxidation caused by the boiling of molten steel on the near-surface of the molten pool at time of Ca–Fe wire injection that was induced by the high steam pressure of calcium. The nitrogen content during LF refining process was almost no apparent change but increased approximately 9 ppm after the addition of calcium alloy.
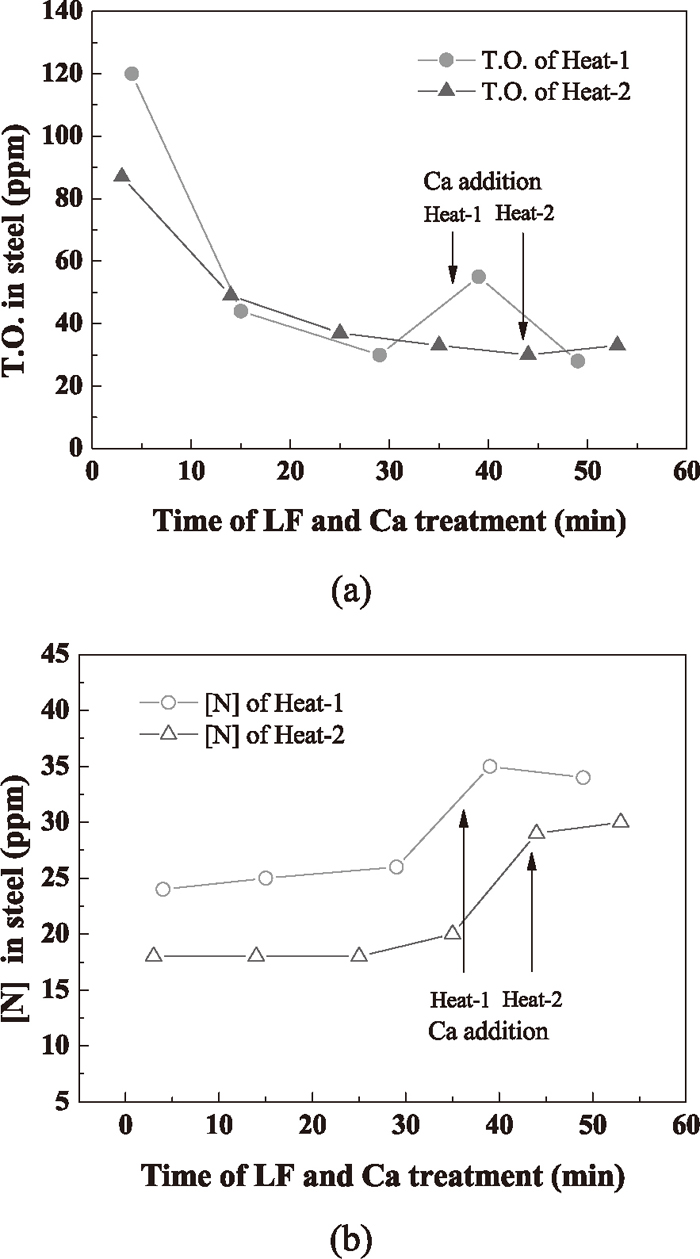
Variation of (a) T.O. and (b) [N] during LF and Ca treatment.
Over 1000 inclusions larger than 1 μm were analyzed for each steel sample using ASPEX by scanning over 60 mm2. The variation of the composition and morphology of inclusions during LF refining process is shown in Fig. 3, where the scanning area and the detected number of inclusions on each sample are presented, and the curved area in the ternary phase diagram is the liquid region of low melting inclusions at 1873 K.
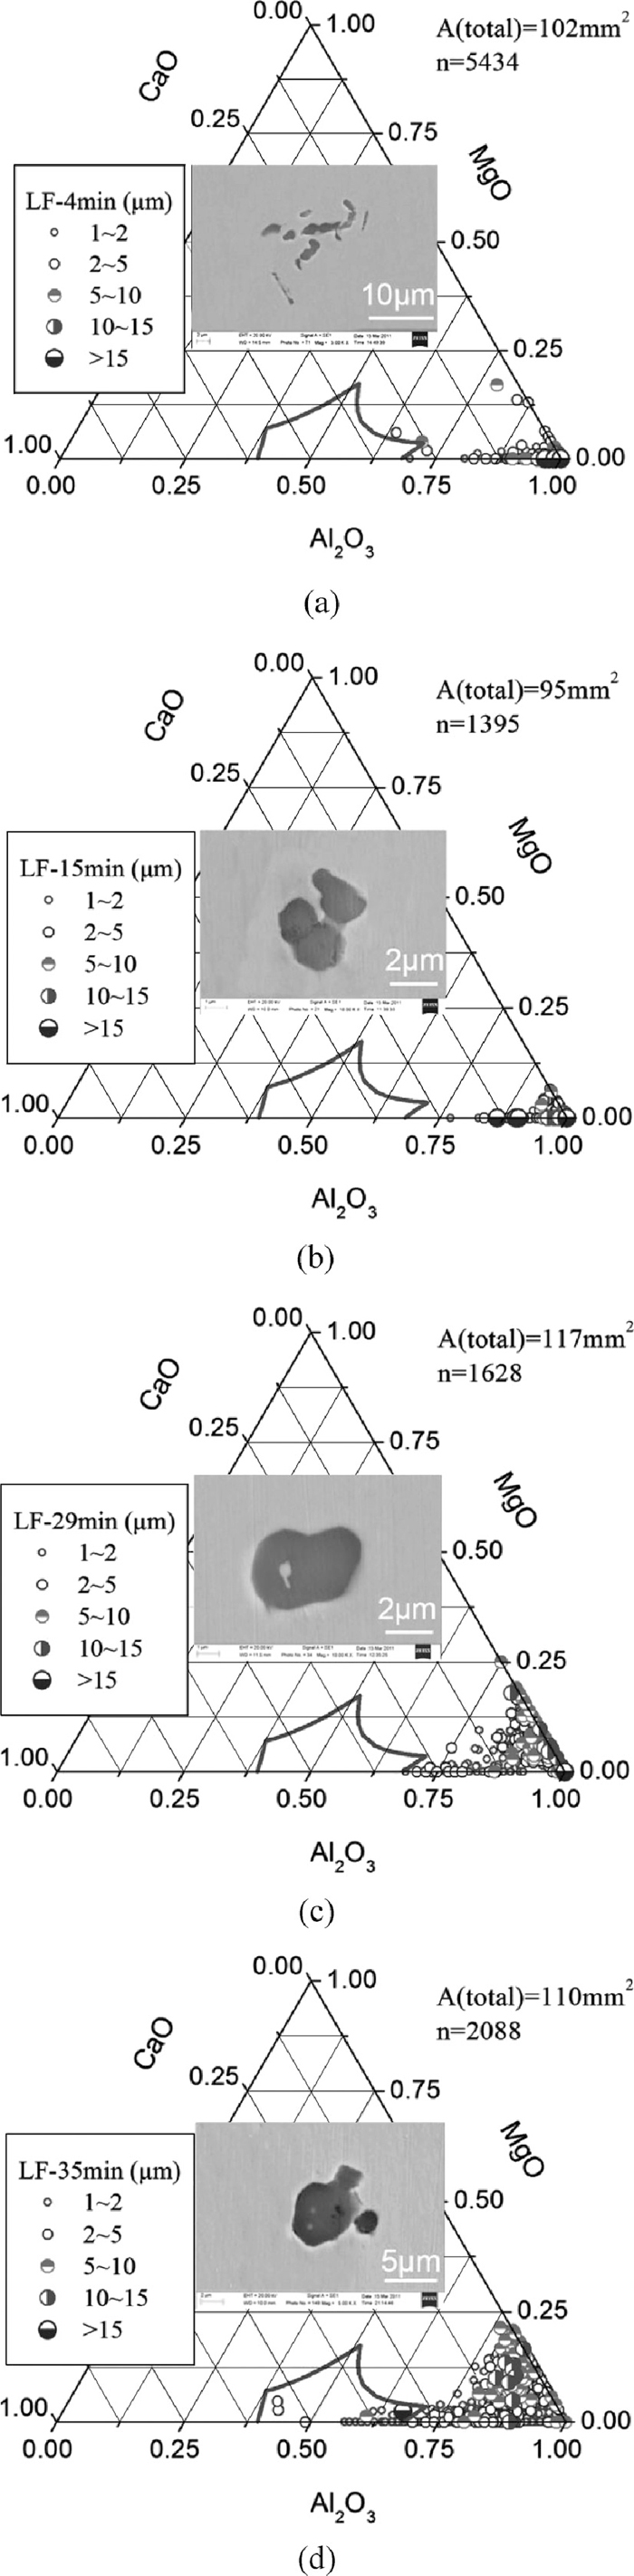
Variation of inclusion composition and typical morphology during LF refining process, (a) LF-4 min; (b) LF-15 min; (c) LF-29 min; (d) LF-35 min.
At 4 min refining time, inclusions were mainly alumina with irregular or cluster shape. At 15 min, although the composition of inclusions had no obvious change, their morphology were relatively more regular. After 29 min refining, the MgO and CaO contents in inclusions increased (Fig. 3(c)). The MgO–Al2O3 inclusions were mainly > 5 μm, while calcium aluminate inclusions were smaller, mainly < 5 μm. Two possible reasons are: (1) For the current experimental conditions, alumina were changed to MgO–Al2O3 inclusions firstly, and then changed to calcium aluminates as the dissolved calcium content in steel increased. (2) As reported,14) MgO–Al2O3 inclusions larger than 5 μm are difficult to be modified while < 2 μm MgO–Al2O3 inclusions are easy to be modified into calcium aluminates. Due to the low calcium concentration in steel and the slow diffusion speed of calcium ion in inclusions, the change of MgO–Al2O3 inclusions was slow, leaving the insufficient change of large size spinel inclusions and the existence of small calcium aluminate inclusions. As refining time further increasing, the contents of MgO and CaO in inclusions increased as well (Fig. 3(d)). However, the compositions of most inclusions, especially those > 5 μm ones were still located out of the liquid zone at 1873 K. Some inclusions at this time were changed to nearly spherical.
Liquid inclusions are desired to avoid nozzle clogging during casting. It is well known that calcium can modify alumina inclusions into calcium aluminates or react with sulfur to form CaS.15) Thus, two connected ternary diagrams of Al2O3–MgO–CaO system and Al2O3–CaS–CaO system are used to study the variation of inclusion composition after calcium treatment.
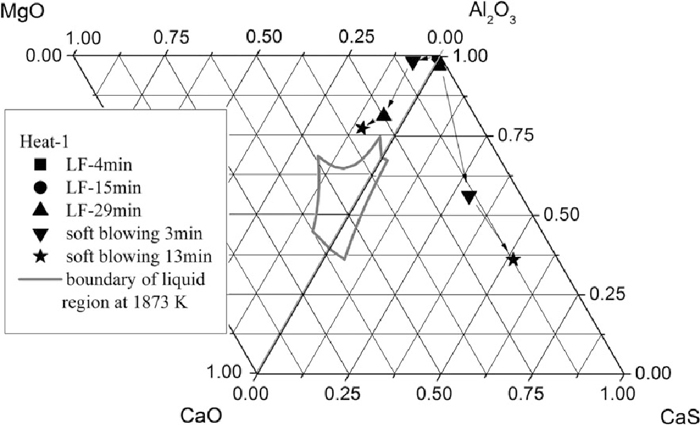
The composition of inclusions in steel at soft blowing time of 3 min and 13 min after calcium treatment of Heat-1 are shown in Figs. 4 and 5, indicating that with time increasing more and more MgO–Al2O3–CaO inclusions were shifted away from the corner of alumina and were modified to liquid. Almost all inclusions that were mainly smaller than 5 μm contained large amount of CaS. With time increasing, the Al2O3 content in inclusions decreased and CaS content increased (shown in Fig. 5), which might be owing to the continuous modification reaction of Al2O3 to calcium aluminate and the reaction between sulfur and calcium to form CaS. The current result is different from that of Verma et al.16,17) who claimed that immediately after calcium treatment CaS formed adhering to alumina or spinel, and longer after calcium treatment the CaS disappeared and spinels were fully or partially modified. After calcium treatment most of the inclusions were changed to spherical shape and with small size of < 5 μm. Even after 13 min soft blowing, many inclusions were still located out of the liquid zone on the Al2O3–MgO–CaO ternary diagram.
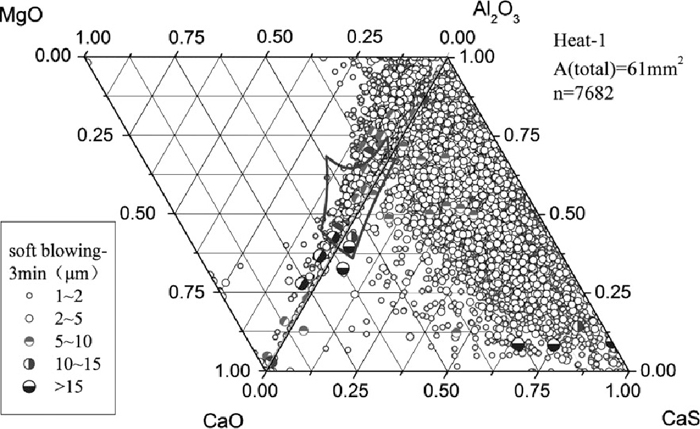
Inclusion composition at 3 min after calcium treatment of Heat-1.
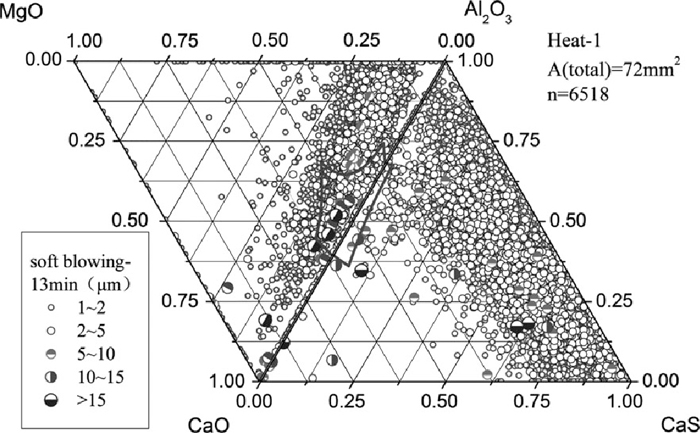
Inclusion composition at 13 min after calcium treatment of Heat-1.
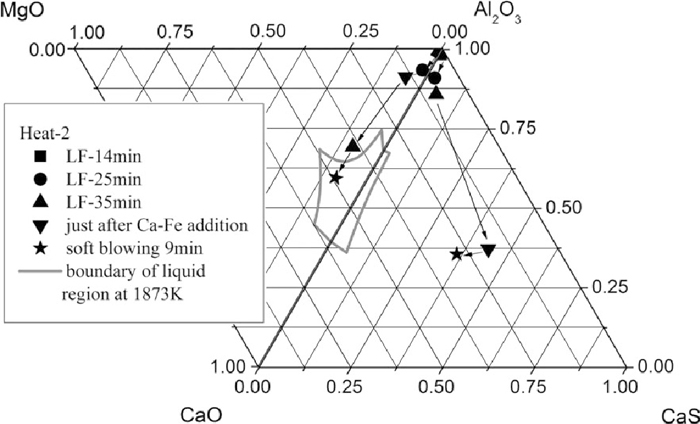
Compared to Heat-1, inclusions after calcium treatment of Heat-2 contained more amount of CaO (Figs. 6 and 7), resulting in a better modification so that many inclusions changed to liquid at 1873 K, especially the calcium aluminates with size >5 μm, which formed by the direct reaction between the dissolved calcium and aluminum and oxygen. After 9 min soft blowing, the CaO content in inclusions increased compared to that immediately after Ca–Fe wire injection, generating many large calcium aluminate inclusions with high melting point and a composition of C3A+CaO (where C is CaO and A is Al2O3) that were caused by slightly excessive calcium addition. Meanwhile, the morphology of inclusions changed to spheres and a great amount of CaS precipitated, the same as Heat-1. However, the number of >5 μm inclusions detected by ASPEX was larger than that of Heat-1. Compared Figs. 6 and 7, with time increasing after calcium addition for Heat-2, the number of large inclusions, especially 5–10 μm ones, increased.
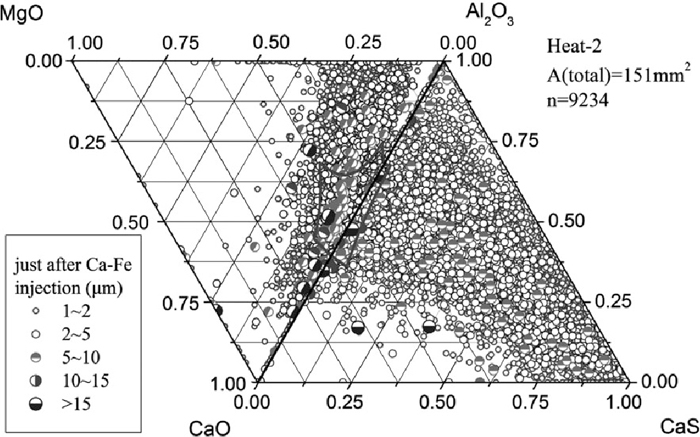
Inclusion composition just after Ca–Fe wire injection of Heat-2.
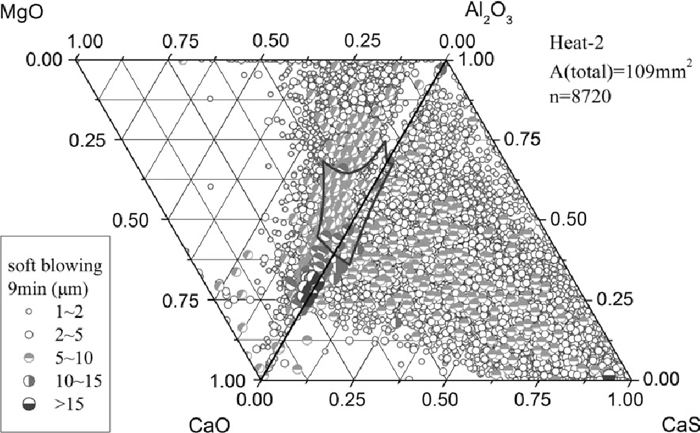
Inclusion composition at 9 min after calcium treatment of Heat-2.
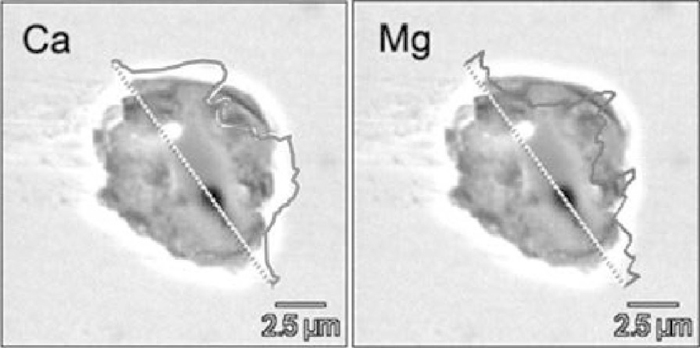
The element mappings of typical oxide inclusions during LF refining and calcium treatment are shown in Fig. 8, where inclusions (a) and (b) are from middle and later stages of LF refining respectively, and inclusions (c) and (d) are from earlier and later stages of soft blowing process after calcium treatment. At the middle stage of LF refining, spinel type inclusions with homogeneous elements distribution were formed firstly, as the refining time increased, CaO started to generate at the outside of the spinel inclusions. After calcium treatment, the inclusions changed to calcium aluminates or calcium magnesium aluminates. It should be noticed that the size of inclusions with uniform Al–Mg–Ca or Al–Ca distribution were < 5 μm.
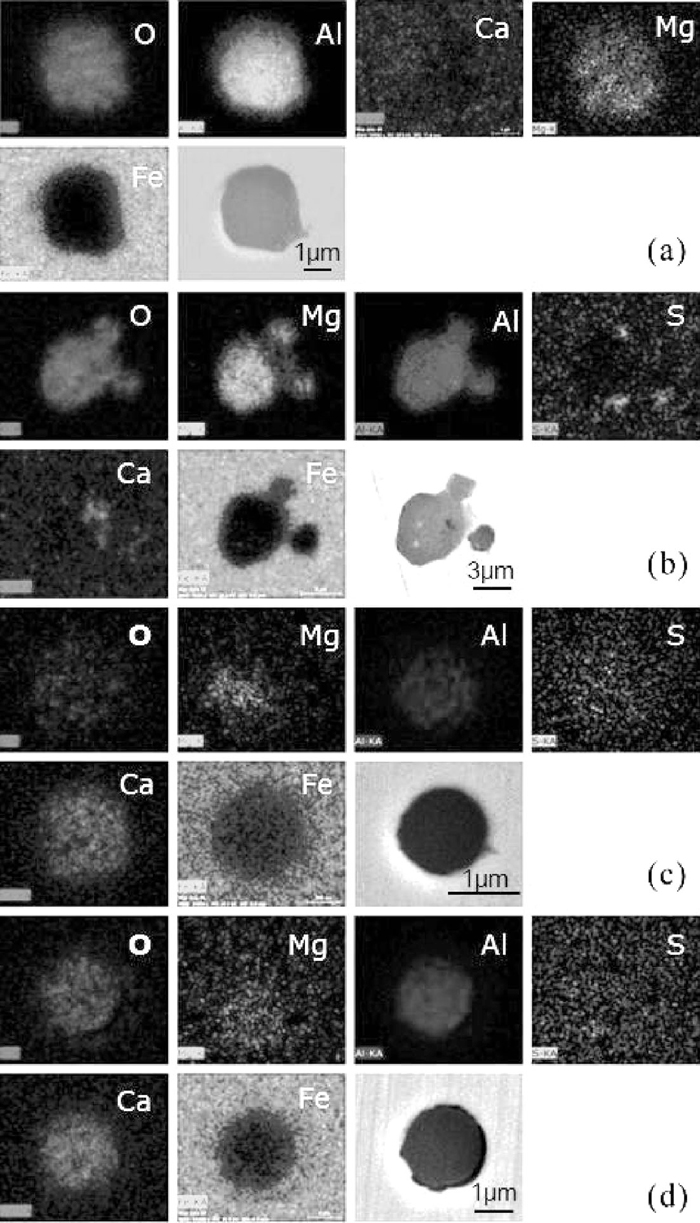
Element mappings of typical oxide inclusions (a) spinel type with Mg and Al homogeneously distributed at middle stage of LF; (b) CaO at outside before Ca treatment; (c) calcium-aluminate with a small amount of MgO after Ca treatment; (d) calcium-aluminate or calcium-magnesium-aluminate with elements uniformly distributed after Ca treatment.
The average composition evolution of inclusions during LF refining and calcium treatment are presented in Figs. 9 and 10. The process of change of oxide inclusions was: alumina → spinel type → calcium aluminate. For Heat-1, after calcium treatment, the average composition of oxide inclusions was still out of the liquid zone, while that of Heat-2 was changed to the expected liquid area. The main reason for this difference is that the precipitation of CaS consumed large amount of calcium that was expected to be used to modify inclusions to calcium aluminates with low melting point. Figure 9 clearly shows that with the increasing of soft blowing time in Heat-1, the average CaS content in inclusions increased while the CaO content changed little. However, for Heat-2, with time increasing after calcium addition, the CaO content increased and CaS content decreased with almost constant Al2O3 content.
Average composition evolution of inclusions during refining of Heat-1.
Average composition evolution of inclusions during refining of Heat-2.
The distribution of CaS in inclusions after calcium treatment can be classified into three types: collision with oxide, surrounding oxide, and uniformly distributed within oxide, as shown in Fig. 11. For the first type, CaS occupied a part, even approximately half of a inclusion with a clear boundary line, like a CaS colliding with a spinel or calcium aluminate (Fig. 11(a)). For the second type, CaS surrounded a calcium magnesium aluminate, like a CaS ring precipitating the outside of an aluminate (Fig. 11(b)). For the third type, CaS homogeneously distributes within a calcium aluminate inclusion, and no obvious dividing boundary (Fig. 11(c)). The formation mechanisms of the three forms will be discussed later.

The types of CaS distribution in inclusions, (a) collision with oxide; (b) surrounding oxide; (c) uniformly distributed within oxide.
The variation of ND and AF of inclusions during LF refining and calcium treatment is shown in Fig. 12. During the first 15 min, both ND and AF decreased significantly. After 15 min refining, the ND of inclusions changed little, while the AF continued to decrease before calcium treatment, which was consistent with the variation tendency of T.O. (Fig. 2). Since the AF of inclusions contains the factors of both ND and size, it is more accurate to characterize the content of inclusions. After calcium treatment, both of the two parameters increased sharply, which was caused by the massive generation of CaS inclusions and possible slight reoxidation of molten steel during the process of calcium addition.
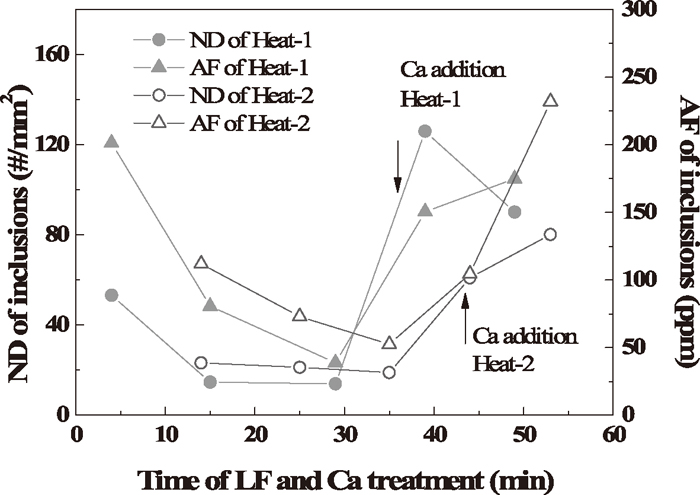
Variation of ND and AF of inclusions during LF refining and calcium treatment.
The variation of the average size of inclusions is shown in Fig. 13. With the rapid decreasing of the ND of inclusions at the first 15 min, the average size of inclusions increased, which was caused by the aggregation of inclusions. Afterwards, the average size kept decreasing until the addition of calcium due to the fact that large inclusions were removed by flow transport and bubble floatation, which explains the decreasing of AF but not ND. After calcium treatment, the average size of inclusions increased again, especially for Heat-2 owing to the independent growth of inclusions by element diffusion or the aggregation of inclusions.
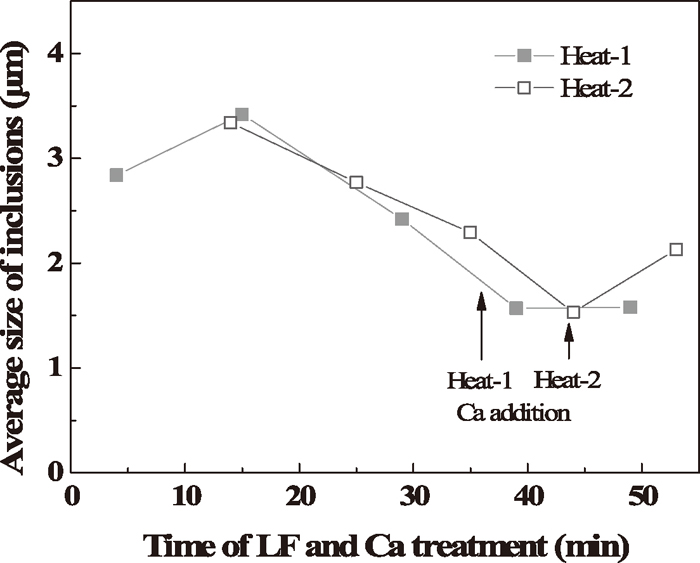
Variation of the average size of inclusions during LF refining and calcium treatment.
The main task of LF refining and calcium treatment is to modify inclusions from solid to liquid at steelmaking temperature to prevent nozzle clogging during continuous casting. As mentioned above, the composition of inclusions changed obviously during the refining and calcium treatment process. However, even after calcium treatment, many oxide inclusions especially during Heat-1 were still not modified to liquid ones because of the precipitation of large amount of CaS inclusions. In order to understand the modification of inclusions by calcium treatment more accurately, the thermodynamic calculation was performed and discussed below.
4.1. Formation Thermodynamics of Oxide Inclusions 4.1.1. Formation of Al2O3, MgO and MgO·Al2O3 InclusionsTo study the possibility of the formation of spinel inclusions, the MgO/MgO·Al2O3/Al2O3 stability phase diagram is assessed by performing thermodynamic calculations for the formation of MgO, MgO·Al2O3 and Al2O3 inclusion in molten steel. The calculation procedure and the thermodynamic data were described elsewhere.14)
In order to compare the effect of activity of MgO·Al2O3 on the formation region of MgO·Al2O3, The phase stability diagrams as a function of [Mg] and [Al] contents in steel at 1873 K are calculated for two cases (case 1: aMgO=1, aAl2O3=1, aMgO⋅Al2O3=1; case 2: aMgO=1, aAl2O3=1, aMgO⋅Al2O3=0.47) and are shown in Fig. 14, which agree well with that by Itoh.18) It is indicated that with lower activity of MgO·Al2O3, the MgO·Al2O3 stable region becomes wider, which means its formation is easier. Besides, the low oxygen activity zone in MgO·Al2O3 stable region becomes wider as well, which indicates that the formation of MgO·Al2O3 can help to obtain lower oxygen activity easier. The formation of MgO·Al2O3 is also affected by the dissolved oxygen in steel. This figure shows that thermodynamically when [%Al] = 0.02~0.05 (the general aluminum content in LCAK steel), MgO·Al2O3 can be formed when the [Mg] in steel ranges from 0.3 ppm to 7 ppm in case of aMgO⋅Al2O3=1 and from 0.2 ppm to 9 ppm in case of aMgO⋅Al2O3=0.47. The steel composition before calcium treatment located in the MgO·Al2O3 stable region (shown as the symbols in Fig. 14(a)), however, actually the alumina was not fully changed to MgO·Al2O3 spinel in the plant experiment.
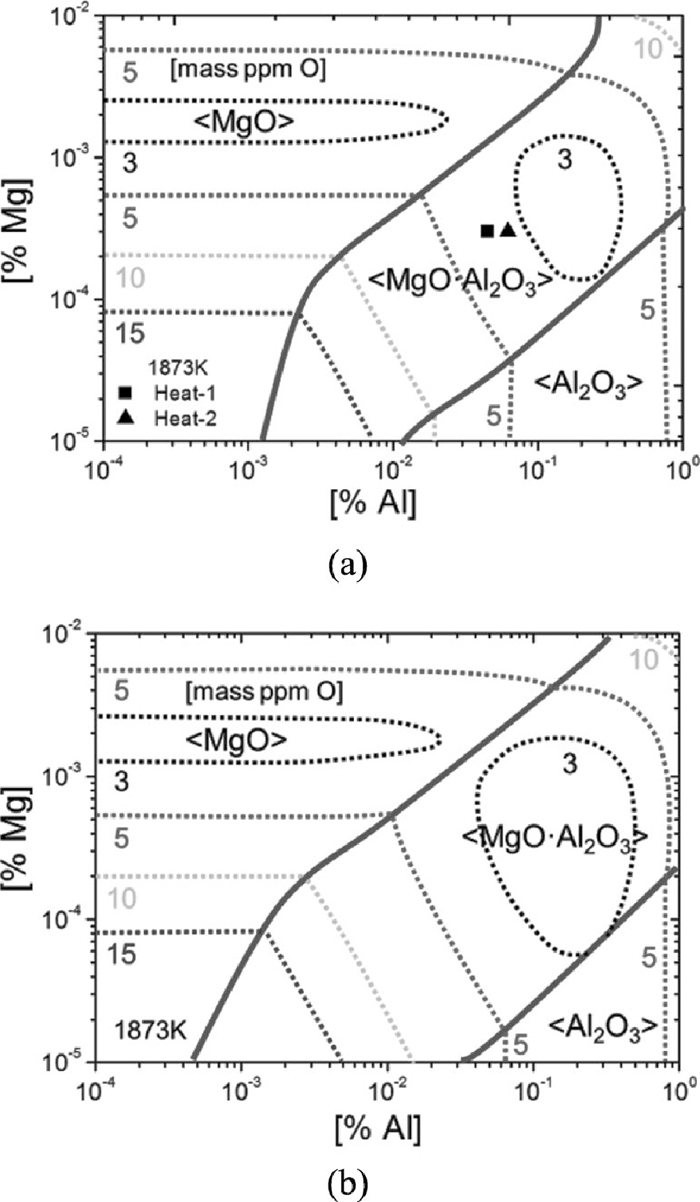
Phase stability diagram of MgO, MgO·Al2O3 and Al2O3 inclusions, and iso-oxygen contour lines at 1873 K with the experimental data, where [%Ca]=0, (a) aMgO⋅Al2O3=1; (b) aMgO⋅Al2O3=0.47.
Many studies on the modification of alumina by calcium treatment have been reported,19,20,21,22,23,24,25,26,27) and some models have been proposed.25,26,27) There are few thermodynamic calculation on the transformation of MgO·Al2O3 spinel inclusions by calcium treatment.14,16,17)
Composite deoxidation by Mg, Al and Ca is considered. If the CaO–MgO–Al2O3 inclusions are liquid in molten steel, they have been proved to be the most stable phase.28) Neglecting the small amount of MgO, the composition of the calcium aluminate inclusions should be close to 12CaO·7Al2O3. The formation of 12CaO·7Al2O3 can be expressed by the following equation.
| (3) |
From the related thermodynamic data of deoxidation equilibrium of aluminum and calcium reported by Itoh et al.29,30) and the Eqs. (4), (5) below, the equilibrium constant of Eq. (3) can be derived as Eq. (6).
| (4) |
| 31) (5) |
| (6) |
The solid phase of calcium aluminate at steelmaking temperature is assumed as CaO·2Al2O3, and the formation can be expressed by Eq. (7), the equilibrium constant of which, shown as Eq. (8), is derived from those of aluminum and calcium deoxidation reported by Itoh et al.29,30) and of the formation of CaO·2Al2O3 from CaO and Al2O3 reported by Nagata et al.32)
| (7) |
| (8) |
The activity of dissolved element i in molten steel is based on 1% mass fraction of Henry’s standard state. The first and second order interaction coefficients used in the current work were listed elsewhere.18,29,33,34,35) Since some of the second order interaction coefficients of Ca are invalid, the relevant second order interaction coefficients of Ca are not considered in this study. The activity of 12CaO·7Al2O3 and CaO·2Al2O3, whose standard state are taken as pure solid, are approximately taken as unity. The steel composition used in the calculation is the average values of the two heats after calcium treatment shown in Table 2.
The calculated stable phase diagrams of MgO, MgO·Al2O3, CA2 and C12A7 in cases of [Ca]= 1 ppm and [Ca]= 2 ppm are shown in Fig. 15. Under the current contents of Al and Mg, the full modification of spinel to liquid calcium aluminate could thermodynamically occur even if only 2 ppm of dissolved calcium exists in the steel.

Stability diagram of MgO, MgO·Al2O3, 12CaO·7Al2O3 and CaO·2Al2O3, and iso-oxygen contour lines at 1873 K, (a) [Ca]= 1 ppm, (b) [Ca]= 2 ppm.
However, in the current work the formation of MA or CMA (C: CaO, M: MgO, A: Al2O3) is due to the modification of other inclusions, for example, MA is formed by the reaction between [Mg] and Al2O3, and CMA is formed by the reaction between [Ca] and MA. The formation of MA and CMA involves the diffusion of elements both in liquid steel and in solid oxide. Since the diffusion in solid oxide is much slower than in liquid steel and liquid oxide, the formation rate of MA and CMA mainly depends on the diffusion in solid oxide, which is much slow. Thus, it is assumed that the formation of MA and CMA from full modification of other inclusions is under non-equilibrium in the plant production especially when the oxide is large and before Ca treatment. That is why although there existed 3–8 ppm Ca before calcium treatment, solid inclusions with high amount of Al2O3 rather than liquid calcium aluminates were observed in the current study. More Ca is required and the operation of Ca treatment promotes the reaction.
4.2. Formation Thermodynamics of Calcium SulfideCaS inclusions may be generated directly by the reaction between sulfur and calcium, shown as Eq. (9), the collision between oxide and sulfide, as observed in the current experiment, may be by this approach (Fig. 11). CaS inclusions may also be generated by the reaction between CaO and sulfur (Eq. (11)), and the surrounding type and uniform type in Fig. 11 may belong to this case.
| (9) |
| 36) (10) |
| (11) |
| 25) (12) |
During the calculation, the activity of CaS, whose standard state is taken as pure solid, is assumed to be unity. And the activities of elements Ca and S are based on 1% mass fraction of Henry’s standard state. The steel composition after Ca treatment shown in Table 2 and the aforementioned first order interaction coefficients18,29,34,35) are also used in the calculation.
At steelmaking temperature, the precipitation of CaS decreases the modification effect of alumina by calcium treatment as it hinders the formation of calcium aluminate, and causes nozzle clogging additionally. Furthermore, the formation of CaS at casting temperature worsens the castability of steel. Therefore, the control of steel composition is discussed at 1873 K (steelmaking temperature) and 1823 K (casting temperature).
The calculated stability diagram of CaS in the case of direct formation at 1873 K and 1823 K is shown in Fig. 16, indicating that at equilibrium, when the sulfur content in steel is 0.0040%, the calcium content should be less than 0.0048% in order to prevent the direct formation of CaS at 1873 K, while at 1823 K it should be less than 0.0019%.
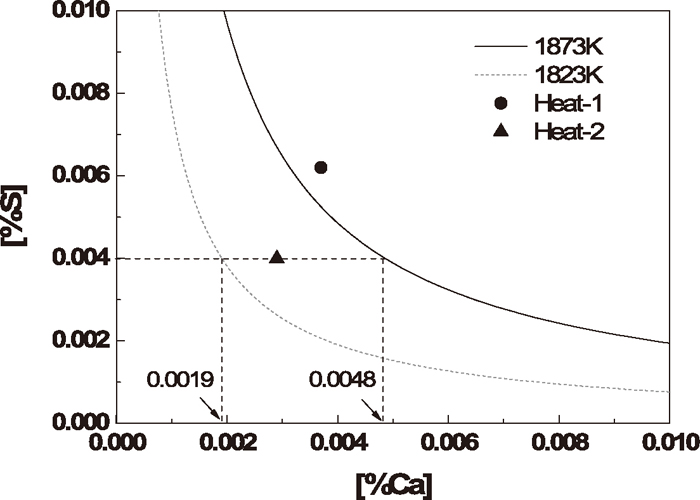
Stability diagram of CaS in case of direct precipitation.
The two symbols present the steel composition after calcium treatment, showing that at 1873 K, CaS may be formed directly in Heat-1, while the direct CaS formation can be avoided in Heat-2, however, it may be formed as the temperature decreases. Besides, because of the fixed location of Ca–Fe wire injection, the calcium content may be very high at local areas, inducing the direct formation of CaS.
For case two that sulfur reacts with CaO, owing to the low solubility of CaS in calcium aluminate, about 3.3 mass% at CaO/Al2O3 = 1.0 and at 1873 K reported by Ozturk,37) the activity of CaS is assumed to be equal to 1. It is assumed that the calcium aluminate is C12A7. Ye et al.25) calculated the activities of CaO and Al2O3 to be 0.526 and 0.0267 respectively. The relationships between [Al] and [S] at equilibrium with liquid C12A7 and CaS inclusions at 1873 K and 1823 K are shown in Fig. 17.
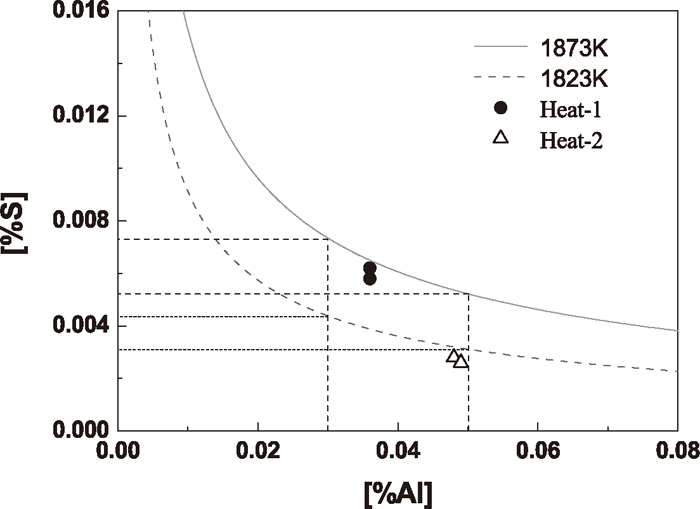
Stability diagram of CaS by reacting with CaO in C12A7 inclusions.
As shown in Fig. 17, the [S] content for CaS precipitation decreased with increasing [Al] content in steel. The temperature influences the precipitation significantly. Lower temperature favors the precipitation of CaS. Thus, the calcium treatment temperature could be increased in order to prevent the formation of CaS. Thermodynamically, if the [Al] content in steel is 0.03%–0.05%, in order to prevent the precipitation of CaS on surface of liquid calcium aluminate, the [S] content should be controlled less than 0.0073%–0.0052% at 1873 K and less than 0.0044%–0.0031% at 1823 K.
CaS is a simple compound, and there is no composition change in its formation. In addition, CaS usually forms on the surface of inclusions where the component has been changed to liquid C12A7, such as the aforementioned surrounding type, the formation rate mainly depends on the diffusion of elements such as [S] and [Ca] in liquid steel and ions in liquid oxide, which is much faster than in solid oxide, so it is assumed that the formation of CaS is under equilibrium. The symbols shown in the figure represent the steel composition after calcium treatment of the two experimental heats. In Heat-1 the CaS precipitation on surface of calcium aluminate could be avoided if the temperature is over 1873 K, while in Heat-2 CaS would hardly precipitate by reacting with CaO in inclusions even though at 1823 K. Thus, it is harder for CaS precipitation in Heat-2 than in Heat-1, which is consistent with the experimental observation.
It is certain that the solidification of steel promotes the precipitation of CaS because of the segregation of elements during cooling and solidification process. Thus, CaS probably precipitates on the surface or in the inner part of MgO·Al2O3 spinel or calcium aluminate inclusions even though there is little CaS at steelmaking temperature, leading to the existence of CaS distribution type of surrounding oxide or uniformly distributed within oxide.
4.3. Change Mechanism of InclusionsAccording to the experimental results (Figs. 8 and 11), a change mechanism for both oxide and sulfide inclusions is proposed.
The [Mg] and [Ca] created by the reaction between [Al] in molten steel and MgO and CaO in slag or refractory20,38) enter the bulk of melt, and transfer to the surface of Al2O3 inclusions. Then some MgO·Al2O3 and CaO–MgO–Al2O3 form on the surface of Al2O3 inclusions as Eqs. (13) and (14) respectively:
| (13) |
| (14) |
Since the diffusion of Mg is faster than Ca in a same matrix,39,40,41) MA generates earlier than CMA.
The modification mechanism of large spinel inclusions by calcium treatment is illustrated in Fig. 18, which gives the unreacted core model of change of MgO–Al2O3 system inclusion into CaO–Al2O3 system inclusion. Firstly, MgO·Al2O3 inclusion reacts with [Ca] on its surface, expressed by Eq. (15):
| (15) |

Schematic for the modification of a MgO·Al2O3 inclusion.
A CaO·MgO·Al2O3 layer generates on the surface of the MgO·Al2O3 inclusion. The [Ca] in the molten steel transfers to the surface of CaO·MgO·Al2O3 layer while the [Mg] created by the reaction transfers from the surface into the molten steel. The following reaction takes place on the outer surface of the CaO·MgO·Al2O3 layer:
| (16) |
When the outer surface has totally changed to CaO–Al2O3 system, the reaction presents as the following equation. As the reaction proceeds, the outer surface transfers to liquid along with the path of CaO·6Al2O3→CaO·2Al2O3→ CaO·Al2O3→12CaO·7Al2O3, and the inclusion morphology changes to spherical shape.
| (17) |
There exists a concentration gradient of CaO and MgO in the outside layer, shown in Fig. 19, resulting in that the Ca2+ in the outer part with higher amount of CaO continues to diffuse toward the inner part containing lower CaO, while Mg2+ diffuses from the inner part to the outer part. So inside the outer layer, there is a reaction expressed by Eq. (18):
| (18) |
Concentration gradient of CaO and MgO in a inclusion.
On the interface between the outer layer and the MgO·Al2O3 core, the following reaction takes place:
| (19) |
Besides, there also may be some [Ca] diffuses to the surface of MgO·Al2O3 core through the outer layer, and reacts with the core according to Eq. (15). By these reactions, the spinel type inclusion could finally changes to xCaO·yMgO· zAl2O3 type inclusion.
However, the modification effect depends on the size of initial spinel inclusion, as described elsewhere.14) When the size is relatively large, the inclusion after calcium treatment may have a spherical calcium aluminate outer layer with an irregular spinel core. When the size is small, the time is long enough for the complete modification, consequently resulting in a spherical magnesium calcium aluminate with homogeneous distribution of elements in the inclusion.
As mentioned above, a large amount of CaS precipitated after calcium treatment which dramatically worsened the modification effect. There were three main CaS distribution types observed, including collision with oxide, surrounding oxide, and uniformly distributed within oxide, shown in Fig. 11. The possible formation mechanisms of the three types are illustrated in Fig. 20.
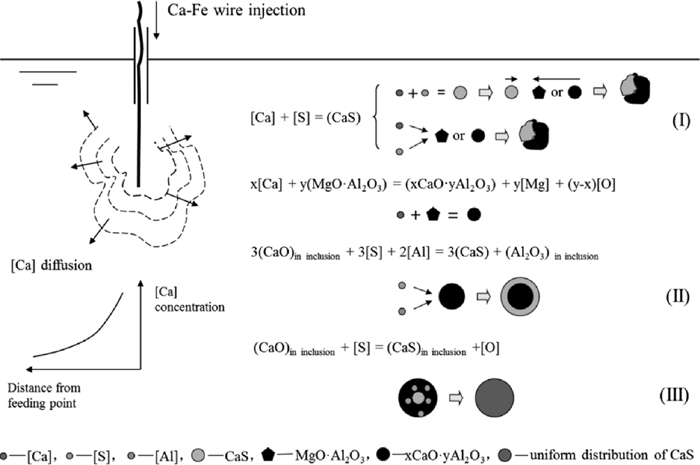
Schematic for the formation of CaS with different distribution types.
The type of collision with oxide mainly formed after calcium addition. The local high concentration of calcium in the melt (for example near the feeding point shown in Fig. 20) induced the precipitation of a large amount of solid CaS particles, which then collided with spinel or calcium aluminate inclusions, leaving the existence of morphology of collision with oxide. Another possible formation way of this type is that spinel or calcium aluminate particles acted as the nuclei of heterogeneous nucleation, and CaS precipitated on their surfaces without consuming Ca in the nucleus particles.
The type of surrounding oxide may be formed during the modification process of MgO·Al2O3 spinel or alumina to calcium aluminate. When the activity of CaO on the surface of calcium aluminate increases to a critical value, or as temperature decreasing, a layer of CaS precipitates on the particle surface according to Eq. (5). On one hand, the precipitation consumes CaO contained in the calcium aluminate. On the other hand, it hinders the diffusion of [Ca] in molten steel to calcium aluminate surface. These two aspects induce the lower CaO content in calcium aluminate, leading to the incompletely modification of inclusions.
The uniform distribution type may be formed by the precipitation of CaS dissolved in calcium aluminate during the temperature decreasing process. Calcium aluminate corresponds to a binary CaO–Al2O3 slag, and the sulfide capacity can be calculated by the optical basicity of slag.42) The calculated sulfide capacity of C12A7 is 0.035%, and it was reported that the solubility of CaS in C12A7 is about 3.3% at 1873 K.37) As temperature decreasing, CaS precipitates in calcium aluminate owing to the decreasing solubility of CaS.
A plant trial of LCAK steel production was performed, and characteristics of inclusions during LF refining and calcium treatment were investigated. Thermodynamic equilibriums between Mg, Al, O as well as MgO·Al2O3 spinel and calcium-aluminate and calcium-sulfide formation were studied to understand the fundamentals of inclusion modification. Furthermore, the change mechanisms of oxide inclusion and calcium-sulfide precipitation were discussed. The following conclusions were obtained:
(1) Oxide inclusions almost changed along with the path of Al2O3→MgO·Al2O3→(MgO·)CaO·Al2O3 during LF refining and calcium treatment. However, it was a little different from the thermodynamic calculation. There were still many inclusions located out of the liquid region even though after calcium treatment owing to the initial large size of inclusions and the precipitation of a large amount of CaS.
(2) There were three distribution types of CaS: collision with oxide, surrounding oxide, and uniformly distributed within oxide. The possible formation time of each type are after calcium addtion, during the modification process of MgO·Al2O3 spinel or alumina to calcium-aluminate, and during temperature decreasing process, respectively. The formation of CaS extremely worsened the modification effect of inclusions.
(3) The area fraction of inclusions is more suitable and accurate to characterize the amount of inclusions than the number density of inclusions. Ladle refining process efficiently decreased the amount of inclusions, while after calcium treatment, the amount of inclusions increased significantly, especially large inclusions.
(4) Based on the thermodynamic analysis, MgO·Al2O3 spinel inclusion is easy to form. It is estimated that only approximately 0.5 ppm [Mg] is needed when [Al] in steel is 0.04%. With 7 ppm [Mg], the transformation from MgO·Al2O3 spinel to liquid calcium-aluminate could occur even if with only 2 ppm calcium in the molten steel. However, more [Mg] and [Ca] contents are required in plant practice since the reactions are under non-equilibrium.
(5) The inclusions of CaS are undesirable in the LCAK steel. At equilibrium, when the sulfur is 0.0040%, in order to prevent the direct precipitation of CaS at 1873 K, the calcium should be less than 0.0048%, while at 1823 K it should be less than 0.0019%. Assuming that the [Al] is 0.03%–0.05%, to prevent the precipitation of CaS on the surface of liquid calcium- aluminates, the [S] content should be less than 0.0073%–0.0052% at 1873 K and less than 0.0044%–0.0031% at 1823 K.
The authors are grateful for support from the National Science Foundation China (Grant No. 51274034), the High Quality Steel Consortium at University of Science and Technology Beijing (China), and Shougang Jingtang United Iron & Steel Co. (China) for industrial trials.