Abstract
The gusset plates typically employed for connecting steel members to each other in the lateral load resisting systems are always an important part of truss bridges and braced frames. We can recognize that when considering the tragic collapse of the I-35W Minnesota highway bridge on August 1, 2007, the failure of gusset plates in particular leaded to destroy the whole structure. Many researchers have been increasingly interested in the adequate design of such critical panel points as motivated by this accident. In order to follow up on this research trend, this study is intended to examine design strength models on the basis of feasible failure patterns for the gusset plates, thereby calculating their strength capacities. In addition, the inelastic behavior of existing gusset plates is investigated through a series of detailed finite element (FE) analyses, and then strength models specified in the current design specifications are evaluated based on the FE analysis results. According to individual failure modes, safety and load rating factors deliberately applied to gusset plate design are finally assured by observing the distribution of plastic stresses on the gusset plate.
1. Introduction
The interstate highway 35W (I-35W) bridge over the Mississippi river in Minneapolis, Minnesota, collapsed within a matter of seconds at 6:05 p.m. on August 1, 2007. The 508 m long bridge with the 8 traffic lane fell into the water, resulting in 13 fatalities, 145 injuries, and 111 vehicles involved in the collapse (see Fig. 1). In the worldwide, this type of steel truss bridge has been commonly used for middle-to-long spans that carry heavy loads.1) Until the accident occurred, steel truss bridges had made the solid reputation of being reliable and economical.2,3) However, many scientists were often induced to focus significant attention on reliability and safety for bridge design after I-35W bridge failure. In particular, apparent evidence relevant to this bridge failure was pointing toward gusset plates (see U-10 panel point in Fig. 1(b)), which were vulnerable to buckling and fracture, as the initial event in the collapse sequence.4,5,6) Therefore, adequate gusset plate design has been requested for the prevention of relapse, including safety assessment. Ordinarily, the gusset plates that connect chord members to compression diagonals and tension diagonals are designed to be stronger than the truss members, and thus shall not control the capacity of the structure.

There are several available approaches to gusset plate design. Engineering principles based on the allowable stress design (ASD) method were previously applied to gusset plate design.7,8,9) In the aftermath of the I-35W bridge failure event, the Federal Highway Administration (FHWA) issued a technical design advisory emphasizing the necessity to check strength capacity along with the connected member into the gusset plate through the reliability-based load rating process.10,11) This design advisory provided additional guidance based on the best available modern information regarding gusset plate design for bridge engineers, including load rating design examples.10) In other words, the FHWA put in place an implementation plan to address recommendations concerning the factored load-carrying capacity of the gusset plates in the non-load path redundant steel truss bridges. Accordingly, in this paper, the load and resistance factor design (LRFD) method adopted in the current American Association of State Highway and Transportation Officials (AASHTO) Specifications12) is used for gusset plate design in an effort to keep pace with these technical changes that are recently occurring. The basic strength of the presented gusset plates will be evaluated in accordance with this LRFD method.
To improve gusset plate design, nonlinear analyses should be conducted using finite element (FE) models. For untested specimens, the verified FE models have been used to accurately predict inelastic behavior and stress-strain distribution. They are considered very reliable for the simulation of the complex. Some of these FE analyses have been utilized to perform parametric studies that provide insight and guidance for structural design, due to the advantage of being easily scalable to model.13,14,15,16) Despite these merits, the advanced FE models that are made up of 3 dimensional (3D) solid elements incorporating fully nonlinear material properties, geometric nonlinearity, contact interactions, and initial bolt pretension are limited to achieving practical design purposes in massive and complicated structures. It is because they require not only high computational cost but also sophisticated preparation process. In the related researches previously established,6,17,18) FE analyses were performed only by modeling a local part of gusset plate connections with an intention to avoid these problems. The information gained from these old-fashioned analyses was too restrictive to evaluate the entire gusset plates subjected to multi-axial loads in terms of response mechanisms, failure modes (i.e., strength limit states), and resistance capabilities. The global FE models rendered precise enough to investigate a whole pattern of gusset plate behavior with reasonable memory size are treated for this reason.
In view of the above, this paper is intended to present a state-of-the art study with regard to design approaches for the full-scale gusset plates. For the purpose of determining the capacity of the gusset plate connection, the factored resistance against the patterns of failure observed after the bridge collapse needs to be estimated according to the currently used LRFD method. In addition, the detailed FE analyses are conducted on the critical gusset plate connection in the existing steel truss bridge. The outcomes from these FE analyses have been used to check life safety at the strength limit state as well as to gain visible insight into the causes of possible failure mechanisms.
2. Selection of Representative Example
The gusset plate connection in the existing steel truss bridge was selected for further study. First of all, scrutinizing original bridge drawings should be required to better understand a design example for the selected gusset plate connection. The plan and elevation views provided from the I-94 steel truss bridge over the Little Calumet River in the US state of Illinois (IL) are presented in Fig. 2. In this study, design examples for the I-94 bridge rather than the I-35W one were taken into consideration to avoid overlapping a little with the established researches. This I-94 bridge was designed according to the AASHTO 1989 Standard Specifications based on the ASD method in 1990 and opened to traffic in 1993. The major part of the bridge is 128 m (420¢) long, 33 m (108¢) wide, and single span steel deck superstructure. The steel deck was separated for southbound and northbound. Each deck accommodated three 3.7-m (12¢) traffic lanes and two 0.6-m (2¢) shoulders. The main truss that rested on the roller supports consisted of 12 panels, each of which was 10.7 m long. The truss members were braced by lateral bracings between upper chords and lower chords, and thus designed in the Warren style. More information on this truss bridge is given by references.19,20,21)

The typical gusset plate connection, the focus of this study, is shown in Fig. 3. As can be seen in the figure, the gusset plate connection referred to as the L2 joint (see also Fig. 2) was designed on the basis of the original bridge drawings without considering any changes that occurred during the life time.19,20) The five load carrying members were connected to the gusset plates and designed to ensure that they remain elastic up to the ultimate load. The chord members and compression diagonal were made up of welded box sections, while the vertical member and tension diagonal were made up of built-up I-sections. The box section members have the same size, i.e., 470 mm (18.5″) wide by 686 mm (27″) deep, but their thicknesses are different from each other as shown in Fig. 3(a). The tension diagonal has 533 mm (21″) flange width with 48 mm (1.9″) thickness and 375 mm (14.8″) web height and with 19 mm (0.8″) thickness. The vertical member was built up by the welding of two C type channels. These members lay between double gusset plates each with 29 mm thickness. The filler plates were used between gusset plates and chord members.

The gusset plates were fabricated by SS490 (ASTM A572-Gr. 50) mild steel with a Young’s modulus of 200 GPa (29000 ksi), a Poisson’s ratio of 0.3, and a yield strength of 345 MPa (50 ksi). The dimensions of the representative gusset plates (L2) are presented in Fig. 3(b). This gusset plate connection belongs to relatively modern design using high-strength bolts (i.e., ASTM A490 bolt). The 25 mm diameter bolts were used in the top and bottom chord splice plates, while the 22 mm diameter ones were used to fasten the chord members and diagonals to the gusset plates. The bolt holes were drilled with 25 mm diameter on the gusset plates and aligned with each of different gage and pitch lengths. They were equal to the nominal diameter of the bolt shank plus 3 mm. The connection between the gusset plates and compression diagonal had only ten rows of fasteners, and so the compression diagonal side was designed with relatively shorter free-edge lengths as compared to other sides. Besides, this compression diagonal had a relatively large distance from the point of five members’ convergence. For the gusset plates considered herein, their resistance strength against each failure pattern will be calculated in the next section.
3. Design Resistance Strength
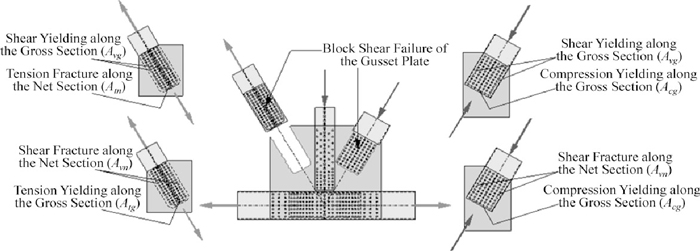
The capacity of the gusset plate connection shall be determined as the least resistance strength of the gusset plates in compression, shear, and tension. The failure modes feasibly occurring at the gusset plate subjected to such forces are thus investigated, and then design strength to resist each type of failures, such as yielding, buckling, and fracture will be discussed in this section. The LRFD method specified in the AASHTO Specifications is intended to be applied to gusset plate design as mentioned above. Since almost modern truss bridges in the world have either riveted or bolted gusset plates, the focus of this study is on the connection with bolted gusset plates.
The forces that act on the gusset plate shall be preferentially established for design. They are considered as the factored demand in the LRFD method and denoted as follows:
where,
ηi is a load modifier factor relating to the ductility, redundancy, and importance of the component being designed and the structure itself,
γi is a statistically based load factor,
Pi is the applied force, and
Pr represents the factored force. The specific values of these factors are provided by the AASHTO Specifications considering various failure modes. They are typically taken as more than 1.0. On the other hand, the resistance strength of the gusset plate is considered to be the factored capacity for each failure mode and specified as follows:
where,
ϕ is a statistically design resistance factor applied to the nominal resistance of the component being designed (
Rn) and
Rr indicates the factored design resistance. For each failure mode, the factored capacity shall be larger than the factored demand so as to satisfy safe design requirements (
e.g.,
Pr <
Rr). The rating factor for life safety (RF) is defined as the factored capacity divided by the factored demand, such that
The gusset plates subjected to axial tension shall be investigated for three conditions: (1) yield on the gross section area, (2) fracture on the net section area, and (3) block shear rupture. The Whitmore method may be accepted to determine gross and net section areas on the gusset plate. Figure 4 provides examples for estimating the effective width in tension according to the Whitmore method.7) The effective width can be established by drawing two 30-degree lines from the external fasteners within the first bolt row and obtained by measuring a line perpendicular to the axis of the member, which intersects these two inclined lines at the center of the last bolt row. The section areas determined in accordance with the Whitmore method are given as follows:
|
A
nw
=(W-
n
b
d
h
)
t
g
| (5) |
where,
Agw is the gross section area,
Anw is the net section area,
W is the width of the Whitmore section,
nb is the number of the bolts at the last bolt row,
dh is the diameter of the bolt hole, and finally
tg represents the thickness of the gusset plate. Both yielding on the gross section and fracture on the net section shall be simultaneously checked to determine dominating resistance strength, and factored design resistance strength for the gusset plate in tension (
Rrw) shall be taken as the least of the values given by yielding or fracture.
|
R
rw
=ϕ
R
nw
=min[
(
ϕ
y
F
y
A
gw
), (
ϕ
u
F
u
A
nw
)
]
| (6) |
where,
Fy and
Fu indicate specified yield and ultimate stress, respectively. The design resistance factor for yielding (
ϕy) is taken as a value of 0.95, while that for ultimate fracture (
ϕu) is taken as a value of 0.80.
10,12) These factors are also applied to the nominal tensile resistance of the gusset plates (
Rnw). After fracture of the net section area, the progressive collapse of the gusset plate connection takes place quite rapidly prior to yielding. To avoid this problem, design resistance strength that becomes governing shall be based on the yielding of the Whitmore section being the desirable ductile failure mode.

For other failure patterns, block shear failure can occur at the gusset plates where tension members are attached as shown in Fig. 5. The block shear failure of the gusset plates has been studied by a number of researchers.8,22,23,24) The AASHTO Specifications particularly requires that all tension connections including the gusset plates should be investigated for block shear rupture. Similar to tension fracture, block shear rupture is considered to be a brittle-mannered failure mode. The resistance to block shear failure is that resulting from the combined strength of parallel and perpendicular planes; one in axial force and the others in shear force. The following equations are specified in the AASHTO Specifications and used to check this strength limit state.
|
If
A
tn
≥0.58
A
vn
,
R
rbs
=ϕ
R
nbs
=
ϕ
u
(0.58
F
y
A
vg
+
F
u
A
tn
)
| (7) |
|
Otherwise,
R
rbs
=ϕ
R
nbs
=
ϕ
u
(0.58
F
u
A
vn
+
F
y
A
tg
)
| (8) |
where,
Rrbs is the factored design resistance strength for block shear failure,
Avg is the gross section area along the plane resisting shear,
Atn is the net section area along the plane resisting tension,
Avn is the net section area along the plane resisting shear, and finally
Atg indicates the gross section area along the plane resisting tension. The design resistance factor (
ϕu) is also taken as a value of 0.80 because of ultimate brittle failure. Then again, the gusset plate connection under compression can be optionally checked for block shear failure to use the following equations.
|
R
rbsg
=ϕ
R
nbsg
=
ϕ
u
0.58
F
y
A
vg
+
ϕ
c
F
y
A
cg
| (9) |
|
R
rbsn
=ϕ
R
nbsn
=
ϕ
u
0.58
F
u
A
vn
+
ϕ
c
F
y
A
cg
| (10) |
|
R
rbs
=ϕ
R
nbs
=min[
ϕ
R
nbsg
, ϕ
R
nbsn
]
| (11) |
The definition of notations is illustrated in
Fig. 5. The design resistance factor for compression yielding (
ϕc) is taken as a value of 0.90. In this case, the only gross section area is used along the perpendicular plane resisting compression (
i.e.,
Acg).
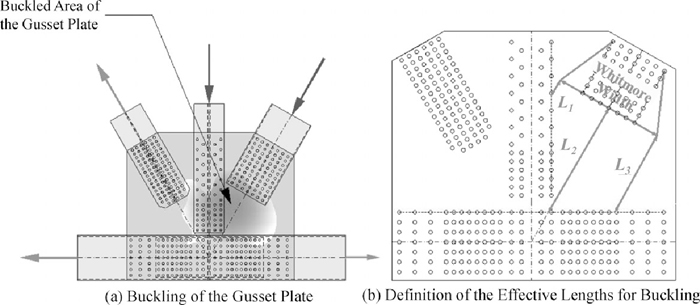
Buckling occurs within the inner areas of the gusset plates, depending on how many connected members such as diagonals, verticals, and chords are in compression (see Fig. 6(a)). In addition to the proximity of the connected members, stress states and boundary conditions have an influence on the resistance of the gusset plates under compression. This buckling failure can be prevented or delayed by adding plate stiffener to the inner compressive areas. The effective width defined by the Whitmore method has been also used to evaluate the buckling capacity of the gusset plates subjected to direct compression. The inner area of the gusset plates in compression is considered as idealized column members in compression due to absence of more rigorous analyses. So, the un-braced length (Lc) may be determined as the average of three distances as follows:
|
L
C
=
L
1
+
L
2
+
L
3
3
| (12) |
Including the effective width for a gusset plate in compression, a good example for
L1,
L2, and
L3 distance is given to
Fig. 6(b). The following equations also specified in the AASHTO Specifications are used to evaluate the factored design resistance strength (
Rrcrw) according to the slenderness ratio as follows:
|
λ=
K
L
C
π
t
g
12
F
y
E
| (13) |
|
If λ≤1.5,
R
rcrw
=ϕ
R
ncrw
=
ϕ
c
0.658
λ
2
F
y
A
gw
| (14) |
|
Otherwise,
R
rcrw
=ϕ
R
ncrw
=
ϕ
c
0.877
λ
2
F
y
A
gw
| (15) |
where,
K indicates the effective length factor stipulated in the traditional column buckling equation and
E indicates the elastic modulus of the base steel material. Depending on sway condition and buckled shape, the effective length factor for gusset plate design may be taken as a value of 1.2.
10,12) The value of 0.90 is applied to the design resistance factor for buckling. The gross section area (
Agw) coincides with that obtained by the Whitmore method (see
Eq. (4)).
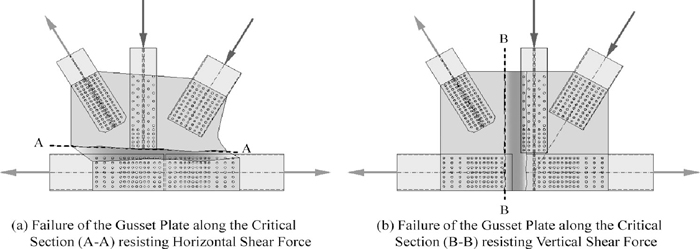
The resistance strength for the gusset plates subjected to flexural shear shall be taken as the lesser one to resist shear yielding on the gross section (Rrg) and shear fracture on the net section (Rrn) as follows:
|
R
rg
=ϕ
R
ng
=
ϕ
vy
0.58
F
y
A
g
U
| (16) |
|
R
rn
=ϕ
R
nn
=
ϕ
vu
0.58
F
u
A
n
| (17) |
where,
Ag and
An represent the gross area and the net area on the critical section resisting shear, respectively. The design resistant factor for shear yielding is recommended as
ϕvy = 0.95 to be consistent with that for tension yielding. The reduction factor (
U) shall be taken as a value of 0.74 used for flexural shear as specified in the current provisions.
10,12) The design resistance factor for shear fracture (
ϕvu) shall be taken as 0.80 to be consistent with that for block shear fracture. Seeing that this factor already takes into consideration enough safety against fracture, adding an additional reduction factor may be overly conservative to estimate the design resistance strength.
Figure 7 shows the failure of the gusset plate along the critical yielding and net section resisting flexural shear force.
4. 3D FE Gusset Plate Connection Models
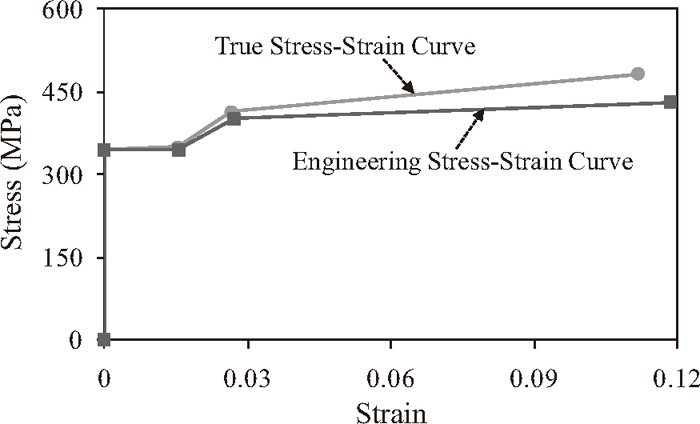
The Abaqus nonlinear FE code program was used to investigate the inelastic behavior of the representative gusset plate connection selected from the I-94 bridge (i.e., L2 joint presented in Fig. 3). The L2 joint model consisted of several independent parts as shown in Fig. 8. The FE model applied typical steel material properties shown in Fig. 9 to analysis. The material behavior of SS490 steel was simulated based on isotropic von-Mises plasticity with a yield stress (Fy) of 345 MPa, an elastic modulus (E) of 200 GPa, and a hardening ratio of 1.0%. The fully nonlinear material property obtained by the true stress-strain curve for SS490 steel was assigned to the plate parts. On the other hand, elastic material behavior was applied to the connected truss members initially designed to remain elastic throughout the test. Hence, in the FE model, we can focus on inelastic behavior and failure modes accepted at the plate parts only.
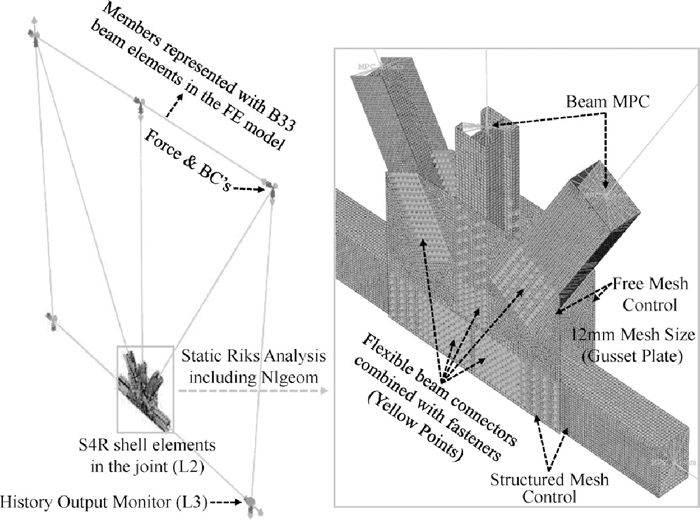
Both gusset plates and splice plates were made up of S4R (four node shell with linear order and reduced integration) elements incorporating nonlinear material properties and geometric nonlinearity (Nlgeom). These plates were modeled as located at their mid-thickness. The uniform shell element size taken as 12 mm was distributed over the gusset plate with a view to providing a numerical solution of the response contours appropriately converging. The truss members connected to the gusset plates were modeled using shell elements up to a length of approximately two times member depth (2d) from the edge of the gusset plate. Other parts of the truss member were modeled with eight B33 (three node beam with nonlinear order) elements. As can be seen in the figure, these beam elements were connected to the edge of shell element sections by means of beam-type multipoint constraints (MPCs) provided in the program.
In the FE model, inelastic bolt behavior can be simulated by multi-linear stiffness models that are derived by fitting into nonlinear curves as shown in Fig. 10. These nonlinear curves indicating force and displacement relationships for high-strength bolts subjected to direct shear (Rsb vs. Δsb) are formulated using an empirical equation stipulated in the AISC-LRFD manuals as follows:
|
R
sb
=
R
ult
(1-
e
-10
Δ
sb
)
0.55
| (18) |
where,
Rult represents the ultimate capacity of the shear bolts.
25) These derived multi-linear stiffness properties were applied to the in-plane shear response parallel to the direction of the applied loads. The out-of-plane response of the bolts was assumed to be elastic behavior reproduced by a stiffness of simple elastic bars. The in-plane shear response behaves more flexibly as compared to the out-of-plane response and so has become dominate in the behavior of the bolt component.

The bolt components were modeled with Cartesian plus Align beam connectors in which three rotational degree of freedoms (DOFs) are restrained and only three translational ones are available. The extra constraints that bolt heads or nuts provide on two connected surfaces are generated using the fastener command available in the Abaqus program. The fastener property includes the influence of the bolt head where displacements are constrained. This fastener property was assigned to the connector elements used for bolt modeling in the FE model. Regular-sized meshes generated using structured mesh controls help to keep this radius of bolt head influence evenly distributed over the connected plate surface. In this FE gusset plate connection model, the slip mechanism can be reproduced by adding slip distance to the behavior of the shear bolt without bolt hole modeling. However, the entire behavior of the gusset plate connection does not vary significantly for slippage typically occurring between bolt shank and hole. The bolt holes are not necessary to model explicitly owing to the fastener property and the negligible slip mechanism. As shown in Fig. 8, discrete flexible beam connectors that were combined with fasteners connected two nodes on the centerlines of faying plates.
Torsional rotations and out-of-plane displacements were restrained at the ends of the truss members in that in-plane boundary conditions (BCs) were employed in the FE model (see Fig. 8). All six DOFs for displacements and rotations were fixed at the end of the left hand chord member in order to make stable conditions. However, translational DOFs along the direction of the applied loads were released at each of the nodal joints. The intent for FE modeling described above (e.g., used element types, beam MPCs, bolt connectors, BCs and so on) is to save memory costs as much as possible, while aiming to increase the possibility of obtaining reliable results for FE analyses and to produce more accurate predictions of gusset plate behavior.
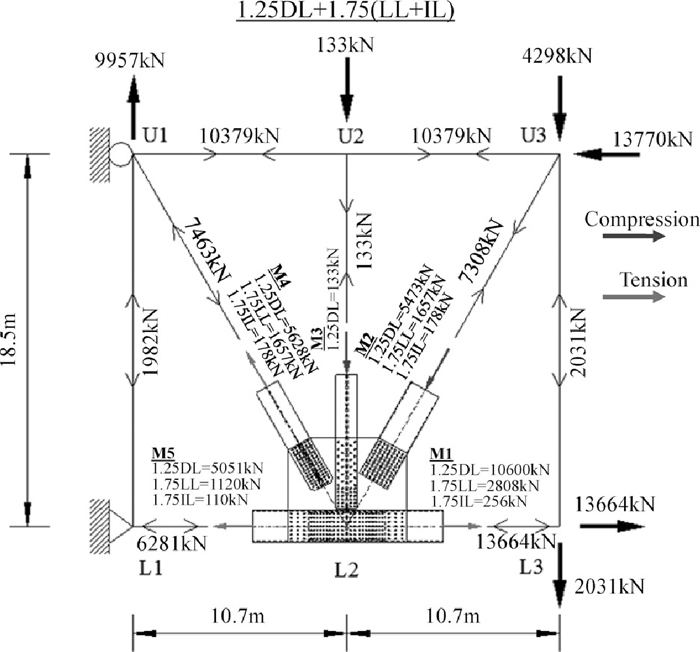
The factored design loads applied to the truss members are shown in Fig. 11. Some member forces were changed to satisfy static equilibrium. The FE analysis was implemented in two steps. The factored dead loads (1.2DL) were applied in the first step, whereas the factored live and impact loads (1.75(LL+IL)) were incrementally applied in the second step. The dead loads (DL) included the weight of all concrete and steel components at the time of original construction. The live loads (LL) were evaluated by uniformly distributing total AASHTO HS20-44 vehicle weight, and finally the impact loads (IL) were accounted for by adding approximately 10% of the vehicle loads as presented in the original drawings.19,20) These loads were imposed on the truss joint nodes using the appropriate factors for LRFD load combination (LC) (see Fig. 11, LC = 1.2DL+1.75(LL+IL)).10,11,12) The Riks analysis method was utilized to predict the maximum load at instability by proportionally increasing live and impact loads, while other dead loads were maintained to be constant at the estimated values. The nodal displacements at the L3 joint were measured by using the history output instrument in the program.
5. Strength Evaluation
The primary failure mode is difficult to define in the gusset plate connection since multiple failure patterns are often occurring at the same time. Instead, it can be suggested that investigating the RF ratios of the resistance capacity to the applied load for design is one of the most effective ways to determine the dominating failure mode. The gusset plates are very susceptible to the failure mode with the least of the RF values. According to individual failure modes feasibly occurring at the sample gusset plate, factored design resistance strengths, factored forces transferred into the plates, and corresponding RF values are summarized in Tables 1, 2, 3, 4, 5.
The forces which truss members transmit are assumed to be transferred into all splice and gusset plates in proportion to their area (see Table 1). Accordingly, the forces transferred into the gusset plates (PA) are estimated to multiply the member forces (P) by a fraction of the gusset plate area occupied at the plates (RFA).
|
R
F
A
=
A
GP
A
TCS
+
A
BCS
+
A
SCS
+
A
GP
| (20) |
where,
AGP is the cross-section area of the gusset plates.
ATCS,
ABCS, and
ASCS indicate that of top, bottom, and side chord splice plates, respectively.
The RF values range from 2.27 to 238 as presented in the tables. Block shear failure occurring at the connection between gusset plates and tension diagonal shows the least RF value (RF=2.27), meaning that the strength limit state to resist this failure mode may be firstly reached at the gusset plates subjected to incrementally increasing loads. The RF value of 2.27 theoretically represents the ability of the gusset plates to plastify along the entire plane resisting tension prior to the ultimate load. This block shear failure is succeeded by shear yielding on the gross section, indicating the RF value of 2.81 (see Table 5).
Overall, factored design strength is much larger than factored load demand. When the I-94 bridge was designed on the basis of the ASD method, the capacity of the gusset plates might be overly underestimated. In other words, the steel structures to meet design requirements for the ASD method can just accommodate a limited amount of applied loading (e.g., ASD LC= DL+LL+IL) long before arriving at static yield strength. Instead, economic design strength limits can be established by the new LRFD method, which reliably permits more load demand. In the following section, this statement will be verified by observing FE analysis results.
6. Analysis Results
From the FE analysis, the factored loads applied over two steps are expressed as follows:
|
P
r
=1.2DL+ALF[1.75(LL+IL)]
| (21) |
After factored dead loads are completely imposed on the truss joints at the first step, factored live and impact loads which start to increase at the second step are applied multiple times with applied load fractions (ALFs) (see
Fig. 12(a)). Therefore, the bridge’s structural capacity to accommodate the number of vehicles exceeding design limits is estimated through this analysis method. The ALFs and the RFs can be changed from total applied loads (
Pr) depending on what FE analysis results are used for and plotted versus vertical displacements measured at the L3 joint in
Figs. 12(a) and 12(b), respectively. The
Eq. (23) can be derived from the relationship between ALFs and RFs as follows:
|
P=RF[1.2DL+1.75(LL+IL)]
=1.2DL+ALF[1.75(LL+IL)]
| (22) |
where,
P indicates the applied load combination imposed on the truss joint nodes. The RFs for life safety are converted into the ALF using the equation given to below.
|
ALF=
1.2DL(RF-1)
1.75(LL+IL)
+RF
| (23) |
The computed RF limits for dominant failure modes occurring at the sample gusset plate are also plotted as the dotted sky-blue lines in
Fig. 12(b). The ultimate ALF of 12.92 corresponds to the ultimate RF of 4.05 at the vertical displacement of approximately 54 mm. The FE model still remains elastic up to the RF limit for buckling failure under compression (
i.e., RF=3.0 and ALF=8.8). It is shown that design strength limits derived from the LRFD method are a little conservative for failure and capacity predictions. The FE model shows strength degradation resulting from instability after reaching its ultimate load.
After FE analyses, both von-Mises stress and equivalent plastic strain distributed over the gusset plate are also investigated at each of the strength limits in order to check the failure state predicted by the RF ratio. The distributions of von-Mises stress and equivalent plastic strain (PEEQ) filed contours are shown in Figs. 13 and 14, respectively, at the given stages of the FE analysis. The accompanied-deformed configurations that need to be examined to confirm final failure shape are also found in both figures with a deformed scale factor (DSF) of 5.0.
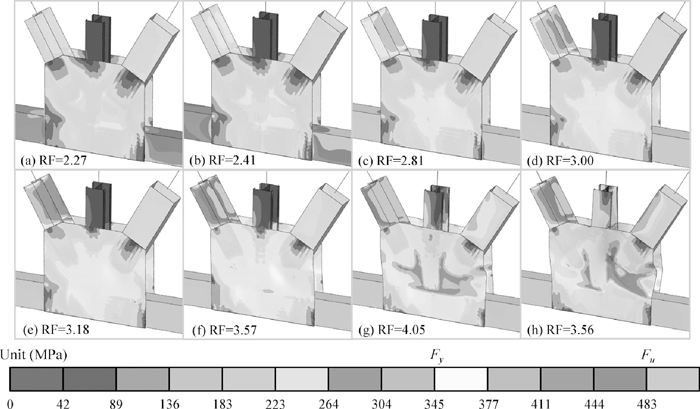
The gusset plate areas shown with the yellow contours have reached the onset of plastic yielding in the base steel material. Though the global behavior of the gusset plate connection is still elastic at the strength limit for block shear failure (RF=2.27), plastic yielding starts to occur at the part of the gusset plates where member forces converge. This von-Mises stress filed contour shows that yielding is concentrated around the plate areas adjacent to the free edges of truss members. After exceeding the strength limit of gross yielding along the A-A chord plane (RF=2.81), the plastic stress fields spread to the gusset plate area very quickly as increasing the total applied loads. A considerable amount of plastic yielding has been subsequently observed at the buckling failure limit state (RF=3.0). The instant of plate buckling at the compression diagonal is shown in the FE model when RF=3.57. The strength limit state determined in accordance with the LRFD method is somewhat conservative to predict buckling failure, and thereby possible to guarantee design safety. When RF=4.05 corresponding to the peak of the curve as shown in Fig. 12(b), the red colored contours indicating that the base steel material reaches its ultimate stress are observed at the plate areas contiguous to the edges of the members. After the ultimate state (RF=3.56), the gusset plates undergo extensive plastification and instability. At the last stage, the significant increase in out-of-plane deformation as compared to in-plane deformation confirms the evidence of buckling failure.
As shown in Fig. 14, corresponding PEEQ field contours match the von-Mises contours very well in that they are also presented to show yielded regions and plasticity patterns. The materials that are still elastic are shown with blue colored contours, while field contours that vary from light green to orange are presented to display variations in the magnitude of plastic deformations. The FE models composed of compatibility-based elements cannot capture progressive fractures. One standard indicating a point in time when fractures may begin to be concerned results in the maximum PEEQ at the mid-thickness of the plate. The maximum field contours exhibited in the areas very closed to ultimate failure are arbitrarily set up at 4% PEEQ shown with intense red color. For this model, 4% PEEQ is just reached at the peak load (RF=4.05), and so a considerable amount of plastic deformation is assumed to happen at the last stage of the FE analysis.
7. Investigations of FE Analysis Results
The general observations from FE analysis results are able to provide valuable and qualitative information on the nonlinear behavior of the gusset plate connection. Furthermore, the adequacy of the presented design method can be validated by examining the load-carrying capacity of the gusset plates after FE analysis, and then comparing with design resistance strength. The first aspect to take into consideration is to investigate normal and shear stress along the critical path where dominant failure modes take place, according to an increase in the applied load (see Figs. 15 and 16).

Figure 15 shows normal and shear stress along the path where block shear failure is likely to occur. The normal stresses are measured along the tensile load-carrying path, while the shear stresses are measured along the shear load-carrying path. As far as considering area conditions, the factored design resistance strength is determined in accordance with Eq. (8). Therefore, the strength limit to resist this failure mode is set up based on tensile yielding and ultimate shear fracture, which are depicted as the dotted sky-blue lines in Figs. 15(a) and 15(b), respectively. The normal stresses are more uniformly distributed over the gusset plate as compared to the shear stresses. The maximum normal and shear stresses do not exceed the strength limit lines as can be seen in the figures when the gusset plates are subjected to the factored load corresponding to the RF limit for block shear failure (RF=2.27). They are going over these lines at the next RF stage (RF=2.81). It is also shown that the design limit state determined by the RF value is slightly conservative to predict the corresponding failure mode. The FE model shows stress degradation resulting from instability along some parts of the stress path at the moment of reaching its ultimate load (see Fig. 15(b)). The same trend toward stress distribution is also observed in Fig. 16.

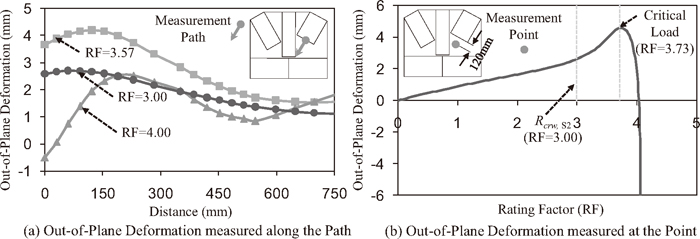
In addition to the investigation of normal and shear stresses along the critical path, out-of-plane deformations along the critical path where compression buckling is likely to occur are also examined to check the instability of the gusset plate after the peak load. Out-of-plane deformations measured along the critical path are shown in Fig. 17(a), while those measured at the critical point are shown in Fig. 17(b). The RF limit for compression buckling failure (RF=3.0) is also depicted as the dotted sky-blue line in the Fig. 17(b). Out-of-plane deformations are linearly increasing before the RF limit for compression buckling (see Fig. 17(b)). The maximum out-of-plane deformation is approximately 4.5 mm at the critical load (RF=3.73). The critical load to raise instable buckling is larger than the RF limit state for compression buckling. It is concluded that the strength limit state used for design is conservatively estimated to be less than the actual capacity of the gusset plate. Accordingly, reasonably enough safety against buckling failure can be taken into consideration for gusset plate design. Finally, the out-of-plane deformations dramatically increase toward the opposite direction immediately after the critical load of the curve (see also Fig. 17(b)).
8. Conclusions
In the aftermath of the I-35W tragic event, many engineers have been asked to develop reliable and rational recommendations used for new gusset plate design. For this motivation, the LRFD method available in the current FHWA guidance was investigated in this study. The analytical studies were also conducted so as to inspect this design recommendation. The presented design checks suggest a comprehensive methodology for determining the resistance capacity of the gusset plates when taking their dominant failure mode into account. More conclusions are summarized as follows:
(1) The detailed design procedures presented in the current AASHTO Specifications were mainly treated in order that resistance strength capacities for the gusset plates should be estimated as consistent with the LRFD method. The gusset plates subjected to axial tension or shear were checked for three failure conditions such as yielding on the gross section, fracture on the net section, and block shear rupture, whereas those subjected to compression were investigated for buckling. The factored design resistance strength for the gusset plates was taken as the least of the values given among strength capacities to resist individual failure types.
(2) The FE gusset plate connection model successfully predicted the nonlinear behavior of the gusset plate connection. The failure patterns occurring at the gusset plates were also captured well by this refined FE model, which are able to accurately reproduce the mechanism of yielding or ultimate stress along the critical load-carrying path. In addition, predictions on the resistance capacity for the gusset plates subjected to static factored loads were possibly made as observing the sequence of failure shape after analyses.
(3) The gusset plate connection model presented in this study was designed based on the previous ASD method. The strength capacity determined by the ASD method had been overly underestimated by restricting the amount of applied loading used for design long before base materials reach yield strength. On the other hand, the LRFD method can permit an increase in the strength capacity by introducing reliable design factors. For this reason, this gusset plate connection model shows relatively large LRFD-based RF values ranged from 2.27 to 238.
(4) The von-Mises stress and PEEQ filed contours distributed on the gusset plates were investigated for the purpose of checking individual failure states at the given stages of the FE analysis. They clearly presented yielding and plasticity patterns. The normal and shear stresses measured along the critical load-carrying path provided good information on the failure state as well. The out-of-plane deformations increasing at the end of the FE analysis very quickly demonstrated evidence that the presented gusset plates ultimately failed by compression buckling. After observing these resulting values, it is concluded that design strength limits determined by the LRFD method are somewhat conservative for capacity predictions due to the reduced design factors.
Acknowledgements
This research was supported by Basic Science Research Program through the National Research Foundation of Korea (NRF) funded by the Ministry of Education, Science and Technology (Grant No. 2012R1A1A1041521). The author (J. W. Hu) sincerely thanks Prof. Leon and Prof. White for their academic advices when he was a Ph.D. student and Post-Doctoral Fellow at Georgia Tech.
References
- 1) K. Yamamoto, N. Akiyama and T. Okumura: J. Struct. Eng. ASCE, 114 (1988), No. 3, 575.
- 2) A. Astaneh-Asl: Proc. of 7th Int. Symp. Int. Conf. on Steel Bridges, ECCS, Brussels, Belgium, (2008) 1.
- 3) Y. Li, J. Zhang, P. Huang and B. Yan: Proc. Int. Symp. Chinese-Croatian Joint Colloqium –Long Arch Bridges, SECON, Zagreb, Croatia, (2008).
- 4) R. Holt and J. Hartmann: Adequacy of the U10 Gusset Plate Design for the Minnesota Bridge No. 9340 (I-35W Over the Mississippi River), Turner-Fairbank Highway Research Center Report, Turner-Fairbank Highway Research Center, Mclean, VA, (2008).
- 5) National Transportation Safety Board (NTSB): Collapse of I-35W Highway Bridge, Minneapolis, Minnesota, August 1, 2007, Highway Accident Report NTSB/HAR-08/03, NTSB, Washington, DC, (2008).
- 6) M. Liao, T. Okazaki, R. Ballarini, A. E. Schultz and T. V. Galambos: J. Struct. Eng. ASCE, 137 (2011), No.1, 59.
- 7) R. E. Whitmore: Univ. of Tennessee, Engineering Experiment Station Bull., (1952), No. 16.
- 8) S. G. Hardash and R. Bjorhovde: Gusset Plate Design Utilizing Block-shear Concepts, Department of Civil Engineering and Engineering Mechanics, The University of Arizona, Tucson, AZ, (1984).
- 9) R. Bjorhovde: J. Constr. Steel Res., 9 (1988), 61.
- 10) Federal Highway Administration (FHWA): Load Rating Guidance and Examples for Bolted and Riveted Gusset Plates in Truss Bridges, FHWA-IF-09-014, FHWA, Washington, DC, (2009).
- 11) Federal Highway Administration (FHWA): Guidelines for the Load and Resistance Factor Design and Rating of Riveted and Bolted Gusset-Plate Connections for Steel Bridges, Project No. 12–84, Second Interim Report, FHWA, Washington, DC, (2010).
- 12) American Association of State Highway and Transportation Officials (AASHTO): AASHTO LRFD Bridge Design Specifications and 2008 Interim Revisions, 4th ed., AASHTO, Washington, DC, (2007).
- 13) J. W. Hu, R. T. Leon and T. Park: ISIJ Int., 50 (2010), No. 6, 883.
- 14) J. W. Hu, D. K. Kim, R. T. Leon and E. Choi: ISIJ Int., 51 (2011), No. 4, 619.
- 15) J. W. Hu, R. T. Leon and E. Choi: Int. J. Steel Struct. KSSC, 11 (2011), No. 1, 1.
- 16) J. W. Hu, R. T. Leon and T. Park: J. Constr. Steel Res., 78 (2012), 45.
- 17) P. Uriz, F. C. Filippou and S. A. Mahin: J. Struct. Eng. ASCE, 134 (2008), No. 4, 616.
- 18) J. H. Yoo, C. W. Roeder and D. E. Lehman: J. Struct. Eng. ASCE, 134 (2008), No. 6, 881.
- 19) W. J. Wright: Department of Civil and Environmental Engineering, Virginia Tech., (2009).
- 20) Illinois Department of Transportation IL DOT. 2012, http://www.dot.state.il.us.
- 21) Historic Bridge. 2013, http://www.historicbridges.org/bridges/browser/bridgebrowser=illinois /i94littlecalumet/
- 22) G. L. Kulak and G. Y. Grondin: Steel Connections in the New Millennium, AISC, Chicago, IL, (2000).
- 23) G. L. Kulak and G. Y. Grondin: Eng. J. AISC, 38 (2001), No. 4, 199.
- 24) B. B. S. Huns, G. Y. Grondin and R. G. Driver: Can. J. Civil Eng., 33 (2006), No. 4, 395.
- 25) American Institute of Steel Construction (AISC): Manual of Steel construction, Load and Resistance Factor Design (LRFD), 3rd ed., AISC, Chicago, IL, (2001).
;%0A%09%09%09newWindow.document.open();%0A%09%09%09newWindow.document.write('<img src=%22./Graphics/53_1443_tbl_1.jpg%22>');%0A%09%09%09newWindow.document.close();%0A%09%09)
;%0A%09%09%09newWindow.document.open();%0A%09%09%09newWindow.document.write('<img src=%22./Graphics/53_1443_tbl_2.jpg%22>');%0A%09%09%09newWindow.document.close();%0A%09%09)
;%0A%09%09%09newWindow.document.open();%0A%09%09%09newWindow.document.write('<img src=%22./Graphics/53_1443_tbl_3.jpg%22>');%0A%09%09%09newWindow.document.close();%0A%09%09)
;%0A%09%09%09newWindow.document.open();%0A%09%09%09newWindow.document.write('<img src=%22./Graphics/53_1443_tbl_4.jpg%22>');%0A%09%09%09newWindow.document.close();%0A%09%09)
;%0A%09%09%09newWindow.document.open();%0A%09%09%09newWindow.document.write('<img src=%22./Graphics/53_1443_tbl_5.jpg%22>');%0A%09%09%09newWindow.document.close();%0A%09%09)
;%0A%09%09%09newWindow.document.open();%0A%09%09%09newWindow.document.write('<img src=%22./Graphics/53_1443_tbl_6.jpg%22>');%0A%09%09%09newWindow.document.close();%0A%09%09)
;%0A%09%09%09newWindow.document.open();%0A%09%09%09newWindow.document.write('<img src=%22./Graphics/53_1443_tbl_7.jpg%22>');%0A%09%09%09newWindow.document.close();%0A%09%09)
;%0A%09%09%09newWindow.document.open();%0A%09%09%09newWindow.document.write('<img src=%22./Graphics/53_1443_tbl_8.jpg%22>');%0A%09%09%09newWindow.document.close();%0A%09%09)
;%0A%09%09%09newWindow.document.open();%0A%09%09%09newWindow.document.write('<img src=%22./Graphics/53_1443_tbl_9.jpg%22>');%0A%09%09%09newWindow.document.close();%0A%09%09)
;%0A%09%09%09newWindow.document.open();%0A%09%09%09newWindow.document.write('<img src=%22./Graphics/53_1443_tbl_10.jpg%22>');%0A%09%09%09newWindow.document.close();%0A%09%09)
;%0A%09%09%09newWindow.document.open();%0A%09%09%09newWindow.document.write('<img src=%22./Graphics/53_1443_tbl_11.jpg%22>');%0A%09%09%09newWindow.document.close();%0A%09%09)
;%0A%09%09%09newWindow.document.open();%0A%09%09%09newWindow.document.write('<img src=%22./Graphics/53_1443_tbl_12.jpg%22>');%0A%09%09%09newWindow.document.close();%0A%09%09)
;%0A%09%09%09newWindow.document.open();%0A%09%09%09newWindow.document.write('<img src=%22./Graphics/53_1443_tbl_13.jpg%22>');%0A%09%09%09newWindow.document.close();%0A%09%09)
;%0A%09%09%09newWindow.document.open();%0A%09%09%09newWindow.document.write('<img src=%22./Graphics/53_1443_tbl_14.jpg%22>');%0A%09%09%09newWindow.document.close();%0A%09%09)
;%0A%09%09%09newWindow.document.open();%0A%09%09%09newWindow.document.write('<img src=%22./Graphics/53_1443_tbl_15.jpg%22>');%0A%09%09%09newWindow.document.close();%0A%09%09)

