Regular Article
Analysis of Combustion Rate of Various Carbon Materials for Iron Ore Sintering Process
2013 Volume 53 Issue 9 Pages 1580-1587
Details
2013 Volume 53 Issue 9 Pages 1580-1587
The aim of this study was to relate the combustion rate of solid fuel for iron ore sintering process to its physical and chemical properties. In this study, we used 23 carbon materials including cokes, anthracites, charcoals, and so on. The physical and chemical properties of the carbon materials such as proximate and ultimate analysis, specific surface area, particle density, and porosity were evaluated. The combustion rates of the carbon materials were measured using thermobalance and fixed-bed combustion reactor. In the low temperature region, the combustion rates depended on the types of the carbon materials. This would be because the carbon structure and the volatile matter content affected the combustion rates significantly. In the high temperature region, on the other hand, the combustion rates were almost the same regardless of the types of the carbon materials.
In general, cokes and anthracites are used as a solid fuel in the iron ore sintering process. However, the solid fuel for the iron ore sintering process must be reconsidered due to the sudden rise of the coke price, the unstable supply of the anthracites, and the global warming issue by CO2 emission. From this point of view, biomass is becoming an attractive alternative source to the traditional cokes and anthracites because the biomass is a carbon neutral and available in large amounts.1,2,3,4) At present, however, we don’t have any knowledge on the carbon material suitable for the alternative solid fuel. One of the best methods for the simulation of iron ore sintering process is a pot test, but it is inappropriate to the fundamental analysis of the combustion characteristics of the carbon materials. We can obtain the guideline for selecting the carbon material by knowing the combustion characteristics of the carbon material such as the combustion rate, the calorific value, the ignition temperature and so on. Among them, we paid attention to the combustion rate of the carbon material in this study. It is generally known that the combustion rate determining steps were divided into three zones by the temperature region.5,6,7) In the low temperature region (Zone I), the reaction between carbon and oxygen on the surface of carbon material is controlled by chemical kinetics. In the middle temperature region (Zone II), the combustion rate is influenced by the pore diffusion as well as the chemical kinetics. And in the high temperature region (Zone III), the reaction is controlled by the transportation of the oxygen molecules through the external gas film around the solid particle.
Kucukbayrak et al. examined the relationship between the combustion reactivities of 25 lignite samples and their physical and chemical properties.8) They concluded that an increase in the volatile matter content caused a decrease in the activation energy, the activation energy increased with increasing the total carbon or fixed carbon content, and the pore structure of the raw lignite affected the activation energy although the pore diameter and porosity of the lignite samples were progressively modified by continued combustion. They also studied that the effect of mineral matter on the combustion of lignite chars and concluded that the mineral species exert a strong catalytic effect on the combustion reactivity of the char samples.9) Ma et al. reported that the char structure, including pore size distribution and porosity, played a key role in determining particle burnout times because the char conversion rate depended upon the accessibility of the internal surfaces under Zone II combustion condition.10) Although it is considered that the combustion rate of the carbon material relates closely to its physical and chemical properties (the proximate and ultimate analyses, the porosity, the specific surface area, the density, and so on), the relationship has not been examined sufficiently. In this study, we aimed to clarify the relationship between the combustion rates of the carbon materials and their physical and chemical properties.
We used 23 carbon materials shown in Table 1, which were provided from Sumitomo Metal Industries, Ltd. These carbon materials were sieved between 150 and 250 μm, stored in a desiccator, and dried at 110°C for 1 h prior to use. Hereafter, these samples are designated as raw carbon materials. Further, the carbon materials with large amounts of volatile matter were heated at 925°C for 7 min to remove the volatile matter (Table 2). Hereafter, these carbon materials are designated as devolatilized carbon materials.
| Case | Sample | Proximate analysis | Ultimate analysis | H/C | ||||||
|---|---|---|---|---|---|---|---|---|---|---|
| Ash | V.M. | F.C. | C | H | N | S | Odiff | |||
| wt%, dry | wt%, d.a.f. | |||||||||
| 1 | Coke 1 | 11.6 | 1.8 | 86.6 | 93.8 | <0.1 | 2.2 | 0.59 | 3.4 | 0.01 |
| 2 | Coke 2 | 11.3 | 1.1 | 87.6 | 93.0 | <0.1 | 2.0 | 0.60 | 4.4 | 0.01 |
| 3 | Coke 3 | 11.6 | 1.0 | 87.4 | 91.0 | 0.1 | 1.8 | 0.61 | 6.5 | 0.01 |
| 5 | Coke 5 | 11.2 | 0.8 | 88.0 | 95.3 | <0.1 | 1.7 | 0.66 | 2.3 | 0.01 |
| 6 | Fine coke powder 1 | 9.4 | 1.0 | 89.6 | 90.4 | <0.1 | 1.3 | 0.62 | 7.7 | 0.01 |
| 7 | Fine coke powder 2 | 10.3 | 1.4 | 88.3 | 93.7 | 0.1 | 1.6 | 0.68 | 3.9 | 0.01 |
| 8 | Fine coke powder 3 | 10.5 | 4.1 | 85.4 | 90.9 | 0.4 | 1.5 | 0.53 | 6.7 | 0.05 |
| 9 | Anthracite 1 | 10.5 | 6.0 | 83.5 | 92.6 | 3.7 | 1.9 | 0.41 | 1.4 | 0.48 |
| 10 | Anthracite 2 | 6.5 | 6.5 | 87.0 | 89.8 | 3.5 | 1.8 | 0.49 | 4.4 | 0.47 |
| 11 | Anthracite 3 | 8.5 | 11.2 | 80.3 | 81.9 | 4.3 | 1.6 | 0.44 | 11.8 | 0.63 |
| 12 | Graphite 1 | 16.2 | 3.5 | 80.3 | 97.1 | 0.2 | 0.7 | 0.07 | 1.9 | 0.02 |
| 13 | Graphite 2 | 0.3 | 1.0 | 98.7 | 98.5 | <0.1 | 0.7 | <0.01 | 0.8 | 0.01 |
| 14 | Charcoal 1 | 2.0 | 34.6 | 63.4 | 74.0 | 4.7 | 0.6 | 0.06 | 20.6 | 0.76 |
| 15 | Charcoal 2 | 1.6 | 32.4 | 66.0 | 66.4 | 3.7 | 0.7 | <0.01 | 29.2 | 0.67 |
| 16 | Caking coal | 5.5 | 24.8 | 69.7 | 71.6 | 4.3 | 1.9 | 0.39 | 21.8 | 0.72 |
| 17 | Sligtly caking coal | 6.4 | 31.1 | 62.5 | 79.3 | 4.5 | 2.1 | 0.46 | 13.6 | 0.68 |
| 18 | Subbituminous coal | 1.1 | 46.6 | 52.3 | 72.4 | 4.9 | 1.3 | 0.12 | 21.3 | 0.81 |
| 19 | Pitch 1 | 1.1 | 1.1 | 97.8 | 95.8 | <0.1 | 2.3 | 0.41 | 1.5 | 0.01 |
| 20 | Pitch 2 | 0.2 | 36.3 | 63.5 | 72.3 | 5.0 | 1.5 | 5.77 | 15.4 | 0.83 |
| 26 | Charcoal 3 | 3.6 | 4.0 | 92.4 | 97.7 | 0.7 | 0.7 | 0.09 | 0.8 | 0.09 |
| 27 | Charcoal 4 | 3.1 | 5.2 | 91.7 | 95.3 | 1.2 | 0.6 | 0.04 | 2.9 | 0.15 |
| 28 | Biomass char 1 | 8.7 | 3.1 | 88.1 | 95.4 | 0.7 | 0.8 | 0.09 | 3.0 | 0.09 |
| 29 | Biomass char 2 | 6.1 | 25.1 | 68.8 | 78.8 | 2.5 | 1.2 | 0.03 | 17.5 | 0.38 |
| Case | Sample | Proximate analysis | Ultimate analysis | H/C | ||||||
|---|---|---|---|---|---|---|---|---|---|---|
| Ash | V.M. | F.C. | C | H | N | S | Odiff | |||
| wt%, dry | wt%, d.a.f. | |||||||||
| 14 | Charcoal 1 | 3.1 | 1.8 | 95.1 | 95.2 | 0.4 | 0.6 | 0.07 | 3.7 | 0.05 |
| 15 | Charcoal 2 | 2.4 | 1.6 | 96.0 | 98.3 | 0.4 | 0.5 | 0.06 | 0.7 | 0.05 |
| 16 | Caking coal | 7.3 | 1.5 | 91.2 | 94.7 | 0.6 | 2.3 | 0.39 | 2.0 | 0.08 |
| 17 | Sligtly caking coal | 9.3 | 1.1 | 89.6 | 94.9 | 0.6 | 2.4 | 0.31 | 1.8 | 0.08 |
| 18 | Subbituminous coal | 2.1 | 2.0 | 95.9 | 93.9 | 0.6 | 1.2 | 0.10 | 4.2 | 0.08 |
| 26 | Charcoal 3 | 3.8 | 1.8 | 94.4 | 96.9 | 0.3 | 0.8 | 0.07 | 1.9 | 0.04 |
| 27 | Charcoal 4 | 3.3 | 2.1 | 94.6 | 93.1 | 0.4 | 0.8 | 0.04 | 5.7 | 0.05 |
| 28 | Biomass char 1 | 9.0 | 1.9 | 89.1 | 92.9 | 0.4 | 0.7 | 0.02 | 6.0 | 0.05 |
| 29 | Biomass char 2 | 8.1 | 2.5 | 89.4 | 93.8 | 0.6 | 0.8 | 0.02 | 4.8 | 0.08 |
The proximate analysis of the raw and devolatilized carbon materials was performed on the basis of JIS M 8812. The ash content (wt%) was calculated from the amount of residue when 1 g of the carbon material was calcined at 815°C for 1 h in the air. The volatile matter content (wt%) was derived from the ratio of the decreased amount of weight after heating at 925°C for 7 min to the unheated sample weight (1 g). The fixed carbon content (wt%) was calculated by subtracting the ash content (wt%) and volatile matter content (wt%) from 100 wt%. These analytical values in Tables 1 and 2 are shown on the dry basis (dry).
Carbon, hydrogen, nitrogen, and sulfur contents (wt%) in the raw and devolatilized carbon materials were measured using a Yanaco HCN corder MT-700 HCN instrument and a Horiba Carbon/Sulfur Analyzer EMIA-220V instrument. These analytical values in Tables 1 and 2 are shown on the dry ash free basis (d.a.f.).
2.3. Characterization of Carbon MaterialsTrue density ( ρt [g/cm3]) and particle density ( ρp [g/cm3]) were defined as the densities of the carbon materials with the particle diameter under 40 μm and 150–250 μm, respectively. The sample dried at 150°C for 1 h (M [g]) was placed in a pycnometer with deionized water. The pycnometer was degassed by an aspirator until the deionized water penetrated into the pore of the carbon materials sufficiently. Then, the pycnometer filled with deionized water was weighed (N [g]). The true density and particle density of the carbon material were calculated using the weight of the pycnometer filled with only deionized water (P [g]),
| (1) |
Nitrogen adsorption measurements were performed at 77 K on a Quantachrome NOVA 1200/S instrument. The BET specific surface area (S [m2/g]) was calculated using adsorption branch in the relative pressure ranging from 0.1 to 0.3. The apparent particle density (ρa [g/cm3]) was calculated using the particle density described above and the open pore volume (V [cm3/g]) derived from the BJH analysis of the nitrogen adsorption isotherm,
| (2) |
The porosity (ε) was calculated from the following equation using the true density and the apparent particle density,
| (3) |
The combustion rates of the raw and devolatilized carbon materials were measured using a Bruker TG-DTA 2000 SA instrument. The carbon materials (20 mg) were heated from room temperature to 1000°C at the heating rate of 10°C/min under air flow (200 mL/min). The analytical method reported previously11,12,13,14) was applied to the determination of the combustion rate. As an example of analysis, the thermogravimetric curve of Coke 3 is shown in Fig. 1(a), where X is the weight conversion on the d.a.f. basis. The white circles in this figure indicate the data points at X = 0.05, 0.1, 0.15, and 0.2. The combustion rate of the carbon materials at X (RX [1/s]) was calculated by substituting the differential value shown in Fig. 1(b) to the following equation,
| (4) |
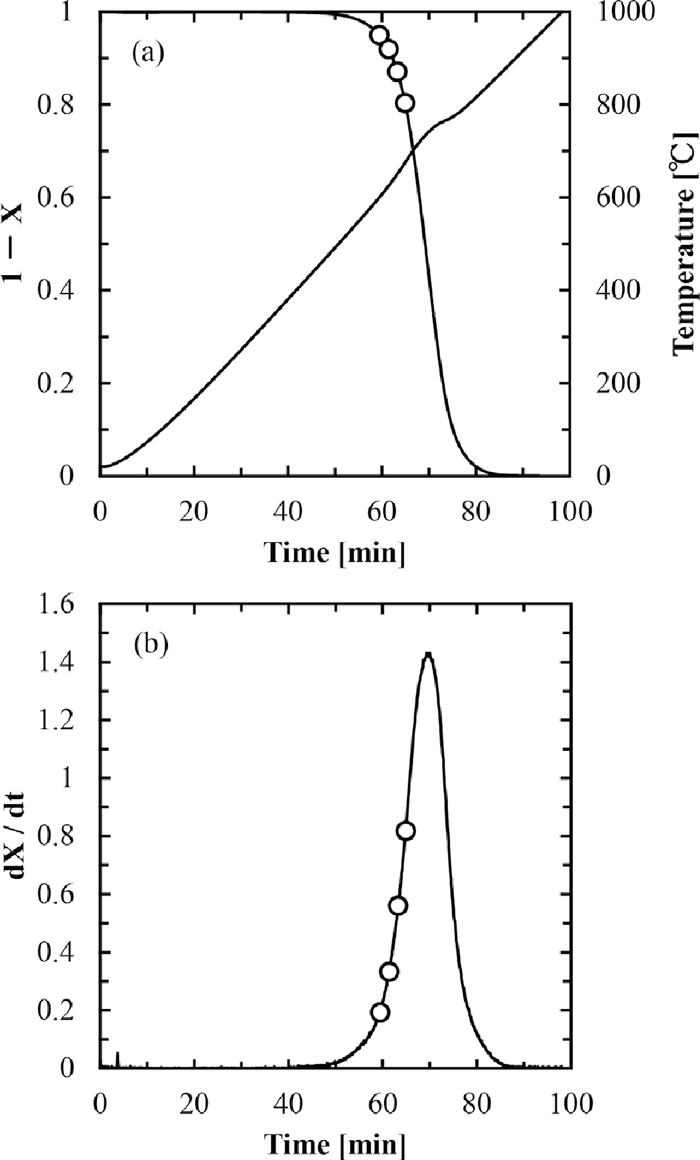
(a) Thermogravimetric curve of Coke 3. (b) Differential curve of thermogravimetry of Coke 3.
The combustion rates in Zone II and Zone III were measured using a fixed-bed combustion equipment shown in Fig. 2. In this equipment, two electric furnaces were arranged side by side and the temperature could be controlled independently. The furnace at the gas inlet side was placed to pre-heat the inlet gas and the other was placed to combust the carbon materials. The mixture of the carbon material (15 mg) and quartz sand (about 2 g) was used as the sample for the combustion experiment. The mixed sample was set in a quartz glass tube, and then the nitrogen was introduced into the reactor. The sample was heated to the desired temperature between 450 and 950°C and kept at the temperature. After 5 min, the flow gas was switched to the air flow (3.0 L-ntp/min). The amounts of CO, CO2, O2 in the produced gas were analyzed using Shimadzu portable gas analyzer CGT-7000. After the CO and CO2 finished being evolved, the sample was cooled to the room temperature. As an example of analysis, CO and CO2 evolution profiles during combustion of Coke 3 at 700°C are shown in Fig. 3(a). Since the sum of the CO and CO2 evolution rates provides the carbon combustion rate, the integration of the carbon combustion rate gives the change in carbon conversion with combustion time as shown in Fig. 3(b). From these figures, the carbon combustion rate at X = 0.15 (white circle) was obtained similar to the case of Zone I.
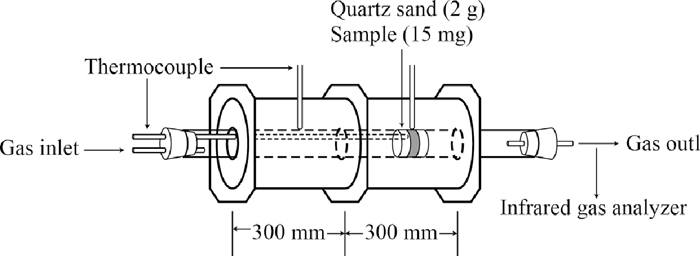
Schematic illustration of fixed-bed combustion equipment.
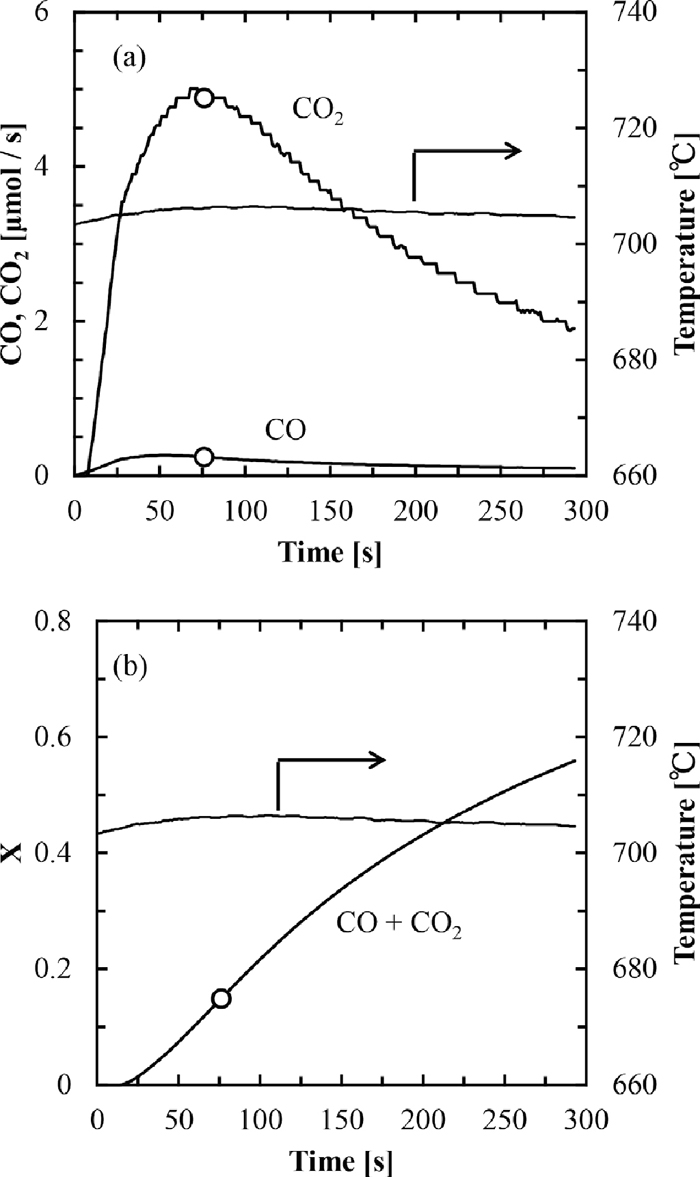
(a) CO and CO2 evolution profiles during combustion of Coke 3 at 700°C. (b) Carbon conversion for combustion of Coke 3 at 700°C.
In this study, the analysis of combustion rate was carried out according to the equations and method proposed by Lin et al.5) The combustion rate per unit volume of the carbon material in Zone I (RI [mol/(m3·s)]) is given by
| (5) |
The combustion rate per unit external surface area of the carbon material in Zone II (RII [mol/(m2·s)]) is given by
| (6) |
| (7) |
| (8) |
In the Zone III, the combustion rate is limited by the mass transfer rate of oxygen through the external gas film around a particle. The combustion rate per unit external surface area of the carbon material (RIII [mol/(m2·s)]) is given by
| (9) |
| (10) |
The equation of overall combustion rate (RI–II–III [mol/(m2·s)]) is obtained by the combination of RII and RIII as shown in the following equation,
| (11) |
The proximate and ultimate analyses of raw carbon materials were summarized in Table 1. A small amount of volatile matter (< 4.1 wt%) and a large amount of carbon (> 90.4 wt%) were characteristic of the cokes and fine coke powders. Moreover, the ash contents in these carbon materials were relatively high (> 9.4 wt%). The analytical values of the anthracites were similar to those of the cokes and fine coke powders, except that the anthracites had a slightly larger amount of volatile matter. In the case of other carbon materials, the ash contents extended over a wide range from 0.2 wt% (Pitch 2) to 16.2 wt% (Graphite 1). It is important to note the difference in volatile matter contents among the carbon materials, that is, there are some carbon materials with large amounts of volatile matter (> 24.8 wt%) such as Charcoal 1, Charcoal 2, Caking coal, Slightly caking coal, Subbituminous coal, Pitch 2, and Biomass char 2. On the contrary, the carbon contents in these carbon materials were very low (< 66.4 wt%). The H/C atomic ratios of the cokes and fine coke powders shown in Table 1 were remarkably low (< 0.05) compared with those of the carbon materials with large amounts of volatile matter such as Subbituminous coal (0.81) and Pitch 2 (0.83). This indicates that the cokes and fine coke powders are relatively rich in aromatic carbons.
The proximate and ultimate analyses of the devolatilized carbon materials are summarized in Table 2. The analytical values of the devolatilized carbon materials were close to those of the cokes and fine coke powders. The amount of volatile matter in the devolatilized carbon materials decreased significantly to 1.1–2.5 wt%, while the carbon contents increased to 92.9–98.3 wt%. Further, the removal of the volatile matter from the carbon materials caused the decrease in the H/C atomic ratios to 0.04–0.08. In this way, even in the case of the carbon materials with large amounts of volatile matter, the proximate and ultimate analyses resembled to the other carbon materials with small amounts of volatile matter by removing the volatile matter.
The specific surface areas of the raw and devolatilized carbon materials are given in Table 3. The specific surface areas of cokes and anthracites were 20–50 m2/g, which were significantly smaller those of Charcoal 4 (210 m2/g) and Biomass char 1 (160 m2/g). For the carbon materials with large amounts of volatile matter, the specific surface areas of carbon materials increased by removing the volatile matter compared to those of the corresponding raw carbon materials. This is considered that new pores are formed in the carbon materials during devolatilization.
| Case | Sample | Rawa) | Devolatilizedb) |
|---|---|---|---|
| 3 | Coke 3 | 20 | – |
| 5 | Coke 5 | 40 | – |
| 6 | Fine coke powder 1 | 50 | – |
| 7 | Fine coke powder 2 | 20 | – |
| 8 | Fine coke powder 3 | 20 | – |
| 9 | Anthracite 1 | 30 | – |
| 11 | Anthracite 3 | 20 | – |
| 12 | Graphite 1 | 10 | – |
| 13 | Graphite 2 | 30 | – |
| 14 | Charcoal 1 | 60 | 100 |
| 15 | Charcoal 2 | 50 | 160 |
| 16 | Caking coal | – | 50 |
| 17 | Slightly caking coal | – | 30 |
| 18 | Subbituminous coal | 30 | 110 |
| 19 | Pitch 1 | <5 | – |
| 26 | Charcoal 3 | 40 | 200 |
| 27 | Charcoal 4 | 210 | 240 |
| 28 | Biomass char 1 | 160 | 240 |
| 29 | Biomass char 2 | – | 230 |
Table 4 shows the particle densities of the raw carbon materials. The particle density was widely distributed from 1.55 g/cm3 for Anthracite 1 to 2.24 g/cm3 for Graphite 1. In addition, as for Coke 3 and Charcoal 3, the porosity was calculated by measuring the true density and the pore volume. In the case of Coke 3, the porosity was 0.42 because the true density and the pore volume were 2.00 g/cm3 and 0.34 cm3/g, respectively. On the other hand, the porosity of Charcoal 3 was calculated at 0.55 from the values of true density (1.83 g/cm3) and pore volume (0.67 cm3/g). Kulaots et al. reported that the porosity of the carbon materials increased with increasing the burn-off time.15,16) Thus, the porosities of Coke 3 and Charcoal 3 after combustion at X = 0.15 were evaluated because we measured the initial combustion rate (X = 0.15) of the carbon materials described below. As a result, the porosities of Coke 3 and Charcoal 3 increased to 0.46 and 0.73, respectively.
| Case | Sample | ρp |
|---|---|---|
| 3 | Coke 3 | 1.92 |
| 9 | Anthracite 1 | 1.55 |
| 12 | Graphite 1 | 2.24 |
| 13 | Graphite 2 | 2.16 |
| 19 | Pitch 1 | 1.99 |
| 26 | Charcoal 3 | 1.82 |
| 27 | Charcoal 4 | 1.69 |
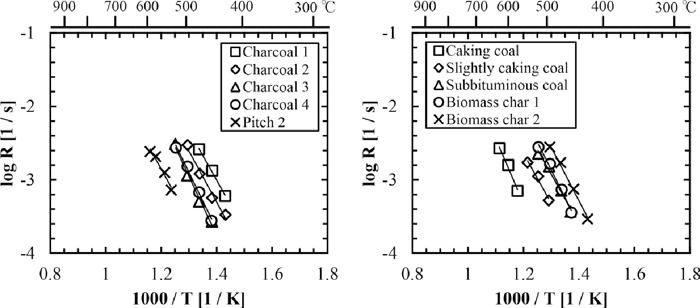
Figure 4 shows the Arrhenius plots for the combustion of the raw carbon materials derived from the thermogravimetry. It is found that the combustion temperature of cokes and fine coke powders at X = 0.05–0.20 was between 600 and 700°C, which was higher than that of anthracites at X = 0.05–0.20 by about 100°C. By fitting the Eq. (5) to the results in Fig. 4, the activation energy and the frequency factor can be obtained. Table 5 summarizes the activation energies for combustion of the raw carbon materials. The activation energies for cokes and fine coke powders were 120–160 kJ/mol, which were smaller than those for anthracites (160–190 kJ/mol). On the other hand, the activation energies for the combustion of graphites were 220–230 kJ/mol, indicating that the graphites were hard to combust. For the carbon materials with large amounts of volatile matter, the activation energies distributed over the wide range between 70 and 160 kJ/mol. Figure 5 shows the Arrhenius plots for the combustion of the devolatilized carbon materials. The combustion temperatures of the devolatilized carbon materials at X = 0.05 – 0.2 shifted to the higher side by 50–200°C compared to those for the corresponding raw carbon materials, and particularly Caking coal and Slightly caking coal burned in the same temperature region as the case of cokes and anthracites. However, the combustion temperature of the carbon materials prepared from biomass such as charcoals and biomass chars were low compared to those for the cokes, although the volatile matter was removed from the carbon materials. The activation energies for the combustion of the devolatilized carbon materials were 140–180 kJ/mol, which were almost the same as those of cokes. Above results indicate that the volatile matter promotes the combustion of the fixed carbon.
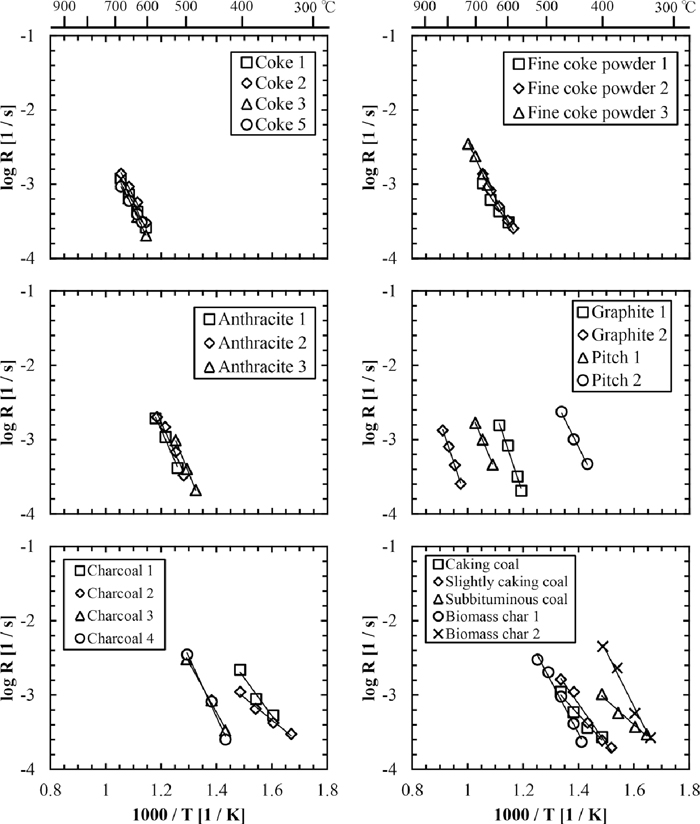
Arrhenius plots for combustion of raw carbon materials.
| Case | Sample | Raw | Devolatilized | ||
|---|---|---|---|---|---|
| E [kJ/mol] | log A | E [kJ/mol] | log A | ||
| 1 | Coke 1 | 140 | 9.7 | – | – |
| 2 | Coke 2 | 150 | 10.1 | – | – |
| 3 | Coke 3 | 150 | 10.1 | – | – |
| 5 | Coke 5 | 130 | 8.9 | – | – |
| 6 | Fine coke powder 1 | 120 | 8.1 | – | – |
| 7 | Fine coke powder 2 | 130 | 8.7 | – | – |
| 8 | Fine coke powder 3 | 160 | 10.7 | – | – |
| 9 | Anthracite 1 | 170 | 12.7 | – | – |
| 10 | Anthracite 2 | 160 | 12.2 | – | – |
| 11 | Anthracite 3 | 190 | 14.0 | – | – |
| 12 | Graphite 1 | 220 | 14.8 | – | – |
| 13 | Graphite 2 | 230 | 12.7 | – | – |
| 14 | Charcoal 1 | 110 | 10.1 | 140 | 11.7 |
| 15 | Charcoal 2 | 70 | 6.8 | 140 | 11.4 |
| 16 | Caking coal | 90 | 7.5 | 180 | 12.4 |
| 17 | Slightly caking coal | 110 | 9.2 | 140 | 10.7 |
| 18 | Subbituminous coal | 80 | 7.5 | 140 | 10.9 |
| 19 | Pitch 1 | 190 | 12.2 | – | – |
| 20 | Pitch 2 | 150 | 12.7 | 140 | 10.4 |
| 26 | Charcoal 3 | 140 | 11.5 | 160 | 12.7 |
| 27 | Charcoal 4 | 160 | 13.2 | 160 | 12.3 |
| 28 | Biomass char 1 | 140 | 11.5 | 150 | 12.1 |
| 29 | Biomass char 2 | 150 | 13.8 | 150 | 12.1 |
Arrhenius plots for combustion of devolatilized carbon materials.
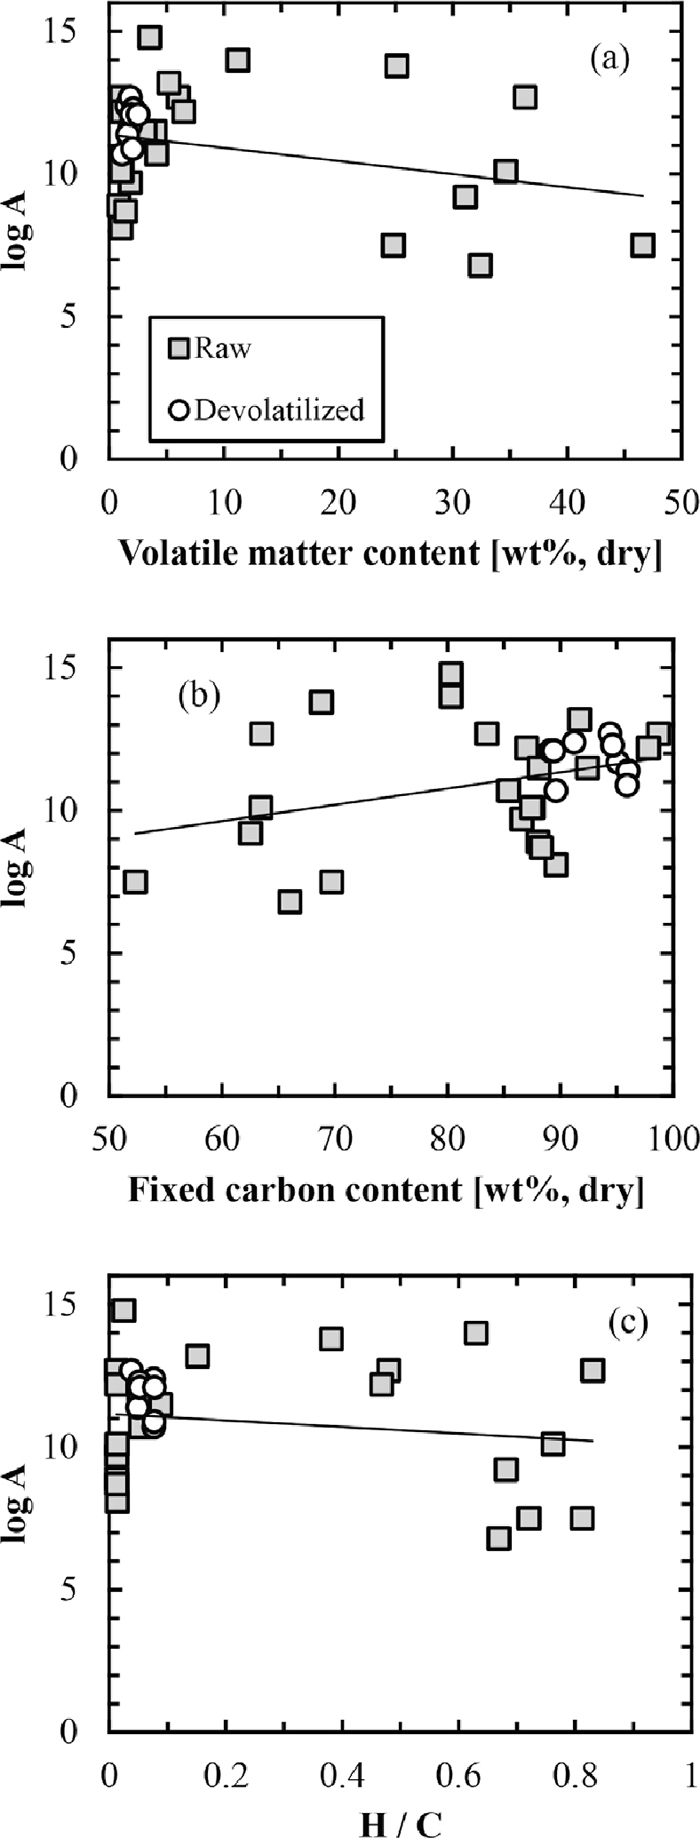
In order to investigate how the proximate and ultimate analyses of the carbon materials influence its activation energy for the combustion, the variations of activation energy with the volatile matter content, the fixed carbon content, and the H/C atomic ratio are shown in Fig. 6. It was observed in Fig. 6(a) that an increase in the volatile matter content of the carbon materials caused, as a general tendency, a decrease in the activation energy. From Fig. 6(b), it was found that activation energy increased with increasing the fixed carbon content. Also, it was seen in Fig. 6(c) that the activation energy had a tendency of decreasing with increasing the H/C atomic ratio, indicating that the activation energies decreased with increasing the ratio of aliphatic carbon to total carbon. Similarly, Fig. 7 shows the relationship between the frequency factor and the proximate and ultimate analyses. As a general tendency, the increases in the volatile matter content and the H/C atomic ratio and the decrease in the fixed carbon content resulted in the decrease in the frequency factor. From these results, it was suggested that we could expect the activation energy and frequency factor to some degree by measuring the proximate and ultimate analyses.

Relationship between the activation energy and (a) volatile matter content, (b) fixed carbon content, and (c) H/C atomic ratio.
Relationship between the frequency factor and (a) volatile matter content, (b) fixed carbon content, and (c) H/C atomic ratio.
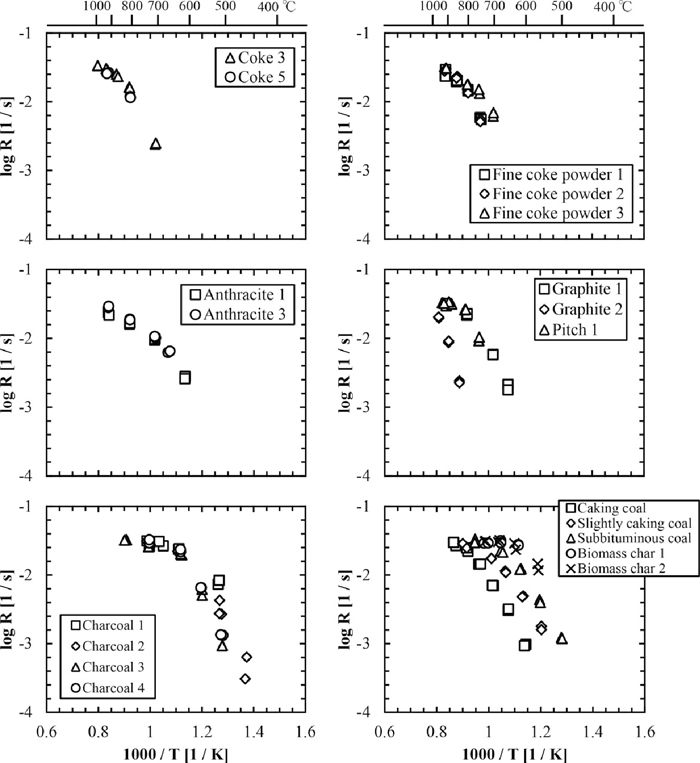
Figure 8 shows the Arrhenius plots for the combustion obtained by using the fixed-bed reactor. It was observed that the combustion rates depended on the types of the carbon materials below about 850°C. Above this temperature, on the other hand, the combustion rates became almost the same regardless of the carbon materials and the activation energies calculated from the slopes were 10–50 kJ/mol in all the carbon samples except for Graphite 2 (Table 6).
Arrhenius plots for combustion of carbon materials obtained using the fixed-bed reactor.
| Case | Sample | E [kJ/mol] |
|---|---|---|
| 3 | Coke 3 | 40 |
| 5 | Coke 5 | 50 |
| 6 | Fine coke powder 1 | 50 |
| 7 | Fine coke powder 2 | 40 |
| 8 | Fine coke powder 3 | 50 |
| 9 | Anthracite 1 | 40 |
| 11 | Anthracite 3 | 40 |
| 12 | Graphite 1 | 30 |
| 13 | Graphite 2 | 220 |
| 14 | Charcoal 1 | 10 |
| 15 | Charcoal 2 | 20 |
| 16 | Caking coal | 30 |
| 17 | Slightly caking coal | 40 |
| 18 | Subbituminous coal | 40 |
| 19 | Pitch 1 | 20 |
| 26 | Charcoal 3 | 20 |
| 27 | Charcoal 4 | 20 |
| 28 | Biomass char 1 | 10 |
| 29 | Biomass char 2 | 10 |
There is a following relationship between the experimental value (RX=0.15 [1/s]), and RI–II–III [mol/(m2·s)],
| (12) |
| (9') |

Arrhenius plots for combustion of carbon materials calculated from the thermogravimetry and fixed-bed reator.
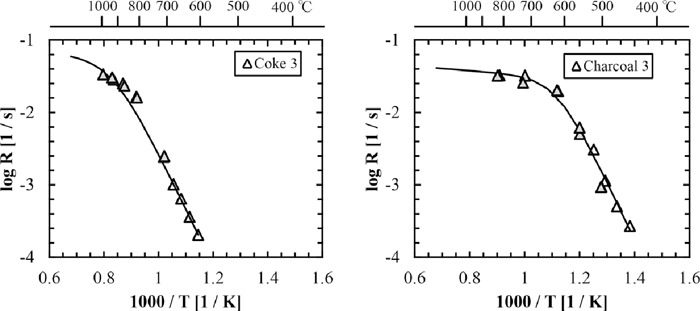
Figure 10 shows the results of fitting in the cases of Coke 3 and Charcoal 3. Finally, we can express the overall combustion rate as a function of temperature (T).
Comparison of calculated results with experimental data.
In the case of Coke 3,
| (13) |
| (14) |
In the case of Charcoal 3,
| (15) |
| (16) |
In the Zones I and II, the combustion rate (RII) can be calculated if the activation energy, the frequency factor, and the porosity are obtained. The porosity can only be measured by the method performed in this study, the porosimetry, or other methods. As for the activation energy and the frequency factor, we can obtain by measuring the thermogravimetry directly or estimate using the relationship between the combustion parameters (E and A) and the proximate and ultimate analyses shown in Figs. 6 and 7. In the Zone III, the fitting parameter (c) can be expected easily, since the combustion rate hardly differs among the types of the carbon materials. From above results, it was found that we could estimate the overall combustion rate by obtaining the values of the activation energy, the frequency factor, and the porosity.
The proximate and ultimate analyses, the specific surface areas, the particle densities, and the porosities were measured as the physical and chemical properties of the carbon materials used in this study. Cokes and fine coke powders had a small amount of volatile matter (< 4.1 wt%) and a large amount of carbon (> 90.4 wt%) and ash (> 9.4 wt%). On the contrary, the volatile matter contents in Charcoal 1, Charcoal 2, Caking coal, Slightly caking coal, Subbituminous coal, Pitch 2, and Biomass char 2 were larger than 24.8 wt%. The proximate and ultimate analyses of the devolatilized carbon materials from the biomass were almost the same as those of the cokes and fine coke powders. The specific surface area and the porosity were different among the types of the carbon materials. The combustion rates were analyzed by using the thermobalance and the fixed bed combustion instrument. In the chemical reaction rate determining step (Zone I), it was seen that the combustion temperature of the cokes and fine cokes powders at the weight conversion X = 0.05–0.20 was between 600 and 700°C, which was higher than that of the carbon materials with large amounts of volatile matter. The activation energies for the combustion differed greatly depending on the types of the carbon materials, from 150–190 kJ/mol for the cokes and fine coke powders to 70–110 kJ/mol for the carbon materials with large amounts of volatile matter. For most of the devolatilized carbon materials, the combustion temperature shifted to the higher temperature side by 50–200°C. In the internal diffusion (Zone II) and external diffusion (Zone III) rate determining steps, the differences in the combustion rates became small among the types of the carbon materials and the apparent activation energies for the combustion of the carbon materials became small (10–50 kJ/mol). For obtaining the overall combustion rate, it was found that we need the data of the activation energy, the frequency factor, and the porosity.