Abstract
Most Czerny-Turner based LIBS systems are used widely. In the present work, an instrumental setup based on Paschen-Runge is introduced, and analytical parameters are optimized for LIBS. With optimum parameters, analytical performance measures, such as precision, accuracy and detection limit, are compared for LIBS and Spark-OES. The results show that the analytical accuracy obtained by LIBS is similar to that obtained with Spark-OES, while the precision and detection limit are notably close to those of Spark-OES. Thus, LIBS can be used satisfactorily for process analysis in the metallurgy industry.
1. Introduction
Laser-induced breakdown spectroscopy (LIBS) is a fast, simple apparatus that can be used to analyze molten alloy and non-conducting materials remotely.1,2,3,4) In addition, while the resonance states of elements such as C, N, O and S lie in the VUV (vacuum ultraviolet) spectral range, other elements in steel samples, such as Mn, Cr and Ni, can be analyzed in an atmospheric environment, However, in general, spark-optical emission spectrometry operated in an argon environment, which is a cause of great concern in metallurgical analysis.5,6,7) At the first international LIBS conference in 2000, Noll8) introduced LIBS instrumentation and provided a detailed systematic introduction to furnace gas analysis, molten steel online analysis, scanning microanalysis, slag analysis and identification testing of high-alloy pipe fittings via LIBS in the metallurgical industry. Hemmerlin9) compared the merit of C, N, P, S obtained by LIBS and Spark-OES. The results suggest that LIBS is a viable technique for quantitative trace determination in steel. Quantitative analysis of aluminium alloy using LIBS and Spark-OES is compared by Doucet.10) The results show that the two sources give comparable quantitative results for major, minor and trace elements. The authors believed that LIBS should be immediately developed as a steel control tool and that the instrumentation would be suitable for on-site process control. Other interesting and informative research papers on the subject of metallurgical analysis using LIBS have also been published.11,12,13,14,15,16)
Comparing with similar research about this topic, the present work investigated LIBS instrumental parameters, such as lens-to-sample distance, delay time, background gas and pressure and laser pulse energy, in detail. With optimized experimental condition, analytical performance of LIBS and Spark-OES, such as precision, accuracy and detection limits were compared.
2. Instrumental Setup
The instrumental setup consisted of, for instance, a Q-switch Nd: YAG laser, sample chamber that could be filled with argon, stepping motors that could move the sample platform along X, Y and Z axes, a Paschen-Range spectrometer (NCS Analytical Instrument, Beijing) and a pulse delay generator. The focal length of the lens (for focusing the laser beam) was 100 mm. Once the plasma was generated, a convex lens collects photons emitted from the plasma, and compound light was dispersed using a concave grating. The experimental set-up is shown in Fig. 1 below:
3. Experimental Section
3.1. Instrumental Parameters of LIBS and Spark-OES
Table 1 shows the instrumental parameters of LIBS and Spark-OES.
Table 1. Instrumental parameters for LIBS and Spark-OES.
| Instrument (laser, spectrometer) | Instrumental parameters |
|---|
| Laser | Continuum surelite III (Q Switch) |
| Wavelength | 1064 nm |
| Pulse width | 5.3 ns |
| Pulse frequency | 10 Hz |
| Pulse to pulse stability | 2.5% |
| Pulse energy | 0–910 mJ |
| Energy distribution | nearly Gaussian distribution |
| Beam waist diameter | 9.0 mm |
| Spectrometer | Beijing NCS Analytical Instruments |
| Model | LIBS-OPA100, Lab Spark 750 |
| Optical path | Paschen-Runge |
| Focal length | 750 mm |
| Grating grooves | 2400 g/mm |
| Spark discharge frequency | 500 Hz |
| Detector | Photomultiplier Tube (Hamamatsu) |
For Lab Spark 750 experiments(NCS Analytical Instrument, Beijing), the distance of electrode gap was set 3.5 mm, the argon flow rate was 9 L/min, the sample chamber was purged for 10 s, and the preburn and integration time were each 10 s. Samples were ground (using a grinding machine) for spectral analysis. The mesh number of the sandpaper particle size was 40. For low-alloy steel (sample number 11278), the mass fraction of C, Si, Mn, P, S, Cr and Ni was 0.427%, 1.13%, 0.800%, 0.021%, 0.020%, 1.07% and 0.414%, respectively. Spectroscopic standard samples (number ss401/2–ss410/2, produced by BAS) were used to determine and compare the accuracies of LIBS and Spark-OES. Standard sample (GSBH 40078-94, sample number S9255, produced by Central Iron & Steel Research Institute) was used to evaluate the precision of LIBS and EPMA.
3.2. Optimization of Experimental Parameters
3.2.1. Effects of Argon Pressure on Spectral Line Intensity
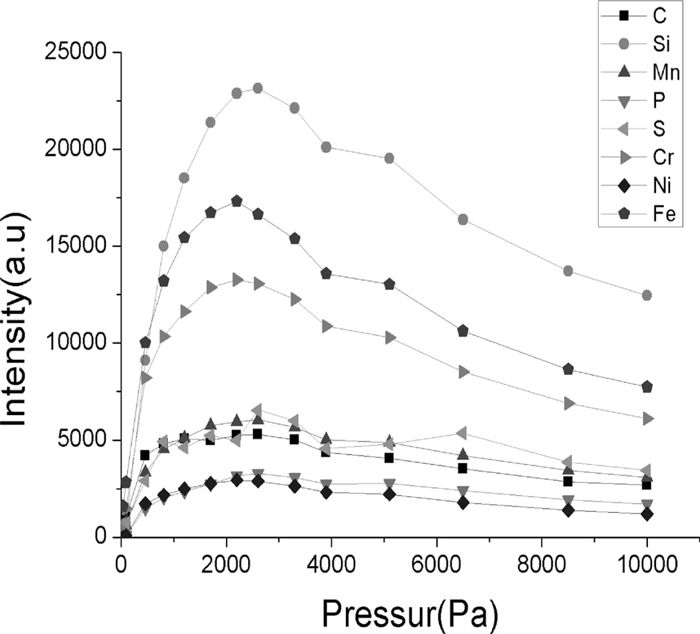
The focal plane was 4 mm behind the sample surface, the laser pulse energy was 300 mJ/Pulse, and the sample chamber is filled with argon. With increasing pressure, Fig. 2 shows the variations in spectral-line intensity of C, Si, Mn, P, S, Cr, Ni and Fe (in low-alloy steel, sample number 11278) as a result of increasing argon pressure.
As shown in Fig. 2, the spectral line intensities reached maximum values when the argon pressure reached around 2000 Pa; when the argon pressure exceeds 2000 Pa, the spectral line intensities slowly decreased. This effect of argon pressure is caused by plasma shielding,17) in which the plasma interacted with the laser, resulting in some portion of the pulse energy being absorbed by the plasma. To avoid argon breakdown and improve analytical sensitivity, the argon pressure was maintained at around 2000 Pa.
3.2.2. Influence of Spectra Line Intensity for Varying Lens-to-sample Distances
The argon pressure was maintained at around 2000 Pa in the chamber, and the lens position was set to zero when the focal plane is coincident with the sample surface. A negative value meant that the focal plane was inside the sample; conversely, a positive value meant that the focal plane was above the sample surface. The spectral line intensities of C, Si, Mn, P, S, Cr and Fe (sample number 11278) can be varied by varying lens-to-sample distances, as shown in Fig. 3:

To avoid argon breakdown, the focal plane should be kept inside sample. This improved analytical precision and sensitivity. Experimental evidence showed that, when the focal plane was coincident with the sample surface and the pulse numbers are increased, spectral line intensities changed very quickly. Consequently, this situation should be avoided. Figure 3 show that the spectral line intensity reached a maximum when the focal plane was inside the sample by approximately 4 mm. Thus, that was the preferred position because analytical sensitivity was highest at this position.
3.2.3. Variations in Spectral Line Intensities as a Function of Pulse Energy
The experiments performed for this study demonstrated that the pulse energy employed has a great influence on spectral line intensity. In this case, the focal plane was inside the sample by approximately 4 mm, and the sample chamber was filled with argon with a pressure maintained around 2000 Pa. As the pulse energy was increased, the spectral line intensities of Fe, Si, Mn, P, S, C, Cr and Ni (sample number 11278) changed accordingly, as shown in Fig. 4:

Figure 4 showed that, when the pulse energy was less than 100 mJ/Pulse, the spectral line intensity is close to the background intensity. This meant that the pulse energy should be greater than a certain threshold.18) The spectral line intensity increased as the pulse energy was increased. That was because irradiance increases with increasing pulse energy. The spectral line intensity saturated when the pulse energy was exceeding 300 mJ/Pulse. This is due to the plasma shielding effect, in which a portion of the pulse energy was absorbed by the plasma. As a result of this plasma shielding effect, fewer photons reach the sample surface, causing the spectral line intensity to increase very slowly. Thus, in consideration of the effects of plasma shielding, the pulse energy was maintained at around 300 mJ/Pulse.
3.2.4. Delay Time
Early in LIBS analyses, the pulse plasma source consists, in general, of free-free and free-bound transitions (electron-ion recombinations) that result in a strong background continuum, which decays with time more quickly than characteristic spectral lines.19) With this in mind, a delay time, meaning a delay from the initiation of laser illumination to the opening of the detector window, was used. When the sample chamber is filled with argon at a pressure of 2000 Pa, the laser pulse energy is 300 mJ/Pulse, the focal plane was 4 mm inside the sample and the integration time is 100 μs, the spectral line intensities of Fe, C, Si, Mn, P, S, Cr and Ni varied with delay time as shown in Fig. 5:

Figure 5 shows that spectra line intensities decrease with increasing delay times. That was because, during plasma evolution, the electron number density and excitation temperature in the plasma decreases, causing the spectral line intensity to decrease as well. Spectral line wavelength, delay time, and integration time were shown in Table 2 below.
Table 2. Delay time, integration time, and wavelength for specific elements.
| Elements | Wavelength (nm) | Delay time (μs) | Integration time(μs) |
|---|
| C | 193.1 | 1.5 | 100 |
| Si | 212.4 | 1 | 100 |
| Mn | 293.3 | 1 | 100 |
| P | 178.3 | 1.5 | 100 |
| S | 180.7 | 1.5 | 100 |
| Cr | 267.7 | 0.5 | 100 |
| Ni | 215.8 | 0.5 | 100 |
| Fe | 273.0 | 1.5 | 100 |
4. Comparing Analytical Performances of LIBS and Spark-OES
4.1. Comparing Precision and Accuracy for LIBS and Spark-OES
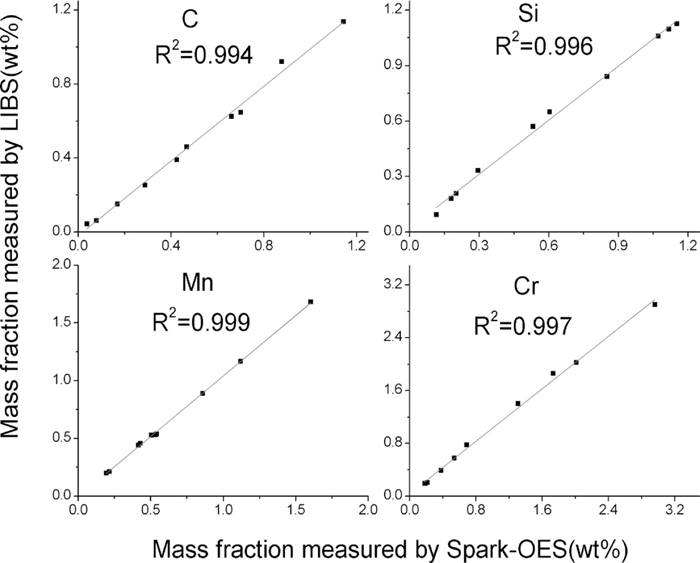
For these experiments, the focal plane was 4 mm behind sample surface, the sample chamber was filled with argon maintained at around 2000 Pa, the energy was 300 mJ/Pulse and the prepulse and measuring pulse numbers are each 20. Using those optimum parameters, LIBS-OPA100 and Lab Spark 750 calibration curves have been determined using two sets of certified reference materials for middle/low-alloy steel (sample numbers GSBH 40068-93-1–GSBH 40068-93-6 and GBW 01395–GBW 01400, produced by Central Iron and Steel Institute ). The calibration curves and associated correlation coefficients were shown in Fig. 6 below.
To compare the accuracies of LIBS and Spark-OES, C, Si, Mn and Cr (spectroscopic standard CRM number ss401/2–ss410/2, produced by BAS) have been analyzed by LIBS-OPA 100 and Lab Spark 750. The results were shown in Fig. 7 below.
Low-alloy steel (sample number 11278) has been analyzed by the LIBS-OPA 100 and Lab Spark 750 experimental setups, and the precision and accuracy were shown in Table 3 below.
Table 3. Comparison of precision and accuracy for LIBS and Spark-OES.
| Elements | Measured by Spark-OES 750
(mass%) | RSD
(Spark-OES)
(%) | Measured by LIBS
(mass%) | RSD
(LIBS)
(%) |
|---|
| C | 0.427 | 0.81 | 0.410 | 2.37 |
| Si | 1.13 | 0.93 | 1.12 | 2.18 |
| Mn | 0.800 | 0.74 | 0.802 | 2.23 |
| P | 0.021 | 3.1 | 0.017 | 5.12 |
| S | 0.020 | 5.2 | 0.024 | 9.34 |
| Cr | 1.07 | 1.05 | 1.08 | 2.13 |
| Ni | 0.414 | 0.63 | 0.421 | 1.92 |
It can be seen from Fig. 7 and Table 3 that the results obtained using LIBS agreed with those obtained using Spark-OES, However, the precision obtained using LIBS was slightly poorer than that obtained using Spark-OES. That was because, compared to Spark-OES, LIBS samples and analyzes only a small amount of material, and the precision of a given measurement is heavily dependent on the homogeneity of the sample. Likewise, that might be the predominant reason why the accuracy and precision of LIBS was slightly poorer than other conventional analytical methods, such as ICP-OES, AAS, ICP-MS, etc. Reference sample (sample number S9255, produced by Central Iron and Steel Institute) was analyzed by line scan mode using LIBS and EPMA, the result showed that relative standard deviation (RSD) of chemical content for Si, Mn, Cr, Cu was 10.5%, 20.6%, 30.2%, 35.7% using EPMA(electron beam spot is about 1 μm), respectively. While using LIBS (spot diameter of laser ablation is about 70 μm), RSD of chemical content for Si, Mn, Cr, Cu is 5.0%, 4.2%, 3.5%, 3.0%, respectively. It meant that RSD of EPMA was much higher than LIBS. In addition, compared to the Spark-OES source, the output laser energy of LIBS was less stable than that of Spark-OES(RSD of pulse to pulse stability is about 2.5%). However, LIBS precision could be improved using a normalization procedure20) and absolute analyses for particulate material.21)
4.2. Comparison of LIBS and Spark-OES Detection Limits
Calibration curves and detection limits of LIBS and Spark-OES, based on the formula
DL=
3σ
S
and obtained using a set of pure Fe samples (sample numbers BHG15-1A, BHG15-2, BHG15-3, BHG15-4A and BHG15-5 which is provided by Central Iron and Steel Institute), were shown in Table 4 below.
Table 4. Comparison of detection limits for LIBS and Spark-OES.
| C | Si | Mn | P | S | Ni | Cr |
|---|
Spark-OES
(mass%) | 0.0033 | 0.0039 | 0.0022 | 0.0012 | 0.0012 | 0.0018 | 0.0014 |
LIBS
(mass%) | 0.0045 | 0.0072 | 0.0069 | 0.0027 | 0.0024 | 0.0047 | 0.0024 |
As shown in Table 4, the detection limits obtained using LIBS were very close to those obtained using Spark-OES. LIBS detection limits were slightly poorer than Spark-OES detection limits because σ (in the formula used above) is larger for LIBS compared to Spark-OES. Nonetheless, the LIBS detection limits obtained herein meet the requirements of metallurgical process analysis.
5. Conclusions
The above analysis showed that the results obtained using LIBS agree with those obtained using Spark-OES and that LIBS detection limits were notably close to Spark-OES detection limits. The only disadvantage of LIBS is that its precision was slightly lower than that of Spark-OES. One of the reasons for this characteristic is that compared to Spark-OES, only a small amount of material is sampled and analyzed by LIBS. Another reason might be that for LIBS, the output laser-energy stability is not as good as that for Spark-OES. However, in general, the precision, detection limits and accuracy of LIBS were sufficient to meet the requirements of process analysis. In addition, unlike Spark-OES, LIBS can be used for scanning microanalyses and depth-profile analyses22) in the metallurgical industry. In the future, we plan to focus on using microanalysis to evaluate clean steel and depth-profile analysis to analyze coated materials using LIBS based on the foundation of bulk analysis.
Acknowledgments
This work was supported by a special fund for nationally important instruments (Project No 2011YQ140147). The authors would like to thank professor Z Wang (Department of Thermal Engineering, Tsinghua University) and W Q Lei (IVEA Solution Company, France) for helpful discussions.
References
- 1) J. Gruber, J. Heitz, N. Arnold, D. Bauerle, N. Ramaseder, W. Meyer, J. Hochortler and F. Koch: Appl. Spectrosc., 58 (2004), 457.
- 2) L. Peter, V. Sturm and R. Noll: Appl. Opt., 42 (2003), 6199.
- 3) J. Gruber, J. Heitz, H. Strasser, D. Bäuerle and N. Ramaseder: Spectrochim. Acta B, 56 (2001), 685.
- 4) G. Hubmer, R. Kitzberger and K. Morwald: Anal Bioanal. Chem., 385 (2006), 219.
- 5) J. D. Winefordner, I. B. Gornushkin, T. Correll, E. Gibb, B. W. Smith and N. Omenetto: J. Anal. At. Spectrosc., 19 (2004), 1061.
- 6) J. M. Vadillo and J. J. Laserna: Spectrochim. Acta B, 59 (2004), 147.
- 7) L. J. Radziemski: Spectrochim. Acta B, 57 (2002), 1109.
- 8) R. Noll, H. Bette, A. Brysch, M. Kraushaar, I. Mönch, L. Peter and V. Sturm: Spectrochim. Acta B, 56 (2001), 637.
- 9) M. Hemmerlin, R. Meilland, H. Falk, P. Wintjens and L. Paulard: Spectrochim. Acta B, 56 (2001), 661.
- 10) F. R. Doucet, T. F. Belliveau, J. L. Fortier and J. Hubert: J. Anal. At. Spectrosc., 19 (2004), 449.
- 11) F. B. Gonzaga and C. Pasquini: Spectrochim. Acta B, 69 (2012), 20.
- 12) V. Sturm, J. Vrenegor, R. Noll and M. Hemmerlin: J. Anal. At. Spectrosc., 19 (2004), 451.
- 13) C. L. Moreno, S. Palanco and J. J. Laserna: J. Anal. At. Spectrosc., 20 (2005), 1275.
- 14) V. Sturm, H. U. Schmitz, T. Reuter, R. Fleige and R. Noll: Spectrochim. Acta B, 63 (2008), 1167.
- 15) H.-M. Kuss, H. Mittelstaedt and G. Mueller: J. Anal. At. Spectrosc., 20 (2005), 730.
- 16) F. Boué-Bigne: Spectrochim. Acta B, 63 (2008), 1122.
- 17) Y. Iida: Spectrochim. Acta B, 45 (1990), 1353.
- 18) L. M. Cabalín and J. J. Laserna: Spectrochim. Acta B, 53 (1998), 723.
- 19) R. Wisbrun, I. Schechter, R. Niessner, H. Schroeder and K. L. Kompa: Anal. Chem., 66 (1994), 2964.
- 20) U. Panne, C. Haisch, M. Clara and R. Niessner: Spectrochim. Acta B, 53 (1998), 1957.
- 21) L. Xu, V. Bulatov, V. V. Gridin and I. Schechter: Anal. Chem., 69 (1997), 2103.
- 22) L. St-Onge and M. Sabsabi: Spectrochim. Acta B, 55 (2000), 299.