Abstract
A remarkable difference in thermal desorption spectra of hydrogen obtained from pre-strained high-strength steel specimens which were charged with hydrogen by two different methods was observed. One charging method is by immersion in NH4SCN solution and the other is by cyclic corrosion tests. In order to understand the difference, we simulated numerically thermal hydrogen spectra of the pre-strained high-strength steel. As a result, it was found that the difference of desorption spectra results from the difference of initial hydrogen states which is caused by the amount of charged hydrogen. It was also found that the desorption spectrum in the case of cyclic corrosion test is more sensitive to the initial hydrogen state than that of the immersion case because the amount of charged hydrogen in the former is not as enough as that in the latter.
1. Introduction
High-strength steels are used for building large-scale constructions such as high-rise buildings and long bridges to decrease their total weight. The weight reduction is also desired for many other products such as automobiles, vessels, and information devices. However sensitivity to delayed fracture becomes large as the strength of steels is high.1,2) It is well-known that hydrogen embrittlement3) is one cause of delayed fracture, thus its mechanism4,5,6,7,8) is pursued in order to predict and prevent delayed fracture. Hydrogen atoms in steels migrate and are trapped by defects such as vacancies, dislocations, and grain-boundaries, so that mechanical properties of the steel are changed by interaction between hydrogen atoms and defects. Therefore the location of hydrogen atoms in steels, namely the hydrogen trap state, is indispensable information to elucidate the mechanism of hydrogen embrittlement. However difficulty of direct observation of hydrogen due to its lightness and rapidness makes it difficult to reveal the mechanism.
Thermal desorption spectra of hydrogen obtained by thermal desorption spectrometry (TDS)9,10) are widely employed as effective information for indentifying the hydrogen trap state. Since hydrogen atoms trapped by defects are released in the thermal activation process, thermal desorption spectra of a specimen, which are a relation between temperature of the specimen and the desorption rate of hydrogen, reflect the hydrogen trap state of the specimen. Actually, TDS has been applied to many kinds of steels and alloys for examining the hydrogen state of them.11,12,13,14,15) In experiments of TDS, a specimen is charged with hydrogen mainly by immersion in aqueous solutions. The cathodically charging method is also used widely. In these methods, one can charge specimens conveniently with the comparatively large amount of hydrogen. However it is not obvious whether the hydrogen trap state in specimens charged by these methods is same as that of steel materials used in actual environment in which delayed fracture is observed. Therefore, it is necessary to compare thermal desorption spectra of steel materials in actual environment with those of specimens charged with hydrogen by the method used in laboratories and to know the difference between the two cases. In order to reveal the essence of the difference, in addition, it is significant to estimate the hydrogen trap state by simulating numerically thermal desorption spectra of each case.
In this paper, we report the comparison of thermal desorption spectra obtained by TDS of high-strength steel specimens which were charged with hydrogen by two different methods; one is by immersion in a standard aqueous solution and the other is by salt spray in the cyclic corrosion test (CCT). The former is a typical charging method used in laboratories, and the latter is one method which simulates penetration of hydrogen into specimens in actual corrosive environment.16,17) In addition, by simulating numerically thermal desorption spectra obtained in these experiments, we discussed the difference of them from the viewpoint of the hydrogen trap state.
This paper is organized as follows. The next section describes the experiment of TDS for obtaining the thermal desorption spectrum of unstrained and pre-strained high-strength steel specimens charged with hydrogen by two methods. The method and results of the numerical simulation are described in the third section. In the forth section, we discuss the influence of the initial hydrogen state prior to the heating process upon the thermal desorption spectrum and the kind of defects causing desorption peaks observed in the experiment. The paper is summarized in the final section.
2. Experiment
As a sample material of high-strength steels, we used SCM435 steels whose chemical composition is shown in Table 1. Induction hardening whose condition is described in Fig. 1 was performed as a heat treatment to the steel, so that its tensile strength is 1103 MPa. After the diameter of cylindrical sample materials was reduced from 10 mm to 9 mm by cold-drawing, we prepared pre-strained cylindrical specimens of 8 mm in diameter by machining. The specimen length is 30 mm. Unstrained specimens whose dimensions are identical with those of the pre-strained specimen were also prepared by machining directly the cylindrical sample material of 10 mm in diameter. For charging with hydrogen, both unstrained and pre-strained specimens were immersed in the aqueous solution of 20% NH4SCN at a temperature of 50°C which is based on the FIP test.18) The time of immersion was 48 hours. In this paper, charging with hydrogen by immersion in 50°C 20%NH4SCN solution for 48 hours will be called the FIP test below. In the CCT, one cycle was 8 hours long and it consisted of salt spray (5%NaCl solution, 35°C, 2 hours), dry (20–30%RH, 60°C, 4 hours), and wet (more than 95%RH, 50°C, 2 hours). Here RH means relative humidity. We repeated 42 cycles. Both unstrained and pre-strained specimens were charged with hydrogen by this CCT. Each specimen charged with hydrogen by each method was heated from room temperature at the heating rate of 100°C/hr, and hydrogen desorbed from the specimen was measured by a gas chromatograph during heating.
Table 1. Chemical composition of SCM435 (mass%).
| C | Si | Mn | P | S | Al | Cr | Mo | N |
|---|
| 0.35 | 0.24 | 0.79 | 0.023 | 0.016 | 0.036 | 1.09 | 0.15 | 0.005 |

Figure 2 shows the obtained thermal desorption spectrum of the unstrained and pre-strained specimens charged with hydrogen by each method. The amount of desorbed hydrogen is shown in Table 2. According to the figure, in both the FIP and the CCT, while one desorption peak is observed for the unstrained specimen, a shoulder is observed at the side of one desorption peak for the pre-strained specimen. The shoulder is at the high temperature side of the peak in the FIP test, and is at the low temperature side of the peak in the CCT. The peak temperature is higher in the CCT than in the FIP test. In addition, it is found from Table 2 that the amount of desorbed hydrogen in the CCT is smaller than that in the FIP test. The amount of desorbed hydrogen of the pre-strained specimen is larger than that of the unstained specimen. Thus, the peak height of the CCT is lower than that of the FIP test, and the peak height of the pre-strained specimen is higher than that of the unstrained specimen. From these results, we inferred that the shoulder at the side of the peak appeared because a new type of defect was generated by pre-strain. We also inferred that the difference in thermal desorption spectra of the pre-strained specimen between the FIP test and the CCT results from the amount of charged hydrogen because trap sites are not considered to be influenced by these charging methods. In the following section, we confirm our hypotheses by simulating numerically the thermal hydrogen desorption process.

Table 2. Amount of desorbed hydrogen (mass ppm).
| unstrained | pre-strained |
|---|
| FIP test | 1.64 | 4.73 |
| CCT | 0.058 | 1.084 |
3. Numerical Simulation
The numerical simulation of the thermal hydrogen desorption process is indispensable to estimate hydrogen trap states from thermal hydrogen desorption spectra. Since thermal desorption spectra depend on many factors such as binding energy and concentration of trap sites which characterize the hydrogen trap state, the heating rate, and the specimen size, the numerical simulation is also employed for examining sensitivity of desorption spectra to these factors.19,20,21,22)
3.1. Simulation Method
We used the fundamental model of the thermal hydrogen desorption process which can simulate desorption spectra with plural peaks.23) The model for cylindrical specimens is represented by the following one-dimensional reaction-diffusion equation in radial direction,
|
∂C
∂t
+∑
i
N
i
∂
θ
i
∂t
=D
∂
2
C
∂
r
2
+D
1
r
∂C
∂r
,
| (1) |
|
∂
θ
i
∂r
=
k
i
C(
1–
θ
i
)
–
p
i
θ
i
,
| (2) |
where
C [/m
3] is the hydrogen concentration at diffusion sites,
Ni [/m
3] is the concentration of trap sites of the defect
i, and
θi is the trap site occupancy that equals 1 when trap sites are fully occupied by hydrogen. The diffusion coefficient
D is represented by
D = D0 exp(
–Q/RT) where
D0 [m
2/s] is the temperature-independent factor,
Q [J/mol] is the diffusion activation energy,
T [K] is temperature, and
R = 8.31 J/K·mol is the gas constant. In
Eq. (2) for reaction between hydrogen atoms and trap sites,
ki [m
3/s] is the trapping rate represented by
ki = k0i exp(
–Q/RT) and
pi [/s] is the detrapping rate represented by
pi = p0i exp{–(
Q + Ei)/
RT}, and
k0i and p
0i are the pre-exponential factor in these rates. In the detrapping rate,
Ei [J/mol] is the binding energy between a hydrogen atom and a trap site of
i defect. In the heating process, temperature changes as
T = T0+ ϕt where
T0 is the initial temperature and
ϕ [K/s] is the heating rate.
The parameters described above were determined based on previous reports and our inference from the experimental results. First of all, we considered the thermal desorption spectrum of the unstrained specimen charged by the FIP test in Fig. 2(a). Since the numerical simulation of thermal desorption spectra of unstrained SCM435 steels is reported in the paper,21) we adopted the binding energy and the concentration of trap sites of the paper. As for the diffusion coefficient, we employed Q = 3.9 kJ/mol and D0 = 4.2×10⁻⁸ m2/s24,25) which are for hydrogen migration through interstitial sites of pure iron. The value of p01 and k01 was determined so that our simulation can reproduce our experimental result, so we used p01 = 20/s and k01 = 1.0×10⁻²⁸ m3/s. Next we determined parameters regarding the pre-strained specimen of the FIP test on the basis of those of the unstrained specimen. Since the peak temperature of the pre-strained specimen in Fig. 2(a) is very close to that of the unstrained specimen though the former is slightly higher than that of the latter, we inferred that the peak of the pre-strained specimen is due to the same kind of defect as that for the peak of the unstrained specimen. Therefore we assumed the binding energy of the defect for the peak of the pre-strained specimen is equal to that of the unstrained specimen. We also inferred that the slightly different peak temperature between them results from the increase of trap sites of the corresponding defect by pre-strain. Thus, as the concentration of trap sites for the peak of pre-strained specimens, we used a value which is slightly larger than the concentration of trap sites for the peak of unstrained specimens. As for the shoulder in Fig. 2(a), we inferred that it results from hydrogen released from defects which were newly generated by pre-strain. From the fact that the shoulder is at the high temperature side of the peak, we assumed that the binding energy of the new defect is larger than that for the peak. However if it is too large, another peak is formed instead of the shoulder. Thus we selected an appropriate value as the binding energy of trap sites for the new defect so that the shoulder seen in the experimental result is reproduced. As for the concentration of trap sites for the shoulder, we also selected it so that the height of the shoulder in Fig. 2(a) is reproduced. As for k0 and p0, for simplicity, we used the value for unstrained specimens, namely p02 = p01 and k02 = k01, because we do not have positive reasons for changing them. Furthermore, we assumed that the trap site in steels is unchanged by the hydrogen-charging method, so that we used same parameters as the FIP test for simulating thermal desorption spectra of the CCT. In Table 3, the binding energy and the concentration of trap sites which were used for our simulation are summarized. In the table, the trap site with low binding energy is denoted as i = 1 and that with high binding energy is as i = 2. We will call each kind of trap site as Trap site 1 or Trap site 2 below.
Table 3. The binding energy and the concentration of trap sites: i=1 is assigned for the peak and the shoulder at the low temperature side and i=2 is assigned for those at the high temperature side.
| E1 | N1 | E2 | N2 |
|---|
| Unstrained | 27 kJ/mol | 4.1×1026 /m3 | – | – |
| Pre-strained | 27 kJ/mol | 4.7×1026 /m3 | 42.5 kJ/mol | 6.5×1024 /m3 |
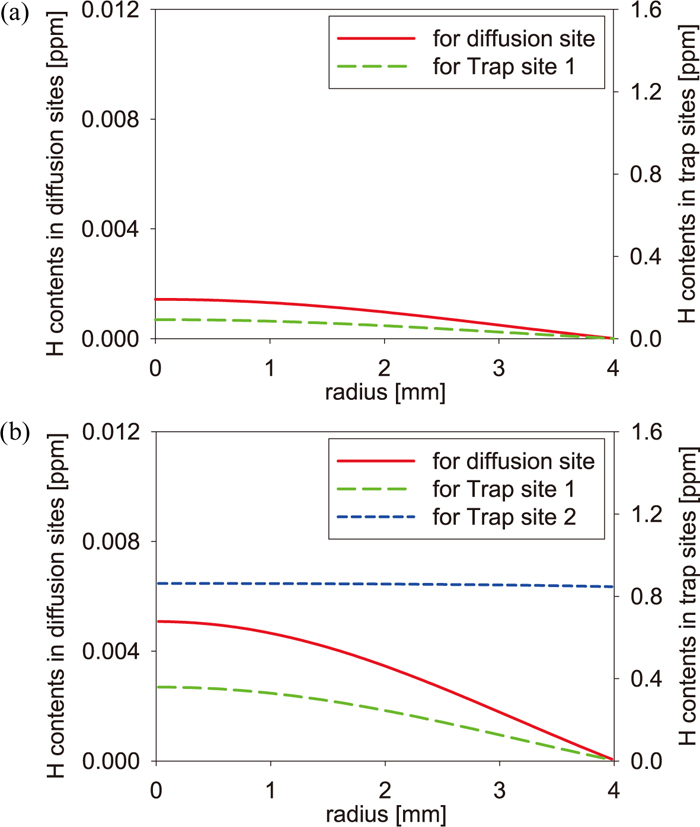
Equations (1) and (2) incorporating parameters determined above were solved numerically in the discrete region with the radius length of specimens. As a boundary condition at the specimen surface, we used the vacuum condition, namely C(r = R) = 0 where R is the radius length. The discretization constant is dr = R/100 and the time step dt was varied during simulations so that Ddt/dr2 < 0.5 is satisfied. As an initial state, we used states which were obtained by reducing the total hydrogen content from the large amount of hydrogen in the homogenous equilibrium state at 50°C to the experimental value. Figures 3 and 4 show the initial hydrogen state of unstrained and pre-strained specimens in the FIP test and in the CCT, respectively. In these figures, while the hydrogen distribution of Trap site 1 varies like that of the diffusion site, the hydrogen distribution of Trap site 2 is almost homogeneous. In the FIP test, the amount of hydrogen of Trap site 1 is larger than that of Trap site 2, and the tendency is opposite in the CCT. This is based on the local equilibrium state between the diffusion site, Trap site 1, and Trap site 2 is after the process of discharging the total hydrogen content. Although the larger amount of hydrogen is usually distributed into Trap site 2 with higher binding energy in the equilibrium state, Trap site 2 is saturated because the amount of charged hydrogen is larger than the concentration of Trap site 2, so that the hydrogen distribution of Trap site 2 becomes almost homogenous. In the case of CCT, since the residual hydrogen after saturation of Trap site 2 is smaller than the amount of hydrogen filling Trap site 2, the amount of hydrogen in Trap site 1 becomes smaller than that of Trap site 2.

In the experiment of the FIP test, a possibility that hydrogen distributes homogenously in a specimen during immersion of 48 hours is high, and after finishing immersion the amount of hydrogen in the specimen may decrease until the heating process. In the experiment of the CCT, after the wet process, hydrogen may also decrease until the heating process though its distribution after the wet process is uncertain. Thus, the above-mentioned way of discharging hydrogen can be considered to be reasonable. However, it is difficult to estimate the amount of hydrogen decreasing between the charging process and the heating process because of unknown factors in the process for transporting specimens from hydrogen-charging equipment to TDS equipment such as time and environment. Therefore, in this paper, we adopted the initial hydrogen state in Figs. 3 and 4 as one extreme case. Since the adopted initial hydrogen state is one assumption, we discuss the influence of the initial state upon thermal desorption spectra in Section 4.
3.2. Simulation Results
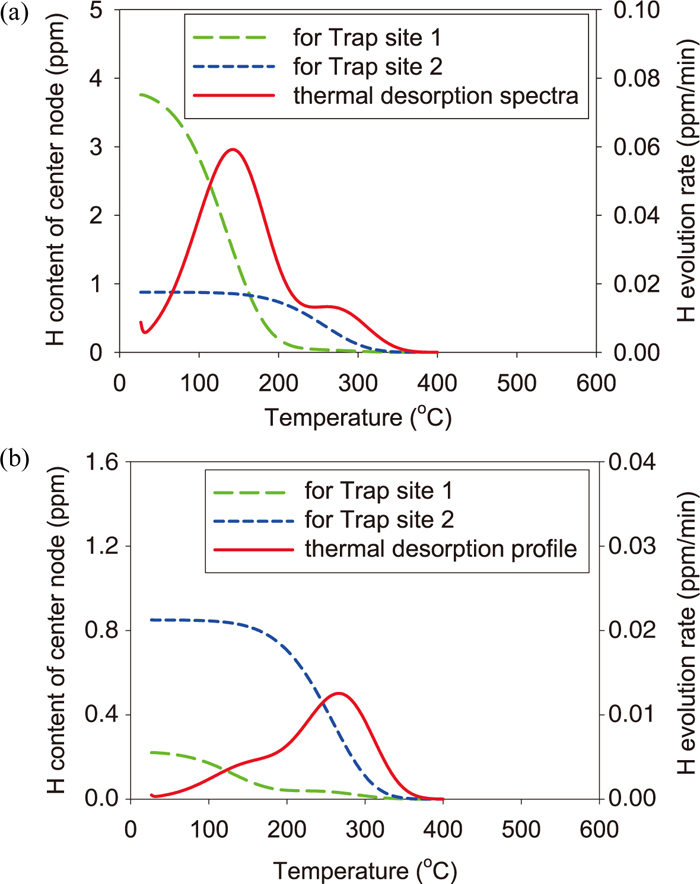
Figure 5 shows the simulation result of thermal desorption spectra of the unstrained and the pre-strained specimens in the FIP test and the CCT. According to the figure, in the case of FIP test, the result seems to reproduce nearly the shape of experimental spectra in Fig. 2(a) owing to adopting appropriate parameters. In the case of CCT, although the spectrum shape for the pre-strained specimen differs slightly from that of the experiment in Fig. 2(b), it reproduces the tendency that the shoulder appears at the low temperature side of desorption peak. The spectrum shape of the unstrained specimen in the CCT seems to be reproduced. Since only the amount of charged hydrogen is different between the FIP test and the CCT, it can cause the difference in spectrum shape of the pre-strained specimen between the two tests. In order to examine how the amount of charged hydrogen causes the difference in desorption spectra of the pre-strained specimen, Fig. 6 shows the change of the average amount of hydrogen at each trap site in the FIP test and the CCT. The desorption spectrum is also shown in the figure. According to the figure for both tests, during the heating process, hydrogen is first released from Trap site 1 because the binding energy of Trap site 1 is smaller than that of Trap site 2. In the case of FIP test, since the amount of hydrogen in Trap site 1 is larger than that of Trap site 2, the peak is formed by hydrogen released from Trap site 1 and the shoulder is formed by hydrogen of Trap site 2. In the case of CCT, the shoulder is formed by hydrogen of Trap site 1 because its amount is smaller than that of Trap site 2. From Figs. 3(b), 4(b), and 6, it is found that the different amount of charged hydrogen between the FIP test and the CCT causes the difference of the initial hydrogen distribution between them and that the difference of the initial hydrogen distribution brings about the difference in thermal desorption spectra of the pre-strained specimen between the two tests. Therefore, the difference in experimental spectra of the pre-strained specimen is considered to result from the hydrogen trap state prior to the heating process.

4. Discussion
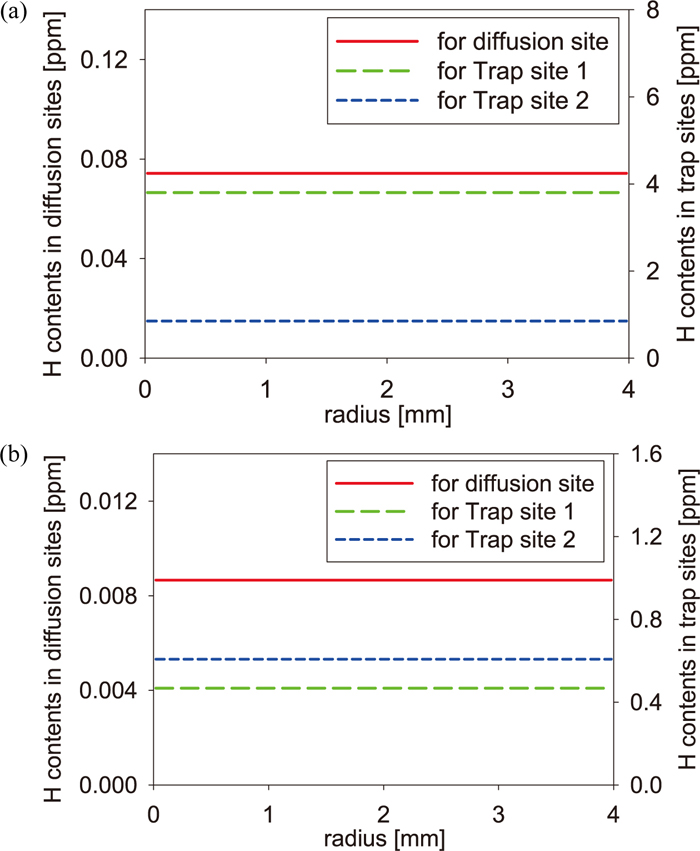
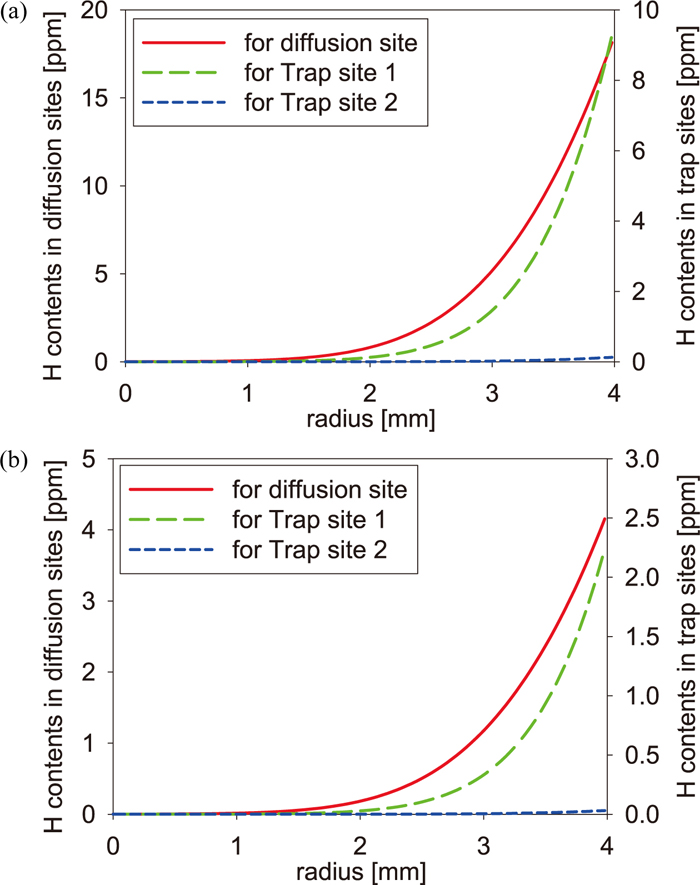
In the previous section, we found that the initial hydrogen distribution affects quite the shape of thermal desorption spectra. In our simulation, the initial hydrogen state was assumed as a state in which hydrogen had been discharged for enough long time. However, there is a possibility that the initial state differs from the assumption. Thus, we simulated desorption spectra of the pre-strained specimen in the FIP test and the CCT using two other kinds of initial hydrogen states as shown in Figs. 7 and 8. In Fig. 7, we assumed the homogenous equilibrium state as the initial state. In Fig. 8, we assumed the case that hydrogen does not penetrate into the center of specimens, namely it is the transitional state to the equilibrium state. This state was generated by the penetration simulation in which the value four times larger than the amount of desorbed hydrogen in Table 2 was set as the surface boundary condition. The penetration simulation was performed until the total hydrogen content becomes the value in Table 2. The real time for obtaining the transitional initial state is about 50 seconds in the simulation. Since the equilibrium state is considered as one extreme case which is opposite to the case of Figs. 3 and 4, there is a possibility that the initial hydrogen state of the experiment is a state between both extreme cases. We considered the transitional state as one possibility though the possibility is small because hydrogen may be able to penetrate into the deep inside of specimens in immersion of 48 hours. In the CCT, hydrogen may be considered to penetrate into the deep inside of the specimen, but a possibility that hydrogen stays around the specimen surface cannot be denied. In the homogenous case for the FIP test and the CCT of Fig. 7, the tendency of the amount of hydrogen in Trap site 1 and Trap site 2 is same as that of the initial state in Figs. 3(b) and 4(b). In the transitional case of Fig. 8, the amount of hydrogen in Trap site 1 is larger than that in Trap site 2 in both tests. From the difference between two types of initial states, it is seen that the large amount of hydrogen is captured by Trap site 1 in the penetration process, and then it is distributed into Trap site 1 and Trap site 2 in the process for reaching the local equilibrium state. Figure 9 shows the results for the FIP test and the CCT which were obtained by the simulation from the initial state of Figs. 7 and 8. According to Fig. 9(a), while the spectrum of the FIP test obtained from the equilibrium initial state is almost same as that from Fig. 3(b), the difference from Fig. 3(b) is observed in the spectrum obtained from the transitional initial state. The difference is caused by rapid desorption of hydrogen near the specimen surface and by the small amount of hydrogen in Trap site 2. In the case of CCT shown in Fig. 9(b), although the spectrum obtained from the transitional initial state has the same tendency as that of Fig. 9(a), the shoulder becomes higher in the spectrum obtained from the equilibrium initial state than in the spectrum obtained from Fig. 4(b), so that the spectrum becomes close to the experimental spectrum. This results from the fact that the amount of hydrogen of Trap site 1 in the homogenous equilibrium initial state is larger near the surface than that of the initial state in Fig. 4(b). From these results, hence, in the experiment, the initial hydrogen state in the CCT is considered to be close to the homogenous state rather than the state shown in Fig. 4(b) or Fig. 8(b). In addition, it is found that excepting the transitional case, thermal desorption spectra are comparatively sensitive to the initial hydrogen state when the amount of charged hydrogen is not enough.

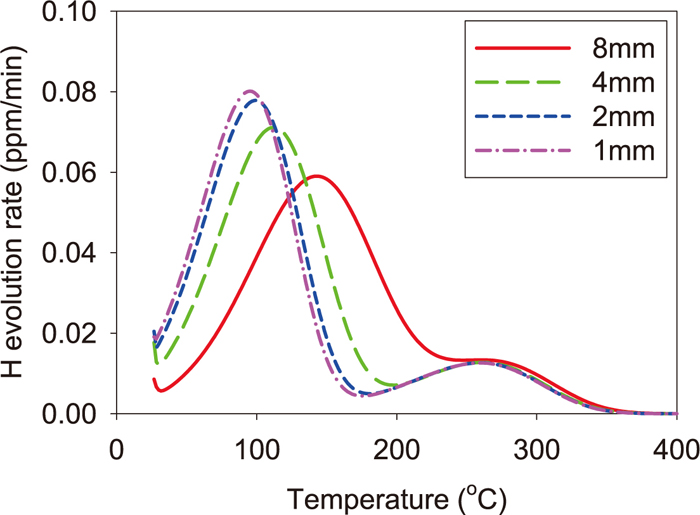
Next we discuss the kind of defects causing the peak and the shoulder which were observed in the experimental thermal desorption spectra. In the paper,21) the binding energy of 27 kJ/mol is adopted for simulations by considering that the peak in the spectrum of the unstrained SCM435 specimen results from the elastic field of dislocation. In the recent paper,26) it is supposed that the same peak is caused by the core of edge dislocations whose binding energy is reduced from 42 kJ/mol due to repulsive interaction between hydrogen atoms and carbon atoms segregating at the dislocation core. The paper27) reports that the binding energy of screw dislocations is 20 to 30 kJ/mol. Furthermore, N1 in Table 3 can be converted to the dislocation density of 1–2×10¹⁵ m/m3 21) which is quite a reasonable value. Therefore the defect of Trap site 1 can be inferred as dislocations. As for the defect of Trap site 2, E2 in Table 3 is close to the binding energy of a vacancy which is estimated theoretically28) and experimentally.29) The concentration of Trap site 2 can be converted to about 6×10⁻⁵ by supposing Trap site 2 as vacancies. Thus the defect of Trap site 2 can be considered as vacancies which may be generated by interaction among dislocations generated and/or moved by pre-strain.30,31) However, since the binding energy of the core of edge dislocations is reported as 42 kJ/mol as mentioned above, as another possibility, it can be inferred that it is the core of edge dislocations before segregation of carbon atoms. Therefore, it is difficult to identify the defect of Trap site 2 only from the simulation of thermal desorption spectra, so that the observation by other methods such as the positron annihilation spectroscopy is necessary. In addition, if the specimen size can be reduced until the thermal desorption process becomes the thermal-detrapping-determining process,32) the peak for each defect can be separated, so that the binding energy corresponding to each peak can be measured experimentally from thermal desorption spectra using the method proposed by Choo and Lee.33,34) In our simulation for the pre-strained specimen in the FIP test, as the specimen diameter became small, the shoulder became a peak and it separated from the peak at the low temperature side as shown in Fig. 10. Then, when the specimen diameter was less than 1.0 mm, the spectrum became independent of the specimen diameter, so that the thermal desorption process is considered to become the thermal-detrapping-determining process. The binding energies estimated from the desorption spectrum for the specimen of 1.0 mm in diameter became 27.1 ± 0.09 kJ/mol for the peak of the low temperature side and 42.5 ± 0.5 kJ/mol for the peak of the high temperature side. Since both binding energies estimated are almost the same as E1 and E2, respectively, by using a specimen whose diameter is less than 1.0 mm, we may be able to estimate from experimental desorption spectra the binding energy, and infer the kind of defect for each peak.
5. Summary
By comparing thermal hydrogen spectra of the unstrained and the pre-strained SCM435 steel specimens which were charged with hydrogen on the basis of the FIP test and of the CCT, the difference between them was examined. As a result, we confirmed that there is a remarkable difference in desorption spectra of the pre-strained specimen between the FIP test and the CCT. From the numerical simulation reproducing experimental spectra, it was found that the difference of the initial hydrogen distribution which results from the different amount of charged hydrogen between the FIP test and the CCT causes the difference of the thermal desorption spectrum. Furthermore, it was found that the thermal desorption spectrum in the case of CCT was influenced by the initial hydrogen distribution more than that of the case of FIP test because the former case cannot charge specimens with hydrogen as enough as the latter case, so that by assuming homogenous hydrogen distribution as the initial state, the experimental desorption spectrum of the pre-strained specimen in the CCT was reproduced better than assuming the initial state obtained by discharging hydrogen for a long time.
As for the kind of defects trapping hydrogen, although dislocations are supposed for the peak of the unstrained specimens, it is difficult to identify the kind of defects generated by pre-strain from the simulation of thermal desorption spectra. We need more experimental and theoretical consideration for identifying the kind of defects in the pre-strained specimen.
Acknowledgement
This research was carried out from 2009 to 2012 as part of the workshop of fundamental construction for hydrogen embrittlement supported by the Iron and Steel Institute of Japan.
References
- 1) S. Matsuyama: Delayed Fracture, The Nikkan Kyogyo Shimbun, LTD., Tokyo, (1989), (in Japanese).
- 2) S. Matsuyama: Tetsu-to-Hagané, 80 (1994), 679 (in Japanese).
- 3) M. Nagumo: Fundamentals of Hydrogen Embrittlement, Chapter 4, Uchida Rokakuho, Tokyo, (2008), (in Japanese).
- 4) J. Lufrano, P. Sofronis and H. K. Birnbaum: J. Mech. Phys. Solid., 46 (1998), 1497.
- 5) H. K. Birnbaum and P. Sofronis: Mater. Sci. Eng. A, 176 (1994), 191.
- 6) C. J. McMachon, Jr.: Eng. Fract. Mech., 68 (2001), 773.
- 7) M. Nagumo: Mater. Sci. Technol., 20 (2004), 940.
- 8) M. Yamaguchi, J. Kameda, K. Ebihara, M. Itakura and H. Kaburaki: Philos. Mag., 92 (2012), 1349.
- 9) M. Nagumo: Fundamentals of Hydrogen Embrittlement, Chapter 3, Uchida Rokakuho, Tokyo, (2008), (in Japanese).
- 10) K. Takai: Trans. Jpn. Soc. Mech. Eng. A, 70 (2004), 9 (in Japanese).
- 11) K. Takai, G. Yamauchi, M. Nakamura and M. Nagumo: J. Jpn. Inst. Met., 62 (1998), 267 (in Japanese).
- 12) K. Takai and R. Watanuki: ISIJ Int., 43 (2003), 520.
- 13) T. Yokota and T. Shiraga: ISIJ Int., 43 (2003), 534.
- 14) F. G. Wei and K. Tsuzaki: Metall. Mater. Trans. A, 37A (2006), 331.
- 15) H. Shoda, H. Suzuki, K. Takai and Y. Hagihara: ISIJ Int., 50 (2010), 115.
- 16) E. Akiyama: ISIJ Int., 52 (2012), 307.
- 17) S. Yamasaki and T. Takahashi: Tetsu-to-Hagané, 83 (1990), 454 (in Japanese).
- 18) Fédération Internationale de la Précontrainte: Report on Rrestressing Steel 5, FIP, Buckinghamshire, England, (1980), 1.
- 19) A. Turnbull, R. B. Hutchings and D. H. Ferriss: Mater. Sci. Eng. A, 238 (1997), 317.
- 20) T. Yamaguchi and M. Nagumo: ISIJ Int., 43 (2003), 514.
- 21) M. Enomoto, D. Hirakami and T. Tarui: ISIJ Int., 46 (2006), 1381.
- 22) K. Ebihara, T. Suzudo, H. Kaburaki, K. Takai and S. Takebayashi: ISIJ Int., 47 (2007), 1131.
- 23) K. Ebihara and H. Kaburaki: ISIJ Int., 52 (2012), 1131.
- 24) M. Nagano, Y. Hayashi, N. Ohtani, M. Isshiki and K. Igaki: Scr. Metall., 16 (1982), 973.
- 25) Y. Fukai, K. Tanaka and H. Uchida: Hydrogen and Metal, Uchida Rokakuho, Tokyo, (1998), 115 (in Japanese).
- 26) L. Cheng, M. Enomoto, D. Hirakami and T. Tarui: ISIJ Int., 53 (2013), 131.
- 27) J. P. Hirth: Metall. Trans. A, 11A (1980), 861.
- 28) Y. Tateyama and T. Ohno: Phys. Rev. B, 67 (2003), 174105.
- 29) S. M. Myers, D. M. Follstaedt, F. Besenbacher and J. Bottiger: J. Appl. Phys., 53 (1982), 8734.
- 30) H. G. van Bueren: Acta Metall., 3 (1951), 519.
- 31) U. Essmann and H. Mughrabi: Philos. Mag. A, 40 (1979), 731.
- 32) K. Ebihara, H. Kaburaki, T. Suzudo and K. Takai: ISIJ Int., 49 (2009), 1907.
- 33) W. Y. Choo and I.-Y. Lee: Metall. Trans. A, 13A (1982), 135.
- 34) W. Y. Choo and I.-Y. Lee: Metall. Trans. A, 14A (1983), 1299.