Abstract
The sulfides in some different gear steels were analyzed by original position statistic distribution analysis technique. The relationship between the proportion of the frequency of high intensity signals and the content of total sulfur and total oxygen in samples has been investigated. Multi-elemental correlation on high intensity signals has been performed in order to obtain the composition and proportion of different type of sulfides. It was found that the proportion of simple sulfide was more than that of oxide-sulfide duplex inclusion in six gear steel samples. The ratio of the oxide-sulfide duplex inclusion to the total sulfides were determined by the present method and the results had good coincidence with the value obtained by quantitative metallographic method and scanning electronic microscopy. The influence of the content of Ca on the composition of the sulfides was investigated. It was found that the relative proportion of the complex inclusions of Al–Ca–Mn–O–S increase with the rise of the content of Ca in gear steels. The ratio of the content of Ca to the content of S (Ca/S) also had great effect on the relative proportion of the oxide-sulfide duplex inclusion.
1. Introduction
Gear steel has been widely used in the manufacturing field of automobile, railway and shipping. It is important for the gear steel to possess high fatigue properties and good machinability. In order to improve the production efficiency, some countries are devoting their efforts to the study of easy-cutting gear steels, and the exploitation of easy-cutting gear steels with latest type is the development trend of gear steels technology. The non-metallic inclusion in gear steels are mainly composed of sulfides and oxides. Sulfide is the one of the most important inclusion and can affect the mechanical properties in anisotropic property and greatly improve the machinability of steels. But the extend of the influence on properties depends on the type, composition, shape, quantity, size and distribution of sulfides in steels. So the determination of the composition, quantity and distribution of sulfide is very important for the improvement of steelmaking technique and properties of gear steels.1)
There are many conventional methods2,3) for the analysis of sulfide in steel such as electrolysis extraction method, optical microscopy, scanning electronic microscopy combined with energy spectrum analysis. The electrolysis method has the disadvantages of long analytical period, trivial operation and a little loss of some fine and instable non-metallic inclusion. Optical microscopy and scanning electronic microscopy can be used to observe the microstructure and determine the composition of sulfide, but these methods still belong to microscopic analysis with the disadvantages of limited observed area and are not enough to represent the state of the sulfides in a large area of whole sample. On the basis of the research on the characterization of dissolved and combined aluminum in steel by Optical Emission Spectrometry (OES),4,5,6) Irisd has developed a rapid multielement method for the determination of non-metallic inclusions in steel, which is called OES-CDI. This method has been used for the quick analysis of the content and size distribution of the oxides. But this method only excited a fixed point of the sample with a 20 mm2 surface and is unable to continuously analyze the inclusions in a large area of the samples. Original position statistic distribution analysis (OPA) is a novel statistic characterization method for the quantitative distribution of different chemical composition and also can investigate their states of components on a large area of material.7,8,9,10) Moreover it can be used for the determination of inclusions by collecting and discriminating the signals produced by single spark discharge in the way of no pre-sparking, scanning and emitting continuously. In this paper, the sulfides of some different gear steels were analyzed by original position statistic distribution analysis technique and the multi-elemental correlation on high intensity signals has been investigated in order to obtain the composition and proportion of different type of sulfides. The results determined by the present method are in good agreement with the value obtained by quantitative metallographic method and scanning electronic microscopy.
2. Sample Composition and Experimental Methods
2.1. Compositions of Experimental Samples
The testing samples are from cast ingot of 18CrNiMo7-6. The main composition is presented in Table 1.
Table 1. Main composition of the testing samples (wt %).
| No. | C | Si | Mn | P | S | Cr | Ni | Mo | Alt | Ca | [O] |
|---|
| 1 | 0.16 | 0.06 | 0.54 | 0.005 | 0.037 | 1.51 | 1.40 | 0.25 | 0.0094 | 0.0002 | 0.0019 |
| 2 | 0.14 | 0.10 | 0.53 | 0.005 | 0.033 | 1.62 | 1.48 | 0.26 | 0.0051 | 0.0013 | 0.0041 |
| 3 | 0.14 | 0.16 | 0.53 | 0.004 | 0.032 | 1.58 | 1.47 | 0.26 | 0.0090 | 0.0020 | 0.0049 |
| 4 | 0.15 | 0.08 | 0.52 | 0.005 | 0.031 | 1.66 | 1.43 | 0.25 | 0.0032 | 0.0006 | 0.0030 |
| 5 | 0.15 | 0.08 | 0.52 | 0.004 | 0.008 | 1.65 | 1.45 | 0.26 | 0.0049 | 0.0005 | 0.0034 |
| 6 | 0.14 | 0.14 | 0.56 | 0.005 | 0.025 | 1.64 | 1.46 | 0.25 | 0.0180 | 0.0017 | 0.0042 |
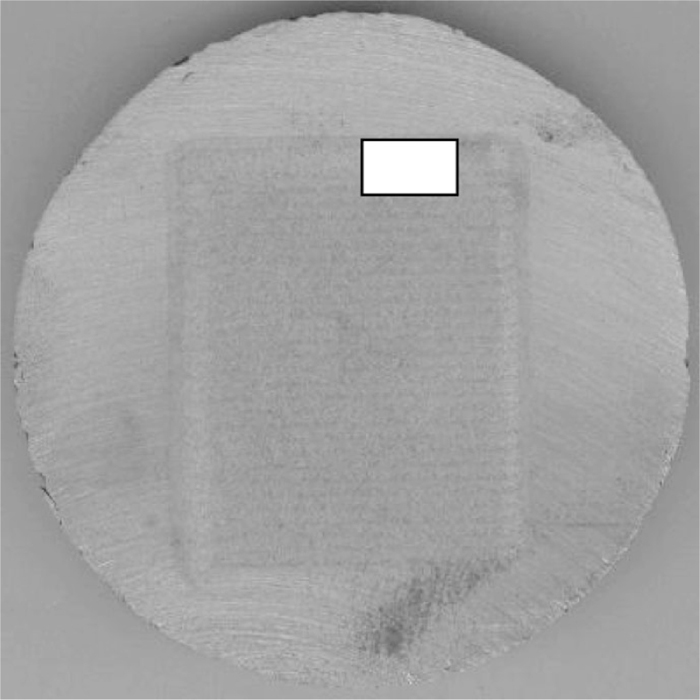
The slice of sample with the size of Φ90×15 mm was cut out from the middle of the cast ingot in the transverse direction. The surfaces of samples were ground on the resin paper with the size of 46 meshes. The scanning mode is linear at a continuous scanning speed of 1 mm/s along X-axis. Step model is used along Y-axis with an interval of 2 mm. The parameters of OPA are as follows: Exciting frequency: 480 Hz; exciting capacitance: 7.0 μ F; exciting resistance: 6.0 Ω; spark gap: 2.0 mm; purity of argon: 99.999%; flux of argon: 80 ml/s; material for electrode: tungsten electrode with 45 corner angle and the diameter of 3 mm. The spectrum signals are processed by a specially software. The scanning area of 50×56 mm is shown as Fig. 1. In order to get a comparable area with metallographic method, the region with the area of 16×10 mm in the position of half of radius was chosen as the analytical region. The area analyzed by OPA is scaled out in the white frame of Fig. 1.
The Morphology of the sulfides was observed by Hitachi S-4300 scanning electronic microscope and the composition of the sulfides was determined by energy dispersive spectrometer. The area percentage of sulfides and the number of different type of sulfides were quantitatively measured at a magnification of 500 by Zeiss 40MAT optical microscopy and the observed area of each microphotograph was 0.049 mm2.
3. Results and Discussions
3.1. Identification of Light Signals Emitted by Sulfides
The number of the light signals from each elemental discharge is up to 48000 when the analytical area is 160 mm2 and it is necessary to identify the light signals emitted by different state of the element. Sulfur in steels is usually in the presence of sulfide and there is little dissolved sulfur in the matrix of steel. So the light signals of sulfur can be divided into two parts: the low intensity signals corresponding to noise of the instrument and the blank of the matrix from S channel and the high intensity signals corresponding to sulfur in sulfides. For the first part the value of the low intensity can be obtained by the determination of the sample with a low content of sulfur (S≤0.001%). The sum of average intensity and two times of standard deviation from the low sulfur sample was regarded as the threshold value distinguishing the signals emitted by sulfides. Calcium in steels is mainly in the presence of calcium oxide and calcium sulfide. So the determination method of the threshold value of Ca-channel distinguishing the signals emitted by Ca inclusion is just the same as S element. Al,Si and Mn are in the presence of dissolved and combined states and two populations of the signals can be defined. The low intensity signals correspond to Al, Si and Mn element dissolved in the steel. Whereas the high intensity signals are related to Al, Si and Mn element contained in the inclusions. The statistic method that was used to analyze the dispersed data was adopted to process the intensity data of spectrum signal from Al, Si and Mn channels. A confidence probability was given and the confidence region could be found. The data out of the confidence region can be considered as an abnormal data that is beyond the normality distribution. The relationship can be expressed as follows:
|
|
X
i
–
X
¯
|>K⋅
σ
(X)
| (1) |
Where Xi is the value determined,
X
¯
is the average value, K is a coefficient related to the confidence probability and σ(X) is the standard deviation. When K is 2.0, the confidence probability is 95.5%. In this study K was given as 2 and the abnormal intensity data above the value (
X
¯
+2σ(X)) was identified and considered as the light signals emitted by the elements containing in the inclusions. The value of
X
¯
+2σ(X) was thought as a threshold value distinguishing the signals emitted by the inclusions containing Al, Si and Mn.
3.2. Relationship between the High Intensity Signals and the Quantity of Inclusions
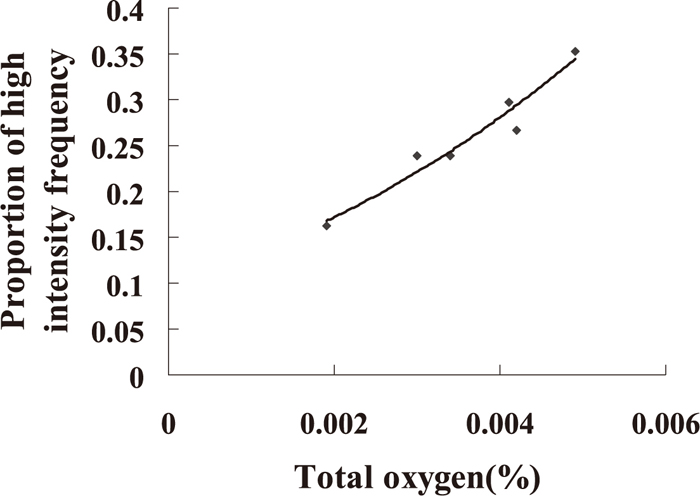
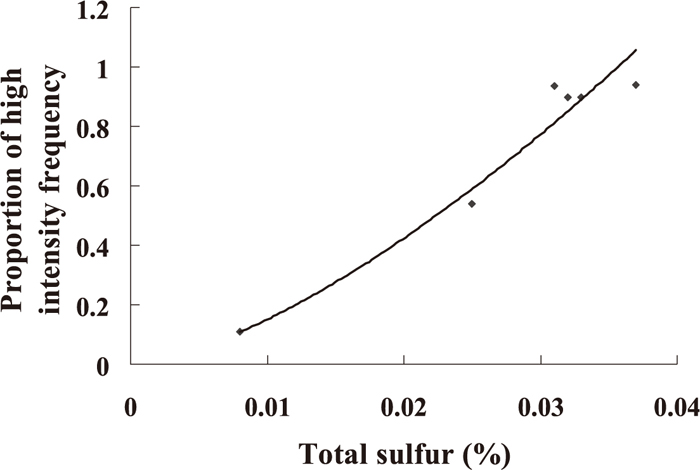
Because most of the sulfur element in steel is in the presence of sulfide, the content of total sulfur in steel may represent the quantity of the sulfides. Similarly, the content of total oxygen in steels will reflect the quantity of the oxides. Because the testing samples are deoxidized by Al element, the oxides in the samples are made up of alumina. So the relationship between the relative proportion of the high intensity frequency to total light signals and the total sulfur and oxygen content in samples has been investigated. It was found that the relative proportion of the high intensity frequency of S-signal increased with the rise of the content of total sulfur. The relationship curve is shown in Fig. 2. Meanwhile the relative proportion of the high intensity frequency of Al-signal increased with the rise of the content of total oxygen. The relationship curve is shown in Fig. 3. So it can conclude that the relative proportion of the high intensity frequency of S-signal and Al-signal have close relationship with the sulfides and oxides.
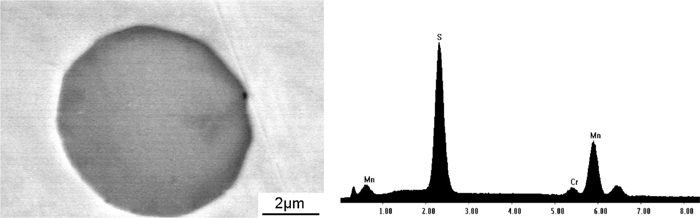
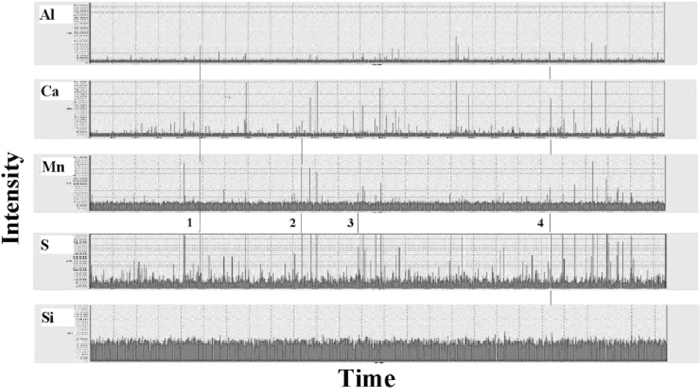
The abnormal high intensity signals of S, Mn, Ca, Al and Si elements were investigated considering that they are the main components of the sulfides and oxides. It was found that some abnormal signals with high intensity simultaneously appeared in the spectra channels of S, Mn, Ca, Al and Si elements, which indicated the composition of the inclusion in the discharge position. So the composition and the quantity of inclusions can be determined by multi-elemental correlation of high intensity signals emitted by the inclusions containing S, Mn, Ca, Al and Si elements. The correlation of five spectra channels in the first 1000 discharge for No. 4 sample is shown in Fig. 4. In No. 1 point excited by a spark discharge, abnormal high intensity signals in the spectra channels of Al, Ca, Mn and S simultaneously appear and we can conclude the composition of the inclusion in this point is Al–Ca–Mn–S. Because Al element is in the presence of alumina, the inclusion in this point is actually composed of Al, Ca, Mn, S and O elements. And in No. 2, No. 3 and No. 4 point the inclusions are Mn–Ca–S, Mn–S and Al–Ca–Si–Mn–S–O separately. Furthermore it should be considered that Fe element is also the main component of the sulfide but it is not suitable for Fe to correlate with other spectra channels as a matrix element. The microstructure and composition of the inclusions in YC2 sample were analyzed by scanning electronic microscope combined with energy dispersive spectrometer. It was found that the inclusions were composed of simple sulfides and oxide-sulfide duplex inclusion. The results are shown in Figs. 5 and 6, which were in good coincidence with the results by OPA. The statistic of the number of the discharge points just like No. 1 point are performed and the proportion of the inclusions with the composition of Al, Ca, Mn, S and O in total sulfides can be calculated. The processes of multi-element correlation of high intensity for other 5 samples were very similar with No. 4 samples and some different sulfides and oxide-sulfide duplex inclusions were also found in other 5 samples.
It was found that there were a lot of high intensity signals simultaneously appeared in the spectra channels of S and Al, which indicate that there are a large amount of complex inclusions of sulfide and alumina in gear steels. The abnormal high intensity signals from Ca channels increased with the rise of the content of Ca in steel and the discharge points in which the abnormal signals of Al, Ca and S simultaneously appear also increased. It indicates that the quantity of the inclusions with the composition of Al, Ca, Mn, and S also increase. The proportion of different type of the sulfides in total sulfides determined by OPA is shown in Table 2. It was found that quantity of simple sulfide was more than the oxide-sulfide duplex inclusion. The relative proportion of the simple sulfide and oxide-sulfide duplex inclusion were calculated and listed in Table 3. The area percentage of the sulfides (A) and the comparison of the results determined by quantitative metallographic analysis were also presented in Table 3. It was found that the relative proportion of the simple sulfide and oxide-sulfide duplex inclusion for six samples was in good agreement. The relative proportion of the high intensity frequency of S-signal also had close relationship with the area percentage of the sulfides. With the rise of the area percentage of the sulfides, the relative proportion of S-signal also increased.
Table 2. Proportion of different type of sulfides in total sulfides (%).
No.
Sulfides | 1 | 2 | 3 | 4 | 5 | 6 |
|---|
| (Mn, Fe)S | 78.66 | 68.65 | 63.18 | 74.44 | 57.38 | 65.32 |
| (Ca, Fe)S | 1.53 | 0.25 | 0.78 | 0.11 | 0.04 | 1.49 |
| (Ca,Mn, Fe)S | 0.68 | 0.08 | 0.07 | 0.07 | 0 | 0.11 |
| Al–Mn–O–S | 12.38 | 11.50 | 8.84 | 15.42 | 19.23 | 4.76 |
| Al–Ca–Mn–O–S | 1.33 | 16.59 | 25.75 | 6.97 | 9.33 | 14.51 |
| Al–Si–Mn–O–S | 1.22 | 0.38 | 0.15 | 0.73 | 2.90 | 0.66 |
| Al–Ca–Si–Mn–O–S | 1.02 | 1.84 | 0.71 | 0.88 | 8.14 | 11.84 |
| Others | 3.18 | 0.71 | 0.52 | 1.38 | 2.98 | 1.31 |
Table 3. Comparison of the relative proportion of the simple sulfide and oxide-sulfide duplex inclusion between metallographic analysis and OPA (%).
| No. | AA/% | metallographic analysis | OPA |
|---|
| Simple sulfide | oxide-sulfide duplex inclusion | Simple sulfide | oxide-sulfide duplex inclusion |
|---|
| 1 | 0.161 | 86.7 | 13.3 | 80.9 | 16.0 |
| 2 | 0.153 | 70.1 | 29.9 | 69.0 | 30.3 |
| 3 | 0.129 | 59.8 | 40.2 | 64.0 | 35.5 |
| 4 | 0.161 | 74.6 | 25.4 | 74.6 | 24.0 |
| 5 | 0.028 | 60.9 | 39.1 | 57.4 | 39.6 |
| 6 | 0.098 | 67.6 | 32.4 | 66.9 | 31.8 |
The influence of the content of Ca on the composition of the sulfides was investigated. It was found that the proportion of the complex inclusions of Al–Ca–Mn–O–S increased with the rise of the content of Ca in gear steels. The ratio of the content of Ca to the content of S (Ca/S) also had great effect on the relative proportion of the oxide-sulfide duplex inclusion. The relative proportion of the oxide-sulfide duplex inclusion increase with the rise of the ratio of Ca to S.
4. Conclusion
In this paper, the sulfides in some different gear steels were analyzed by original position statistic distribution analysis technique. The abnormal high light signals emitted by the inclusion elements were identified by the statistic method. The determination method of the threshold value for distinguishing the inclusion containing S, Ca, Al, Mn and Si element was presented. It was found that the proportion of the number of abnormal light signals emitted by S element increased with the rise of the content of total S. At the same time the ratio of the number of abnormal light signals emitted by Al element increased with the rise of the content of total O. So it can conclude that the ratio of high intensity signals from S and Al has close relationship with the quantity of sulfides and oxides.
Multi-elemental correlation on high intensity signals has been performed in order to obtain the composition and proportion of different type of sulfides. It was found that the proportion of simple sulfide was more than the oxide-sulfide duplex inclusion in six gear steel samples. and the results had good coincidence with the value obtained by quantitative metallographic method and scanning electronic microscopy. The influence of the content of Ca on the composition of the sulfides was investigated. It was found that the relative proportion of the complex inclusions of Al–Ca–Mn–O–S increase with the rise of the content of Ca in gear steels. The ratio of the content of Ca to the content of S (Ca/S) also had great effect on the relative proportion of the oxide-sulfide duplex inclusion.
References
- 1) T. Gladman: Ironmaking Steelmaking, 19 (1992), No. 6, 4573.
- 2) G. Auclair, R. Meilland and F. Meyer: Rev. Metall.-CIT, 93 (1996), No. 1, 119.
- 3) M. Kawakami, T. Nishimura, T. Takenaka and S. Yokoyama: ISIJ Int., 39 (1999), No. 2, 164.
- 4) S. Yongtae and J. S. Bae: IEEE Instrumentation and Measurement Technology Conf., IEEE, Piscataway, NJ, (2001), 1089.
- 5) F. Ruby and G. Willay: Rev. Metall.-CIT, 94 (1997), No. 3, 368.
- 6) H. Kuss, S. Lungen and G. Muller: Anal. Bioanal. Chem., 374 (2002), 1242.
- 7) H. Z. Wang: Sci. Forum, 539–543 (2007), 4446.
- 8) Y. H. Jia, H. Wang and H. Z. Wang: Mater. Sci. Forum, 15–17 (2007), 810.
- 9) D. L. Li and H. Z. Wang: Mater. Sci. Forum, 539–543 (2007), 4272.
- 10) Q. Y. Zhang, L. T. Wang and X. H. Wang: J. Iron Steel Res. Int., 15 (2008), No. 1, 70.