Regular Article
Development of a Rolling Chatter Model Considering Unsteady Lubrication
2014 Volume 54 Issue 1 Pages 165-170
Details
2014 Volume 54 Issue 1 Pages 165-170
Chatter, limiting the rolling speed for thin steel strips, has been identified as a serious limitation in increasing the efficiency of the cold rolling process. Many experimental investigations have led to the point that lubrication is one of the effective factors causing chatter. In this article, a new chatter model of the cold strip rolling with consideration of unsteady lubrication is proposed. The limiting shear stress concept and the variation of the lubricant viscosity with pressure are considered in this model. The results of the simulation are verified by comparing to experimental data. Also, a parametric study on the effect of some of the major parameters of rolling lubricant on the chatter critical speed is conducted. The results show that under the operating conditions of this paper, the limiting shear stress is an effective parameter.
Chatter is the most destructive vibration problem for thin steel strips in the cold rolling processes. Rolling chatter has three different types: third octave, fifth octave, and torsional chatter.1) The first is the most important type because it can lead to large gauge fluctuations, surface finish imperfections, and damage to mills.2) Also the lubricant flow between the work roll and the strip surface becomes extremely unsteady as a result of chatter. Many researchers have mentioned that lubrication is one of the basic factors incurring chatter.3,4,5,6) Due to the complexity of the problem, however, most of them have used simple friction models in their analysis,7,8,9,10) and only very few researches have described how chatter occurs through unsteady lubrication phenomenon.
Yarita et al.3) concluded from their practical investigations that chatter arises from impaired lubrication. They suggested that lubricant film strength, emulsion stability, and particle size distribution should be taken into consideration in selecting the rolling lubricants, and also the use of a lubricant with good lubricity successfully prevent chatter. Johnson and Qi11,12) and Chen et al.13,14) considered friction at the roll-strip interface as a function of relative velocity between the rolls and strip. Their study shows the importance of friction in chatter predictions.
Tung15) developed an unsteady lubrication model for vibrations in cold rolling. Kimura et al.4) discovered the existence of an optimum range for friction coefficient in which the vibrations are damped and the rolling mill is stable despite the disturbances. Also, they showed that with increasing the rolling speed, the rolling mill tends to chatter.
Yun et al.16,17,18,19) developed a fundamental understanding of chatter in rolling. Based on a constant friction factor, they presented a suitable dynamic model for studying chatter. Hu et al.2,20,21,22,23) expanded Yan et al.’s work and pointed out that there are four principle mechanisms for third octave chatter: negative damping, mode coupling, regenerative, and model matching. They expressed that an appropriate friction model is necessary to perform accurate chatter simulation.
Meehan7) investigated mode shapes and natural frequencies of a 4-high stand. It was seen from his research that third octave chatter and fifth octave chatter were vertically symmetrical about the stand pass line. Yang et al.8) built a chatter model for cold rolling including the hydraulic servo system model. Also a mathematical model containing the driving system was offered by Kim et al.9,24)
Wilson25) has defined four main lubrication regimes: the thick film and thin film regime (usually referred to as the full film regime), the mixed regime and the boundary regime. Most of models which considered lubrication have been developed under the assumption of steady flow of lubricant.26,27,28) This assumption, however, is not appropriate for studying chatter.
In this paper, a new chatter model for the cold rolling process under the unsteady lubrication is presented. In order to verify the proposed model, experimental results obtained from the cold strip tandem mill unit of Mobarakeh Steel Company (MSC) are used. Based on this model, effect of rolling lubricant parameters such as the rolling lubricant viscosity, the viscosity-pressure coefficient, and the limiting shear stress on chatter critical speed is studied.
Rolling chatter is discussed as a consequence of interactions between the rolling process and the mill structure.
2.1. Rolling Process ModelIn this research, the lubrication regime is assumed to be the full film. Figure 1 illustrates the coordinate system and geometry of the rolling process. The roll bite is divided into inlet, work and outlet zone. The first zone is where the lubricant pressure increases from the atmospheric pressure to the pressure required incurring strip plastic deformation. The second zone is where the rolling force and torque are generated. The variation of pressure in the last zone is reverse of that in the first zone. The lubricant pressure in the first and last zone only cause strip elastic deformation.
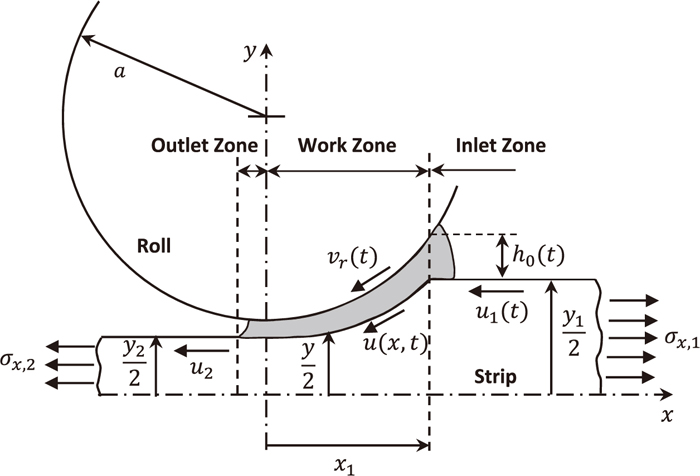
Rolling process geometry.
As the first step in the rolling process model, an inlet zone analysis should be developed. The key output from this analysis is the inlet film thickness (h0(t)).
The hydrodynamic pressure causes the separation between the strip and roll. This pressure (p), built up by wedge and squeeze action, is obtained from the Reynolds equation:
| (1) |
| (2) |
The boundary conditions in the inlet zone are:
| (3) |
In each time step increment, Eq. (1) is solved by applying the boundary conditions in order to determine the inlet film thickness (h0(t)). The inlet film thickness shows the amount of the oil input into the work zone.
2.1.2. Work Zone AnalysisHaving determined the variation of inlet film thickness from the inlet zone analysis, the work zone can now be analyzed. The output of this analysis is the work zone film thickness distribution (h(x, t)) which can be obtained from the continuity equation in fluid mechanics:
| (4) |
Figure 2 illustrates the stresses acting on a vertical slab element inside the work zone. Assuming that the tensile stress (σx) and the pressure (p) are principal stresses and with eliminating the work hardening effect and the comparatively small terms, the force balance equation in the x direction can be represented as:
| (5) |

A slab element.
The friction stress in the full film regime can be expressed as:
| (6) |
| (7) |
| (8) |
In the friction model, the pressure in the work zone is computed based on the Eqs. (5), (6), (7), (8) and the film thickness distribution obtained from the work zone analysis. Integrating the pressure distribution gives an estimation of the rolling force. Also, considering the mass conservation and given the fact that the strip speed at neutral point is equal to the roll peripheral velocity, the strip speed at entry and exit have been obtained.33,34)
2.2. Mill Structural ModelThe focus of this research is on the third octave chatter, which is symmetric with respect to the center-plane of the strip and is only a function of the vertical vibration.7) By neglecting the horizontal and torsional vibration, a unidirectional structure model is used as shown in Fig. 3. This model was used by many other researchers.7,12,34)

Mill structural model.
The relationship between the displacements of the center of the work roll (yw) and the center of the backup roll (yb) and the rolling force variation (dfy) can be expressed by two second order differential equations:
| (9) |
The rolling vibration model is achieved by combining the rolling process model with the mill structural model. Figure 4 shows the chatter model for a single stand.

Chatter Model.
The variation of strip tensile stress at entry and exit of stand is proportional to the integral of the difference between the variations of the exit speed of a stand and the entry speed of next stand.
| (10) |
| (11) |
The inputs of the rolling process model are the strip thickness at entry, the strip tensile stress at entry and exit. The outputs of that are the strip thickness at exit, the strip speed at entry and exit and the rolling force. The output speeds are used to calculate the strip tensile stress. The dynamic rolling force enters to the mill structural model. It leads to variation of the roll gap spacing and this variation enters to the process model. So the relationship between the rolling process and the mill structural model continues.
The experimental data of this research are from a two-stand tandem mill unit of Mobarakeh Steel Company (MSC). Figure 5 illustrates a view of this unit.
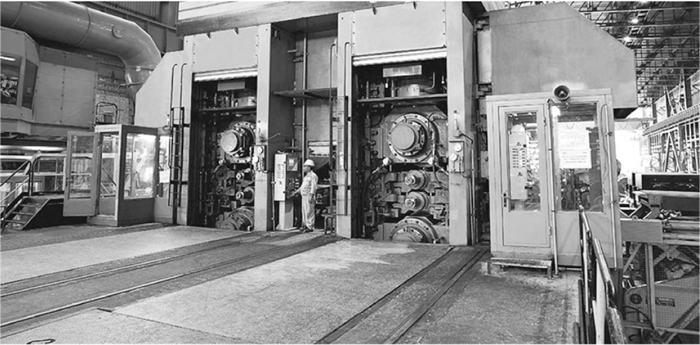
A view of two-stand tandem mill unit of Mobarakeh Steel Company.
Incoming coils to this unit are often 2 mm in thickness. Coils open up and pass through two 4-high stands two or three times. Usually thicknesses of the strip are reduced by 60 to 90 percent depending on the desired thickness. Outgoing strips from the second stand in any pass are coiled by a coiler machine (Pickup reel). The pickup reel of the previous pass plays role of the payoff reel for the current pass which is in the reverse direction of the previous pass. In practice in this mill, chatter usually occurs in second stand during the third pass.
Rolling control instrumentation in this unit consists of several analog and digital signals, all connected with a data collection system (IBA). All rolling conditions are recorded in this system and can be used online or offline. To evaluate the status of the rolling system in chatter conditions, rolling speed is increased for the moment. This is done by the operator via manual part of the control system which its online monitoring system is shown in Fig. 6.

Online monitoring system of the control system of the rolling process.
Mill modulus of a rolling mill is experimentally obtained using calibration test. In the calibration test, the deformation of the mill under rolling force is measured while the rolls are rotating but no strip material is passing through the roll gap. This deformation and the rolling force are used to calculate the mill modulus. Mill modulus is the equivalent stiffness of the contacting rolls and the stand. The deformation of the rolls is nonlinear. This nonlinearity is associated with the change in the contact area but can be linearized around the steady state rolling conditions. A finite element model is utilized to calculate the stiffness based on the contact between work roll-work roll and work roll-backup roll (Kw). Knowing both the mill modulus and the stiffness of the contacting rolls, the stand stiffness (Kb) can be calculated.
While no damping is assumed for the work rolls (Cw), a slight damping effect due to the lubricant film is present in the journal bearing of the backup rolls.12,22) Mill defects such as eccentricity and/or ovality in the rolls enforce the mill to vibrate while strip rolling. A simulation program of the forced vibration strip rolling is utilized to calibrate the backup roll damping coefficient (Cb). Actually in this program the backup roll damping coefficient is chosen so that the result of the oscillation domain of the rolling force matches with the experiment. This value is then verified by simulating mill response in various rolling conditions. This coefficient is used in the current project for the chatter simulation. This method has been applied in the cold and hot rolling process for the first time by the authors.1,35)
Specifications of the rolling mill under consideration are presented in Table 1. It also presents characteristics of the strip in the third pass. Inter-stand parameters are presented in Table 2. Lubricant parameters are reported in Table 3.
| Parameter | Stand 1 | Stand 2 |
|---|---|---|
| Work roll mass, Mw, (Kg) | 14000 | 14000 |
| Backup roll mass, Mb, (Kg) | 38000 | 38000 |
| Work roll damping coefficient, Cw, (N.s/m) | 0 | 0 |
| Backup roll damping coefficient, Cb, (N.s/m) | 1.254e6 | 1.254e6 |
| Work roll spring constant, Kw, (N/m) | 4.97e10 | 4.97e10 |
| Backup roll spring constant, Kb, (N/m) | 1.22e10 | 1.22e10 |
| Work roll radius, aw, (m) | 0.245 | 0.245 |
| Backup roll radius, ab, (m) | 0.675 | 0.675 |
| Strip width, w, (m) | 0.762 | 0.762 |
| Yield stress in the plane stress condition, σk, (MPa) | 896 | 953 |
| Entry thickness, y1, (mm) | 0.409 | 0.317 |
| Exit thickness, y2, (mm) | 0.317 | 0.210 |
| Parameter | Payoff real-Stand 1 | Stand 1-Stand 2 | Stand 2-Pickup real |
|---|---|---|---|
| Distance, L, (m) | 5.675 | 4.725 | 6.6 |
| Tensile Stress, σx, (MPa) | 95 | 147 | 79 |
| Parameter | Value |
|---|---|
| Dynamic viscosity at 50°C, η50, (Pa.s) | 0.0178 |
| Viscosity pressure coefficient in the Barus equation, α, (GPa–1) | 1.5 |
| Viscosity pressure coefficient in the Roelands equation, z | 0.5216 |
| Limiting shear stress, τL, (MPa) | 24.3 |
The chatter simulation model of the second stand of two-stand tandem mill unit of Mobarakeh Steel Company during the third pass has been constructed as shown in Fig. 7. The “stand 2” module represents the single-stand chatter model including the rolling process model, the mill structural model and the inter-stand model. The last deals with the transportation time delay and the inter stand tension effects. The “stand 1” and “pickup reel” module are applied in order to consider the tension variations before the entry and after the exit from the “stand 2”. Also, the “stand 1” module provides an initial excitation to the “stand 2”. The “clock” is used to trace the simulation time.
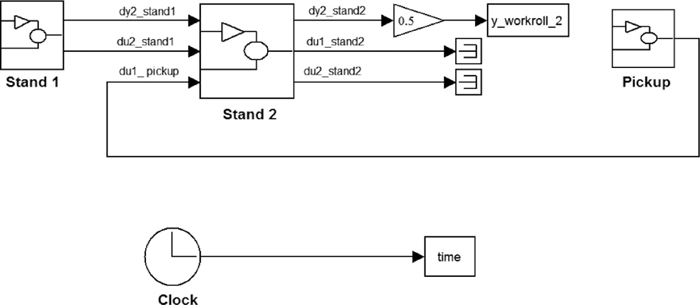
Chatter simulation program.
A positive equivalent damping coefficient tends to dampen vibration and to stabilize the rolling mill, while a negative one increases vibration and makes the mill unstable. On the other hand the equivalent damping coefficient is proportional to the inverse of the rolling speed.4,22) So the fact that increasing rolling speed causes a considerable decrease of the equivalent damping coefficient partially explains why the rolling speed is the most important parameter in controlling vibration of the rolling mill.33) Also the main characteristic in a chatter simulation program is its dependency to rolling speed. To investigate this issue, fluctuation in the work roll of the second stand has been examined. The results in the two different velocities (9 and 13 m/s) are presented in Figs. 8 and 9. Figure 8 shows that vibrations are damped at low speed (9 m/s) and the system is stable in this case. With increasing speed to 13 m/s, vibrations increase with time and the system becomes unstable (Fig. 9). It is clear that the undamped vibrations make the system unstable. Thus, these figures clearly show that the program depends on the rolling speed.

Work roll fluctuation in the stable case for rolling speed of 9 m/s.
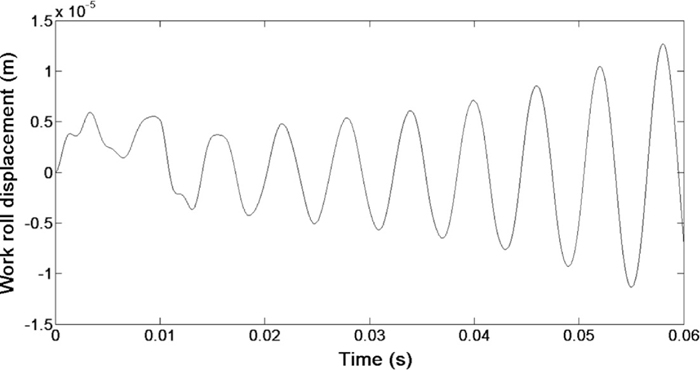
Work roll fluctuation in the unstable case for rolling speed of 13 m/s.
With trial and error, one can get the case where vibrations are undamped and vibrations amplitude versus time is unchanged. This represents the case in which the system is in the critical status. Accordingly, critical speed of the considered strip has been found to be 10.23 m/s. Work roll fluctuation of the second stand in this case is presented in Fig. 10.
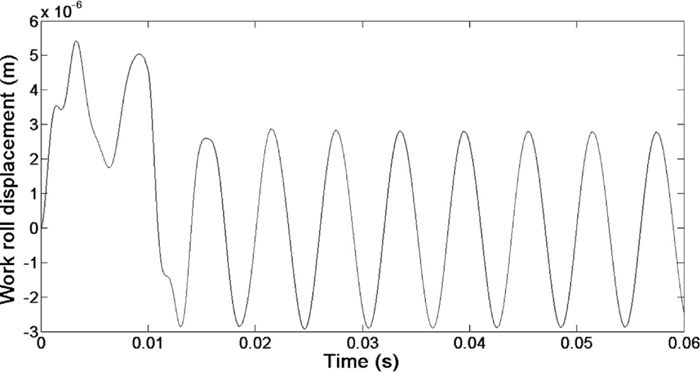
Work roll fluctuation in the critical case.
Figure 11 shows the FFT spectrum of the vibration signals in the unstable case for rolling speed of 13 m/s. Dominant frequency is calculated 169.5 Hz, which is within the frequency range of third octave chatter.

FFT spectrum of the vibration signals in the unstable case.
The above procedure has been repeated for four strips rolled in the two-stand tandem mill unit of MSC. Then, the critical speeds obtained from these simulations and experiments have been compared (Fig. 12). The results show that the critical speeds of simulations are on average about 42 percent larger than the critical speeds of experiments. Much of this difference can be related to occurrence mechanism of rolling chatter in the simulations with the single stand rolling and in the experiments with the two stands rolling. In the single stand rolling, the negative damping mechanism is activated while the regenerative chatter also occurs in the two stands rolling. In the other hand, the critical speed is much higher in the negative damping mechanism than in the regenerative chatter.33,34) So as expected, the rolling chatter in the experiments occurs much faster than that in the simulations.
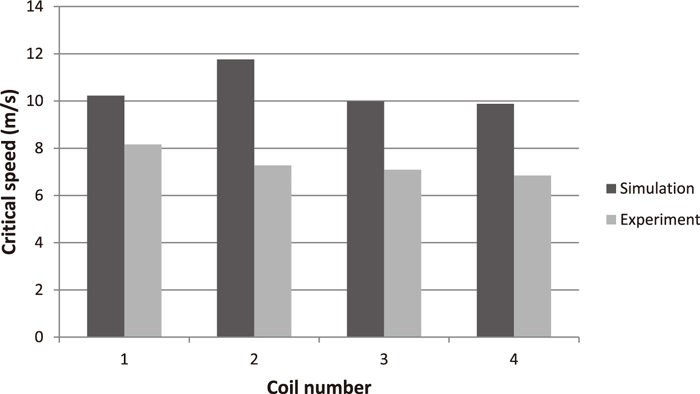
Comparison of critical speeds obtained from simulations and experiments.
Using the simulation program, the effect of some main parameters of the rolling lubricant on the chatter critical speed has been identified. Figures 13, 14, and 15 show the effect of the rolling lubricant viscosity (η50), the viscosity pressure coefficient in the Roelands equation (z), and the limiting shear stress (τL) on the chatter critical speed, respectively. The results indicate that excessive increasing of the first and the second parameter do not have considerable effect on the chatter critical speed; but the limiting shear stress variation does. This conclusion is consistent with the experimental results of Yarita et al.3) This can be expressed by the fact that in the investigated conditions, the friction stress exceeds the limiting shear stress, hence the friction stress is set equal to the limiting shear stress. As a result, the effect of the rolling lubricant viscosity and viscosity pressure coefficient variations in the studied conditions on the friction stress and chatter critical speed are negligible.

Effect of rolling lubricant viscosity on chatter critical speed.
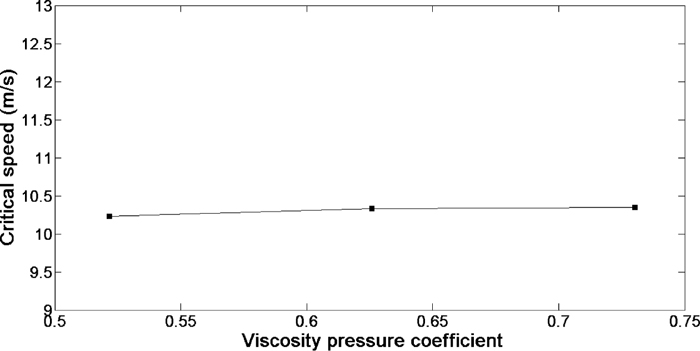
Effect of viscosity pressure coefficient on chatter critical speed.

Effect of limiting shear stress on chatter critical speed. (Online version in color.)
In this research, a new rolling chatter model by considering unsteady lubrication is presented. This chatter simulation program has been run for four strips rolled in the two-stand tandem mill unit of Mobarakeh Steel Company. The applied model has been verified by comparing the critical speeds obtained from the simulations to the experimental results. In addition, the effect of the rolling lubricant viscosity, the viscosity pressure coefficient, and the limiting shear stress on the chatter critical speed have been investigated quantitatively. The results show that under the reported operating conditions, the first and the second parameters do not have important effect on the chatter critical speed; but the last parameter is directly proportional to the chatter critical speed. Future work could focus on improving the lubrication model by formulating mixed lubrication regime, consideration the effect of surface roughness, and employing a more accurate relation for the limiting shear stress.
The authors are grateful for the assistance of the Mobarakeh Steel Company.