2. Experimental Procedure
2.1. Experimental Materials
First of all, conventional geothermal rotor material10) has been set as the standard material, and several modification were made by increasing Ni and Mn which are austenite stabilization elements, with the aim of improving hardenability. Each experimental sample was made from 50 kg steel ingots melt by vacuum induction melting and forged to a board with 35 mm thickness with forge ratio 4.1. These experimental materials (here called BJ steels) are shown in Table 1.
Table 1. Chemical composition of the 1 mass% CrMoV steels.
| (mass%) |
| Steel | C | Si | Mn | Ni | Cr | Mo | V | Note |
| BJ1 | 0.27 | 0.07 | 0.77 | 0.60 | 1.32 | 1.30 | 0.24 | Conventional Steel |
| BJ2 | 0.27 | 0.07 | 0.77 | 0.90 | 1.31 | 1.30 | 0.24 | Increasing Ni |
| BJ3 | 0.27 | 0.07 | 1.02 | 0.90 | 1.31 | 1.30 | 0.24 | Increasing Ni, Mn |
| BJ4 | 0.28 | 0.07 | 1.33 | 0.91 | 1.30 | 1.30 | 0.25 | Increasing Ni, Mn |
Another set of experimental materials (here called CJ steels) with more Cr and Mn are shown in Table 2. These were also made with the aim of improving hardenability, and at the same time, Si increase and Mo decrease were investigated from the point of view of resistance to C-segregation at the center part of the steel ingot.
Table 2. Chemical composition of the 2 to 3 mass% CrMoV steels.
| (mass%) |
| Steel | C | Si | Mn | Ni | Cr | Mo | V | Note |
| BJ1 | 0.27 | 0.07 | 0.77 | 0.60 | 1.32 | 1.30 | 0.24 | Conventional Steel |
| CJ1 | 0.23 | 0.05 | 0.84 | 0.90 | 2.39 | 0.78 | 0.20 | Standard 2 |
| CJ2 | 0.24 | 0.05 | 0.86 | 0.91 | 3.32 | 0.79 | 0.20 | Increasing Cr |
| CJ3 | 0.24 | 0.05 | 1.30 | 0.92 | 3.32 | 0.80 | 0.21 | Increasing Cr, Mn |
| CJ4 | 0.24 | 0.04 | 0.85 | 0.91 | 2.27 | 0.81 | 0.20 | Standard 3 |
| CJ5 | 0.24 | 0.04 | 1.00 | 0.89 | 2.24 | 0.80 | 0.20 | Increasing Mn |
| CJ6 | 0.25 | 0.14 | 0.84 | 0.90 | 2.26 | 0.81 | 0.20 | Increasing Si |
| CJ7 | 0.24 | 0.14 | 1.00 | 0.91 | 2.26 | 0.81 | 0.20 | Increasing Si, Mn |
| CJ8 | 0.24 | 0.15 | 1.01 | 0.91 | 2.26 | 0.61 | 0.20 | Increasing Si, Mn
Decreasing Mo |
Typical samples for SCC testing were selected from among Tables 1 and 2, which are shown in Table 3. Every sample was heated and held at 920°C for 3 hours and quenched with cooling rate of 80°C/h, tempering was done at 645°C for 20 hours, with the exception of one material. BJ1 - which is the composition of conventional geothermal rotor material - was found to be a little harder than actual rotor material with this condition, so another BJ1 material sample for the SCC test was tempered at 658°C.
Table 3. Chemical composition of the steels for SCC tests.
| (mass%) |
| Steel | C | Si | Mn | Ni | Cr | Mo | V | Heat treatment condition | Hardness
(HV) |
| Q (°C) | T (°C) |
| BJ1* | 0.27 | 0.07 | 0.77 | 0.60 | 1.32 | 1.30 | 0.24 | 920°C×3 h | 658°C×20 h | 292 |
| BJ1 | 0.27 | 0.07 | 0.77 | 0.60 | 1.32 | 1.30 | 0.24 | 920°C×3 h | 645°C×20 h | 309 |
| BJ2 | 0.27 | 0.07 | 0.77 | 0.90 | 1.32 | 1.30 | 0.24 | 302 |
| CJ1 | 0.23 | 0.05 | 0.84 | 0.90 | 2.39 | 0.78 | 0.20 | 273 |
| CJ2 | 0.24 | 0.05 | 0.86 | 0.91 | 3.32 | 0.79 | 0.20 | 259 |
| CJ8 | 0.24 | 0.15 | 1.01 | 0.91 | 2.26 | 0.61 | 0.20 | 283 |
BJ1*: Conventional geothermal turbine rotor steel, Q: Quenching, T: Tempering
As a result of tests performed on the materials listed in Tables 1, 2 and 3, it was found that material CJ8 had the most satisfactory balance of necessary characteristics for geothermal rotors. Material CJ8 was supplied to manufacture an 8 ton sand mold ingot. The composition is given in Table 4.
Table 4. Chemical composition of the steel for the 8 ton sand mold casting test.
| (mass%) |
| C | Si | Mn | P | S | Ni | Cr | Mo | V |
| 0.24 | 0.17 | 1.00 | 0.005 | 0.0009 | 0.92 | 2.26 | 0.61 | 0.20 |
In order to be simulate cooling rates of larger rotor diameter and to ensure hardenability with cooling rates down to 80°C/h, materials from Tables 1 and 2 were held at 920°C for 3 hours and then cooled at rates from 10°C/h to 100°C/h (every 20°C/h). From 550°C all samples were air cooled. Microstructure of each sample was then observed with an optical microscope. Samples with slower cooling rates started to show proeutectoid ferrite precipitate. We defined the cooling rate when the first precipitate ferrite appeared as the critical cooling rate. For example, in BJ1 material which is conventionally used, the proeutectoid ferrite has slightly started to precipitate at the 100°C/h cooling rate, so the critical cooling rate was evaluated as 100°C/h. We have also pigeonholed the critical cooling rate against each alloying element, and have investigated each element’s tendency affect to critical cooling rate.
Some samples were heated up to 920°C for 3 hours, quenched with cooling rate of 80°C/h, and then tempered at 645°C or 675°C for 20 hours. These samples were subjected to tensile tests and Charpy impact tests, and the results were evaluated for balance of strength and toughness.
2.3. SCC Test
Geothermal steam contains corrosive elements such as hydrogen sulfide (H2S), which present risk of SCC for turbine components exposed to the steam. Therefore it is important to understand the resistance to SCC of the turbine rotor material. There are two methods for testing the resistance to SCC; one is to use real geothermal steam at a geothermal power generation plant, and the other is to evaluate at the laboratory by making a geothermal steam corrosive environment.
This SCC test was done in the laboratory using the 3-point bending test based on the low alloy steel test method in H2S environment (TM0177-Method B) prescribed by NACE (National Association of Corrosion Engineers).11) This test method allows comparison of SCC sensitivity easily in short time against (small) composition variations of low alloy steel in H2S, especially variation of Cr or Ni content, or variation of hardness.12,13) The test environment is 24±1.7°C, and H2S saturated solution with 5% acetic acid. Figure 1 shows the SCC samples’ shape and dimensions which are used for the 3-point bending test.
2.4. Manufacturing the 8 Ton Sand Mold Ingot
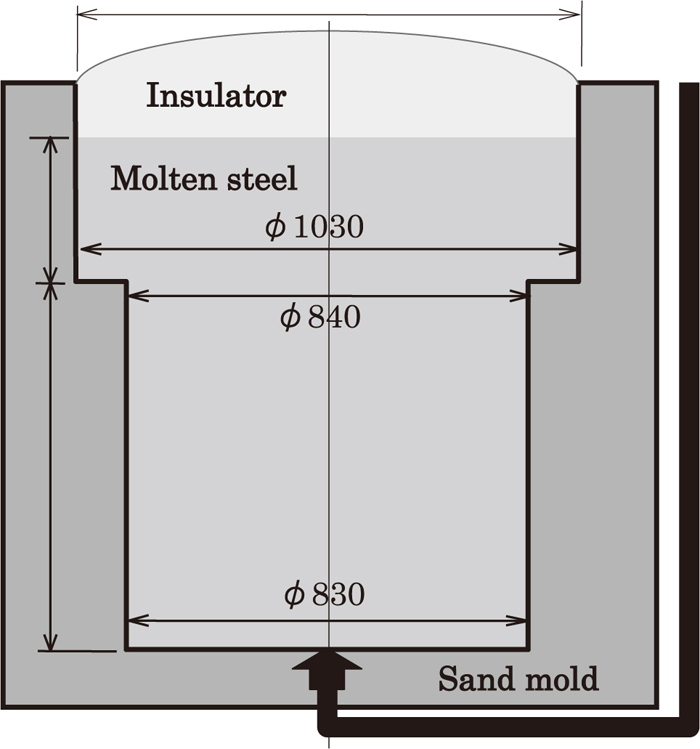
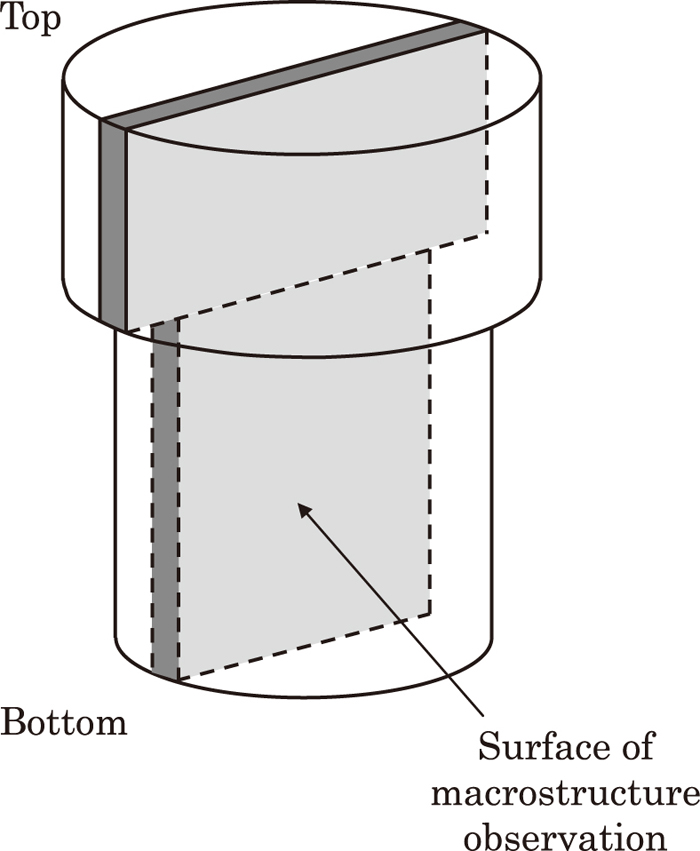
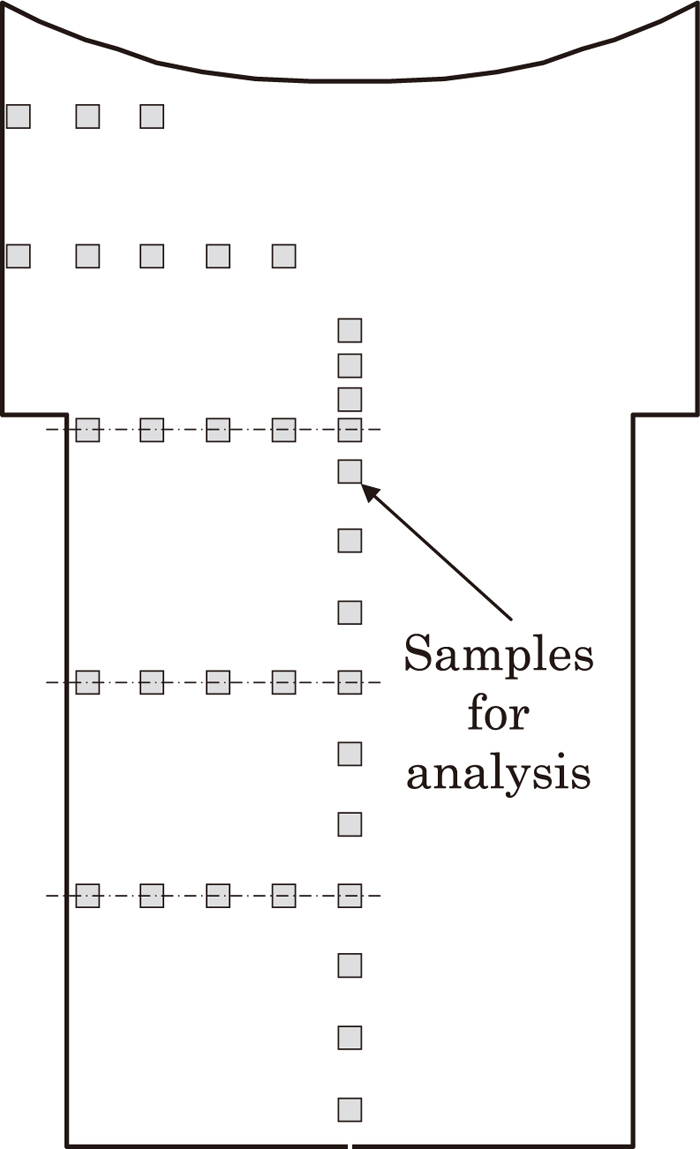
We manufactured sand mold ingot with gross weight 8 ton and cylindrical shape with 1 meter diameter in order to investigate the level of the segregation of chemical composition (especially C segregation) at the center of ingot. Figure 2 shows the cross-sectional shape and the dimensions of the 8 ton sand mold. The manufacture of a sand mold ingot allows simulation of solidification time of a steel mold ingot with 100 ton scale. In regard to the solidified ingot, we observed the macrostructure on the vertical section through the center as shown in Fig. 3, and have analyzed the chemical content at the position shown in Fig. 4. After that we compared and examined macro segregation and the level of segregation of chemical composition with other sand mold ingots of different steels.
3. Results and Discussion
3.1. The Effects of Alloying Elements on the Hardenability
Firstly, we examined the effects of alloying elements on the hardenability. The critical cooling rate as described in Paragraph 2-2 was used as the measure of hardenability. Figure 5 shows the correlation between Ni, Cr, Mn contents on the horizontal axis and the critical cooling rate on the vertical axis. Increase in Ni, Cr, Mn content decreases the critical cooling rate, therefore, it is concluded that the increase of these elements improves hardenability. Also, regarding Si (compare CJ5 and CJ7, and CJ4 and CJ6) and Mo (compare CJ7 and CJ8), it was found that they are also effective in decreasing the critical cooling rate. We researched the decrease of the critical cooling rate per 0.1 mass% of these alloying elements and results are; Ni decreases about 20°C/h, Cr decreases about 2.5°C/h, Mn decreases about 5 to 20°C/h, Si decreases about 0 to 20°C/h, Mo decreases about 10°C/h. The improvement of hardenability from each element in order from biggest to smallest is Ni, Mn, Mo, Si and Cr.
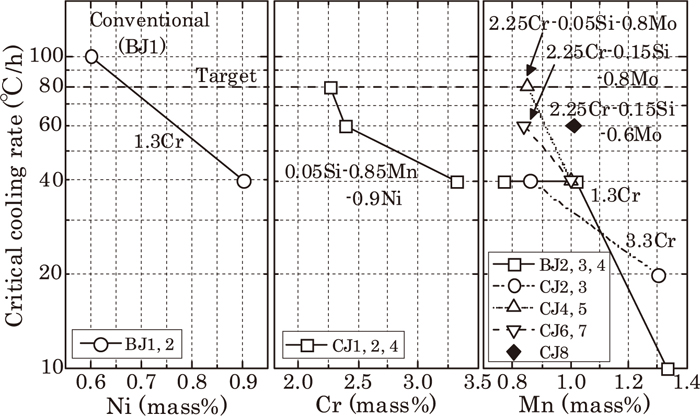
Regarding Cr, despite setting the variation range in samples larger than other elements, it is found that its effect on critical cooling rate is comparatively small. However, more Cr content makes the decrease of the critical cooling rate by increase of Mn smaller.
Considering their adverse effect on corrosion-resistance and slidability, Ni and Cr have limitation to increase, but it is found that it is satisfactory to improve hardenability by adjustment of Mn content.
Previously reported studies for the multiplying factor per alloy element added to pure iron gave factors from biggest to smallest as Mn, Mo, Cr, Si and Ni.14,15) Compared to those studies, in the present test, the effectiveness of Ni is big. It is assumed that Ni acts in the same way as Mn, to reduce A1 transformation temperature by stabilizing austenite phase, and improves hardenability by making the driving factor of transformation from austenite phase (γ) to ferrite phase (α) smaller.
It is also speculated that Mo improves hardenability by concentrating to the interface between different phases on phase transformation and by hindering movement on phase interfaces.
3.2. The Effect of Alloying Elements on Mechanical Properties
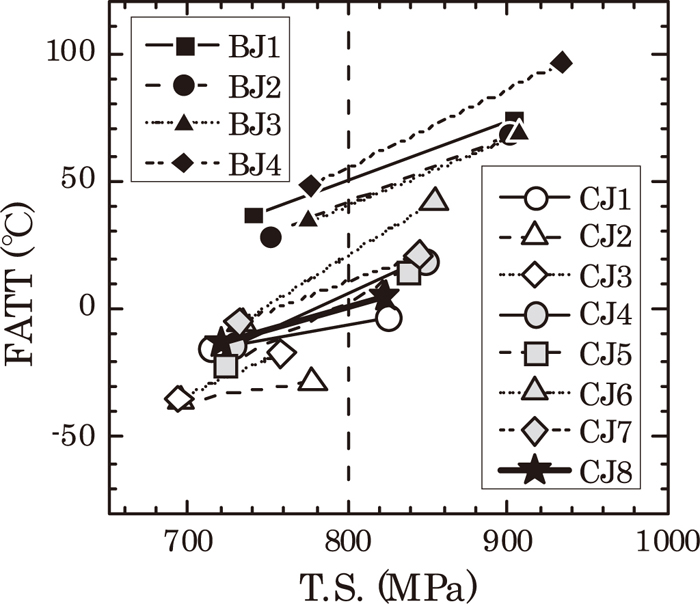
Room temperature tensile test and Charpy impact test were carried out on the experimental materials shown in Tables 1 and 2, with 2 sets of samples – one tempered at 645°C and the other at 675°C. Figure 6 shows the resulting relation between tensile strength and fracture appearance transition temperature (FATT). It is obvious that CJ steels which increased Cr to 2 to 3 mass% have more satisfactory toughness than BJ steels that include conventional geothermal turbine rotor of material (BJ1) with 1.3 mass% Cr. Compared at the same strength level with all the experimental materials, CJ steels have a better balance of strength and toughness. Note that proeutectoid ferrite exists in BJ1, and bainite single phase exists in other experimental materials.
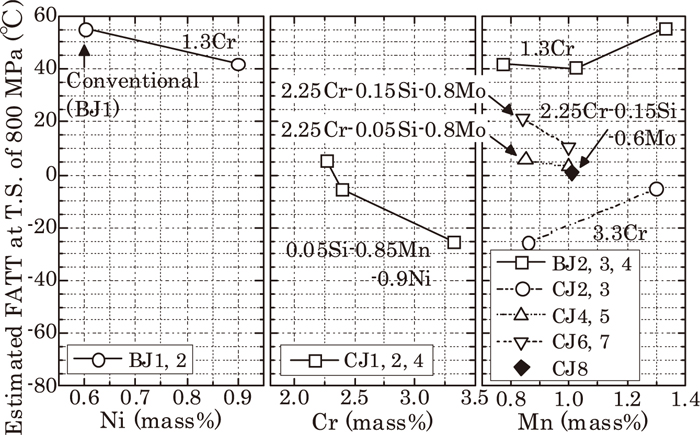
In order to clarify the effect of alloying elements, we have assumed FATT at tensile strength of 800 MPa by interpolation (partially extrapolation), and Fig. 7 shows the result organized by each alloy element’s content. It is obvious that FATT decreases when Ni and Cr increase. Regarding Mn, it sometimes depends on experimental materials, but when Mn is under 1 mass%, its increase makes FATT stay the same or decrease. When Mn is more than 1 mass%, FATT starts increasing.
Table 5 shows the effect of each 0.1 mass% alloy element on FATT. Figure 7 also shows Si (Compare CJ5 and CJ7, and CJ4 and CJ6) and Mo (Compare CJ7 and CJ8). The alloying elements which reduce FATT and improve toughness are Ni, Cr and Mn lower than 1 mass%. In contrast, Si, Mo and Mn more than 1 mass%, increase FATT and make toughness worse.
Table 5. The effect of 0.1 mass% alloy elements for estimated FATT at T.S. of 800 MPa.
| Alloy Elements | Change of FATT |
|---|
| Ni | Decreasing of about 4.5°C |
| Cr | Decreasing of about 2.5°C |
| Si | Increasing of about 10°C |
| Mo | Increasing of about 10°C |
| Mn | 0.8 → 1.0 mass% | Decreasing of about 3°C |
| 1.0 → 1.3 mass% | Increasing of about 5°C |
We have investigated the reasons for the effect of each alloy element on strength and toughness. Cr reduces bainite transformation temperature and improves toughness by making the sub-structure of prior austenite grains refined. Ni is an extremely effective element to improve hardenability, along with Cr, which makes the sub-structure of grains refined, and improves toughness because cross-slip becomes easier. Si improves hardenability, but it is considered that it contributes to solid-solution strengthening and makes carbide grains larger, so that it reduces toughness. Mn improves hardenability the same as Ni, and improves strength and toughness balance, but we conjecture that when its content is more than 1.0 mass%, Mn generates coarse carbide grains and turns to reduce toughness. Mo is also an element to improve hardenability, so it is expected to improve toughness, but in this result, adding Mo unexpectedly reduces toughness. It is assumed this is because Mo addition has increased Mo2C precipitation, which strengthened the material but reduced toughness.
Overviewing the balance between strength and toughness in this paragraph, CJ2 which contains most Cr is the best, but considering restrictive condition of galling characteristics of the turbine rotor bearing part (Cr content is under 3 mass%), CJ1 and CJ8 materials which contain about 2.3 mass%Cr are better.
3.3. The Effect of Alloying Elements on the Resistance of SCC
The SCC experiment followed test method TM0177-Method B of NACE (National Association of Corrosion Engineers) at 24±1.7°C, in H2S saturated solution with 5% of acetic acid, by 3-point bending test method. The experiment is 720 hr maximum. The nominal outer fiber pseudo-stress S (ksi=6.89 MPa) which affects test specimen on 3-point bending test method is calculated as bellow;
|
S (ksi)=6d * E * t/
l
2
| (1) |
d: deflection
E: elastic modulus
t: thickness of test specimen
l: distance between end supports
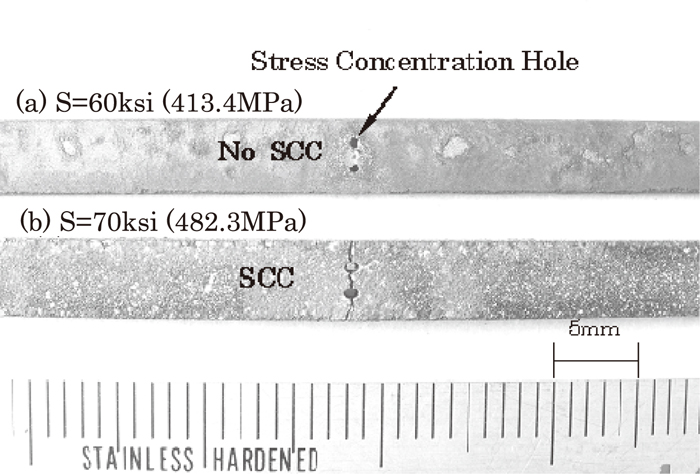
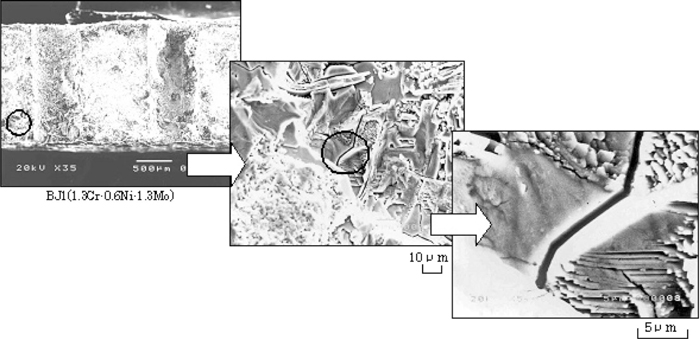
Figure 8 shows examples of the appearance of test specimens after SCC tests. Those are cases when the nominal outer fiber pseudo-stress of specimen CJ1 is (a) 60 ksi (413.4 MPa) and (b) 70 ksi (482.3 MPa). On (b), SCC cracking appeared running through two stress concentration holes. Figure 9 shows the appearance of SCC cracking and fracture surface of specimen BJ1. Intergranular corrosion was observed on the SCC fracture surface.
The resistance to SCC of each specimen has been evaluated with “Sc Value”. Sc Value shows SCC generation limiting stress value, and it is calculated as bellow;
(2)
Sc=(ΣS(psi)/10 000+2ΣT)/n
S: nominal outer fiber pseudo-stress (psi = 10–3ksi= 6.89×10⁻³ MPa)
T: test results (Cracking: +1, No Cracking: –1)
n: number of test specimen
Table 6 shows the test results and calculated Sc Value for each material.
Table 6. SCC test results of tested steels.
| Steels | Hypothetical load stress: S [ksi (6.89 MPa)] | Sc Value |
|---|
| 30 | 40 | 45 | 50 | 55 | 60 | 65 | 70 | 75 | 80 | 85 | 90 | 100 | 110 | 120 |
|---|
| BJ1* (1.3Cr-0.6Ni-1.3Mo) | | | ○ | ○ | ○× | × | × | × | × | × | × | | | | | 5.60 |
| BJ1 (1.3Cr-0.6Ni-1.3Mo) | | ○ | × | ○ | | × × | | × × | | × | | | | | | 4.94 |
| BJ2 (1.3Cr-0.9Ni-1.3Mo) | ○ | ○ | | × | | × | | × × | | × | | | | | | 4.86 |
| CJ1 (2.39Cr-0.9Ni-0.78Mo) | | | | ○ | | ○ | | × | | × | | × × | × | | | 6.85 |
| CJ2 (3.32Cr-0.9Ni-0.79Mo) | | | | | | | | | | ○ | × | ○ | × × | × × | × | 8.94 |
| CJ8 (2.26Cr-0.9Ni-0.61Mo) | | ○ | ○ | ○ | ○ ○ | × | × | × | × | × | | | | | | 5.95 |
○: No Cracking ×: Cracking
Sc Value results have been pigeonholed on Fig. 10 by Cr content in specimen. There is a general tendency that more Cr content makes a larger Sc Value, but more detailed investigation of each material reveals additional details.

There is hardness difference of about 50 in HV (Vickers Hardness) among the specimens provided in this SCC experiment. Among them, we have compared BJ1* and BJ1 which are the same chemical composition. The Sc Value is higher with BJ1* which is lower strength (hardness) than BJ1. In order to examine the effect of Cr content, it is necessary to subtract the effect of hardness on the resistance to SCC. On comparison of BJ1* and BJ1, the Sc Value appears to be higher with the lower hardness sample (BJ1*), and the difference of hardness between BJ1* and BJ1 is ΔHV17. On the other hand, the difference of hardness between CJ1 (2.39 mass%Cr) and CJ2 (3.32 mass%Cr) is ΔHV14, which is smaller than that of BJ1* and BJ1. However, the difference of Sc Value is 3 times larger than that of BJ1* and BJ1. This means, in order to improve the resistance to SCC it is not only important not to raise hardness too high, but also it is clearly effective to increase Cr content.
Regarding Ni content, comparing BJ1 (0.6 mass%Ni) and BJ2 (0.9 mass%Ni), despite BJ1 which contains lower Ni content being a little harder, its Sc Value is slightly higher than BJ2. In regard to the effect of Ni content, if Ni content is higher, it makes pitting corrosion more easily, and it has been reported that SCC occurs more often from pitting corrosion terminal.16) In particular, it has been reported that the generation of SCC is distinguished when Ni content is 1 mass%. These test results also correlate with that report.
Regarding SCC in sulfide environment, it has often been reported that Ni and Mn are harmful.17,18,19) Treseder and Swanson20) have reported that if Ni content is more than 1 mass%, SCC cracking occurs even when Brinell hardness is under HB237. Snape21) has reported that elements which produce good hardenability and high tempering temperature and are also capable of making grains refined, are effective on the resistance to SCC. However Ni reduces A1 transformation temperature so that tempering temperature has to be set beyond A1 transformation temperature and it finally generates bainitic structures which are not sufficiently tempered, therefore, it turns out that SCC sensitivity becomes higher. Considering these reports, it is assumed Mn would also make SCC sensitivity higher in the same way as Ni since it reduces A1 transformation temperature.
In regard to Mo content, comparing CJ1 (0.78 mass%Mo) and CJ8 (0.61 mass%Mo) which contain same content of Cr (2 mass%Cr level), the effect of Mo content cannot be fully evaluated because there is hardness difference (ΔHV10). Mo, however, generates carbide through tempering, so it is considered that it reduces solute C content in matrix and reduces SCC sensitivity.22) Therefore, in this experiment the dominant cause of the Sc Value of CJ1 being larger than that of CJ8 is not only lower hardness but also higher Mo content.
Based on these results, from the point of view of SCC resistance, the best chemical compositions would be CJ1, CJ2, CJ8 which contain large amount of Cr (especially CJ2 with large amount of Cr), but considering the restrictive conditions of galling resistance of the bearing part of the turbine rotor, CJ1 or CJ8 would be the best.
3.4. The Effect of Alloying Elements on Segregation of Chemical Composition in Ingot Center Portion
In sections 3-1 to 3-3 above, we investigated the effect of alloying elements on hardenability using several experimental materials with changed chemical composition , and evaluated the balance of strength and toughness and the resistance to SCC. It was concluded that steels CJ1 and CJ8 were the most suitable material for geothermal turbine rotor. The composition of both of these two steels is 2.3 mass%CrMoV, but the main difference is that compared with CJ1, CJ8 contains more Si from 0.05 mass% to 0.15 mass% and less Mo from 0.8 mass% to 0.6 mass%.
When manufacturing a large-sized ingot for a turbine rotor, it is important to reduce the C-segregation in the center portion of the ingot. C-segregation is affected by the kind of alloying elements and their amounts. Therefore, within the limitations necessary to keep material characteristics of ingot after quality heat treatment, it is possible to adjust the chemical composition to reduce C-segregation. It is known that increasing Si a little which is lighter than Fe and decreasing Mo a little which is heavier than Fe are effective to reduce C-segregation in the center portion of the ingot.23) Therefore this time, we have selected CJ8 material as a potential steel for geothermal turbine rotors, and have manufactured an 8 ton sand mold ingot with this chemical composition.
Figure 11 shows penetrant testing (PT) indication and macrostructure (primary crystal structure) on the vertical section including the center portion of sand mold ingot of gross weight 8 ton. The ingot shrinkage in the center portion of the ingot is distinct, but in the other parts, slight inverted V segregation is visible. The PT indication reveals a few locations of comparatively strong inverted V segregation. The columnar crystals from the wall of the ingot are comparatively few, and many equiaxed crystals are visible all over the vertical section. Figure 12 shows the magnified observation of macrostructure (dendrite structure) and inverted V segregation portion.
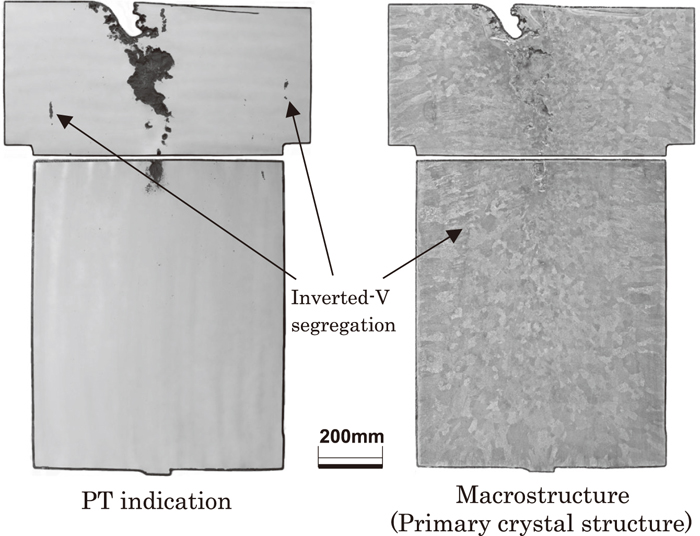
Figure 13 shows the comparison of macrostructure between 1 mass%CrMoV steel which is widely used turbine rotors of conventional thermal power generation or geothermal power generation and CJ8 material (2.3 mass%CrMoV steel). The compared microstructure is from the central vertical section of each 8 ton sand mold ingot. With the solidification process of conventional 1 mass%CrMoV steel, the density difference between solute-enriched liquid which is ejected to the front of solid-liquid interface and bulk liquid is large, and large inverted V segregation is generated, but on developed steel (CJ8 steel), the generated inverted V segregation is narrow and fewer.

This difference is caused by the chemical composition of both steels. In 1 mass%CrMoV steel, solute-enriched liquid generated by solid-liquid distribution during solidification is heavier than the bulk liquid, so that downward type segregation in which solute-enriched liquid moves downward occurs easily. In this case, since concentrated composition accumulates in the ingot center portion, the concentration of alloying elements (especially C) tends to occur from the bottom of the ingot upwards. This causes the concentration (segregation) of chemical composition apparent at the ingot upper portion, and possibly results in concentration beyond the upper limit before the hot top. In contrast, regarding the developed steel (CJ8 steel), the composition is arranged so that the segregation type becomes not downward type, but upward one. More specifically, as described, having material strength and toughness balance, and resistance to SCC secured, Si and Mn which are lighter than Fe are increased and Mo which is heavier than Fe is decreased. Figure 13 shows that the tilt of the inverted V segregations - which are made by solidification direction and the growth direction of segregation - is downward type with 1 mass%CrMoV steel and close to upward type with the developed steel (CJ8 steel).
Figure 14 is the graph showing a comparison of the correlation between C segregation index (check analysis/ladle analysis) along the center axis of 8 ton sand mold ingots and the distance from the bottom of ingot for three kinds of 1 to 3 mass%CrMoV steels. Among them, steel No. 2 is 1 mass%CrMoV steel for thermal turbine rotor and geothermal turbine rotor, steel No. 3 is the developed steel (CJ8), and steel No. 1 is another kind of material.
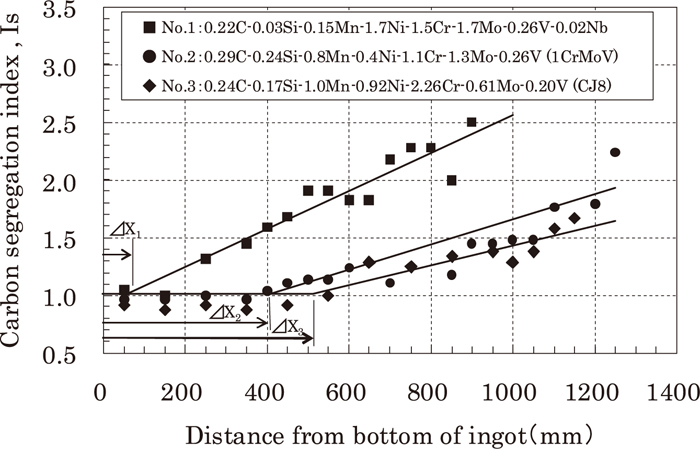
The difference of chemical composition affects the C segregation index at the center axis of each ingot. The big differences among these 3 kinds of steels are the content of Si, Mn, Ni, Cr, and Mo, and addition/no addition of Nb. Inverted V segregation occurs when solidification is much affected by the difference of density of solute-enriched liquid and bulk liquid, where the density of solute-enriched liquid changes according to the atomic weight of alloying elements. Comparing steel No. 1 and steel No. 2, we can see that steel No. 1 contains less Si (atomic weight 28.09) which is very much lighter than Fe (atomic weight 55.85), and contains more Mo (atomic weight 95.94) which is much heavier than Fe, and also contains Nb (atomic weight 92.91) which is also heavier than Fe, compared with steel No. 2, so that the difference of density between solute-rich liquid and bulk liquid seems to be bigger with steel No.1 than steel No. 2. On the other hand, steel No. 3 (developed steel CJ8) contains more Si which is small atomic weight compared with steel No. 1, and contains less Mo which is high atomic weight compared with steel No. 1 and No. 2, and doesn’t contain Nb which is high atomic weight in contrast to steel No. 1. Therefore, as can be seen in Fig. 13, the difference of density between solute-enriched liquid and bulk liquid has become small, and this would explain why solute-rich liquid has turned to be upward type from downward type. So, as the comparison of steels in Fig. 14 shows, when inverted V segregation during solidification tends from being downward to upward type, C concentration start distance (ΔX) at the center axis of ingot becomes longer, and production yield from the ingot with developed steel (CJ8 steel) becomes larger than with the conventional steel.
Based on C concentration along the center axis of the manufactured evaluation 8 ton sand mold ingot with the developed steel (CJ8 steel), we have simulated C concentration along the center axis of 120 ton class ingot of actual machine scale, and have compared it with BJ1 (the conventional steel) which contains 1.3 mass%Cr and CJ4 to CJ8 which contain 2.3 mass%Cr in Fig. 15. As described by Fig. 13, there are differences in concentration levels of C content between BJ1 and CJ4 to CJ8. We have also compared individually among CJ4 to CJ8. CJ4 (0.85 mass%Mn) and CJ5 (1.0 mass%Mn) are about the same. CJ6 (0.14 mass%Si) which contains more Si shows lighter segregation than CJ4 (0.04 mass%Si). There is hardly any difference between CJ6 (0.84 mass%Mn) and CJ7 (1.0 mass%Mn). CJ8 (0.6 mass%Mo) which contains less Mo shows much lower segregation than CJ7 (0.8 mass%Mo). From the above, among steels which contain 2.3 mass%Cr, CJ8 which contains slightly more Si content and less Mo content stands out also from the point of view of reduction of C segregation.