Regular Article
Desulphurisation and Inclusion Behaviour of Stainless Steel Refining by Using CaO–Al2O3 Based Slag at Low Sulphur Levels
2014 Volume 54 Issue 1 Pages 72-81
Details
2014 Volume 54 Issue 1 Pages 72-81
The deep desulphurisation behaviour and steel cleanliness of stainless steel refining in the low sulphur content period (below 45 ppm [%S]) by using the current lime-fluorspar based slag and an optimized lime-alumina slag have been studied and compared. The desulphurisation effect was discussed based on the calculated sulphide capacity of slags and the equilibrated sulphur distribution ratio between the slag and steel. The sulphur evolution during the treatment was predicted with a previously developed kinetic model. The influence of slag chemistry on the compositional evolution of the steel and inclusions was discussed through thermodynamic considerations with respect to deoxidation and desulphurisation reactions. The sulphur content in the inclusions was predicted using the dissolved sulphur in the steel and their oxide chemistry. An equivalent steel cleanliness and desulphurisation effect was obtained with lime-alumina based slag as with lime-fluorspar based slag both in laboratory and industrial tests for low sulphur content stainless refining.
Non-metallic inclusions and their characteristics, i.e. number density, size distribution, morphology and chemistry, have a complex impact on stainless steel properties. For instance, inclusions with high number density and large size can shorten the bearing and fatigue life of steel products.1,2) Oxide inclusions, e.g. Al2O3, SiO2 and TiO2 with irregular, dendritic and clustered morphology have more detrimental effects.3,4) These detrimental effects can be reduced by coating the inclusions with a soft, low melting temperature layer, which normally consists of MnS.4,5) The presence of sulphur can also ensure adequate weld penetration of stainless steel and therefore improve its performance.6) On the other hand, sulphides can induce pitting corrosion and weaken the corrosion resistance of stainless steel.2,3,4,5) To utilize the beneficial effects of the sulphide inclusions and to depress their detrimental effects, it is essential to control the sulphur content and sulphides formation in stainless steel production.
Ladle refining plays a crucial role on impurities removal and steel cleanliness control in modern steelmaking. Nowadays, a CaO–CaF2–SiO2 (CSF) based top slag is being currently used to quickly remove sulphur and inclusions from liquid steel.7,8,9) However, the valorisation of this slag poses a tough challenge because of its disintegration in the post-metallurgical process.10) The CaO–Al2O3 (CA) based top slag, due to excellent refining and valorisation properties,11) has been considered as a potential substitute. In the first phase of our studies,12,13) the desulphurisation of stainless steel with 150 ppm initial S by using the current CSF slag and various CA based slags has been performed to prove the concept of substitution. An equivalent desulphurisation efficiency, e.g. a comparable sulphur distribution ratio between slag and steel, and a similar final sulphur level (30–50 ppm) in the steel was obtained with an optimized CA based synthetic slag (with 50% CaO, 40.4% Al2O3, 4.3% SiO2, 2.1% Fe2O3, 1.7% TiO2 and 0.6% MgO) as compared with the current CSF slag. The use of the optimized CA based slag also resulted in an improved steel cleanliness, e.g. lower inclusion number density, smaller size and fraction area and less sulphide inclusion formation. We, therefore, concluded that the proof-of-concept of using the CA based slag for stainless steel ladle refining has been achieved.
In order to make the substitution industrially possible, further investigations, i.e. laboratory simulation and plant test with practical conditions are needed. After the AOD process, the liquid steel usually contains 30–50 ppm sulphur and is treated in a ladle furnace. Large amount of alloys, which contain considerable sulphur content are added in liquid steel during the treatment. Top slag is therefore used to remove/control the sulphur level. This so-called deep desulphurisation is essential for producing low sulphur stainless steel products, and it is highly sensitive to the secondary refining (ladle treatment) conditions, i.e. the deoxidation and reoxidation of liquid steel, the melting rate and the kinetic conditions of slag. In this context, deep desulphurisation of stainless steel was studied based on laboratory scale under industrial conditions (i.e. 30–45 ppm initial sulphur content and doloma refractory crucible) and plant scale by using the current CSF and the optimized CA synthetic slags. The application feasibility of the optimized CA synthetic slags in ladle treatment of stainless steel is discussed. Specific attention has been given to the desulphurisation behaviour and steel cleanliness.
To simulate the secondary stainless steel refining process, austenitic stainless steel ingots were collected after the AOD process from a steel plant and used in the laboratory experiments. Tables 1 and 2 respectively show the chemical composition of the steel ingot and the top slags used in the tests. The CSF slag, a mixture of lime (containing 97% CaO, 1.5% SiO2 and 1.5% MgO) and fluorspar (containing 92.3% CaF2, 2.6% CaO and 5.1% SiO2), is being currently used during ladle treatment in the stainless steel plant. The CA slag is the optimized CaO–Al2O3 based synthetic slag, which contains small amount of SiO2, Fe2O3, MgO and TiO2 as additives.
| C | Mn | P | S | Si | Cr | Ni | Mo | Cu | Ti | Co |
|---|---|---|---|---|---|---|---|---|---|---|
| 0.03 | 1.0 | 0.03 | 0.0030–0.0045 | 0.30 | 16.9 | 7.0 | 0.28 | 0.36 | 0.001 | 0.16 |
* C and S were measured with LECO combustion analysis, and other elements were measured with inductively coupled plasma atomic emission spectroscopy (ICP-AES).
The experiments were performed in a vacuum induction furnace (type VSG 30, 60 kW power supply and 4 kHz frequency). The details of the experimental set-up have been given elsewhere.12,13) The experimental procedure and conditions are shown in Fig. 1 and Table 2, respectively. Fifteen kilograms of austenitic stainless steel ingot were melted under Ar atmosphere in a crucible with an inner diameter of 150 mm, outer diameter of 176 mm and the height of 275 mm. Here, the crucible was made with doloma bricks, which is being used in the industrial ladle as refractory material. The temperature of molten steel was controlled around 1650°C. Thereafter, the oxygen activity and temperature of the molten steel were measured with a Celox oxygen sensor with type B thermocouple probes (provided by Heraeus Electro-Nite). Subsequently, a steel sample in conical shape (the upper diameter is 20 mm, lower diameter is 10 mm and the height is from 16 to 25 mm) was taken by dipping the spoon sampler into the molten bath and rapidly withdrawing it, followed by quenching in air. 150 g slag was added to the molten steel through the loading chamber; meanwhile 75 g FeSi alloy was added to molten steel in Tests 1-2, while 3 g Al was added in Tests 3-4. The slags were added in 4 steps in amounts of 150 g each and in total 5 steel samples were taken according to the scheme as shown in Fig. 1. At the end of the test, the oxygen activity and temperature of the molten steel were measured, and then the melt was poured into a mould. The slag sample was collected after the mould was cooled down.

Experimental procedure of laboratory test.
| Test | [S] in steel (ppm) | Slag type | Chemical composition (wt%) | Alloy addition (g) | |||||||
|---|---|---|---|---|---|---|---|---|---|---|---|
| CaO | Al2O3 | Fe2O3 | SiO2 | MgO | TiO2 | CaF2 | FeSi | Al | |||
| 1 | 43 | CSF | 77.9 | – | – | 6.8 | 1.2 | – | 14.1 | 75 | 0 |
| 2 | 27 | ||||||||||
| 3 | 43 | CA | 50.0 | 40.4 | 2.1 | 4.3 | 0.6 | 1.7 | – | 0 | 3 |
| 4 | 28 | ||||||||||
* Measured with X-ray fluorescence spectrometer (XRF).
After scrap smelting in the EAF and decarburization in the AOD process, liquid melts (120 ton) were tapped into a ladle where the AOD slag was removed. Top slag and deoxidizer were then added during the ladle treatment, followed by alloying and scrap addition depending on the specification of steel grade. Thereafter, the liquid steel was prepared for casting. The composition and addition of alloy elements are listed in Table 3. It should be noted that a relatively larger amount of CA slag addition in Test 6 was due to the fact that (1) the high initial sulphur content in molten steel (i.e. 43 ppm) and (2) the high sulphur content introduced by alloy addition, i.e. 0.13 kg sulphur introduced in Test 6 as compared to 0.05 kg in Test 5. Taking into account the initial steel sulphur content and sulphur pick-up during alloying, the required slag addition quantity was calculated based on the Lab experimental results to reach a necessary desulphurization level. Steel samples were taken at different stage of the ladle treatment (Fig. 2), viz. (1) after deslagging (AOD slag); (2) after top slag addition; (3) just prior to sending the ladle to the caster.
| Test | Slag | Addition (kg) | T.S (ppm) | |||||
|---|---|---|---|---|---|---|---|---|
| Type | Amount (kg) | FeMnSi | FeTi | FeMo | FeMnSi | FeTi | FeMo | |
| 5 | CSF | 1600 | 266 | 15 | – | 164 | 221 | 614 |
| 6 | CA | 2200 | 90 | 11 | 191 | |||
* T.S measured with LECO combustion analysis.
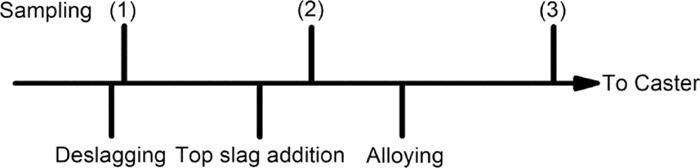
Sampling procedure of industrial test.
The steel samples obtained during the tests were cut into three parts. The first part of the steel sample was used for total sulphur measurement with a LECO combustion analysis (type CS-444). The detailed method for total sulphur analysis in steel and that for slag have been already explained elsewhere.12,13) The second part of the steel sample was prepared for inclusion characterization, which was conducted with a high resolution scanning electron microscope (FEI XL-40 LaB6). The SEM was equipped with an EDAX energy dispersive spectrometer (EDS) detector and NSS feature software.13) The latter can be used to perform automatic inclusion analysis (AIA). The maximum working magnification was set to 1000 and the effective minimum detectable inclusion area was about 0.5 μm2. The third part of the steel sample was used for inclusion morphology assessment by the inclusion extraction technique,13) as well as for steel composition assessment using inductively coupled plasma atomic emission spectroscopy (ICP-AES, Varian Liberty series II instrument with an axial plasma configuration).
The sulphur content in steel and slag samples, as well as the sulphur distribution ratio between the slag and steel, i.e. LS=(%S)/[%S] are listed in Table 4. Figure 3 shows the evolution of sulphur content in molten steel as a function of time after the slag addition. It can be seen from Fig. 3(a) (lab scale) that (1) sulphur was continuously removed during the treatment, indicating the desulphurisation effect of both CSF and CA slags; (2) sulphur removal was fast in the early stage, then dropped slowly or levelled off, showing the difficulty of deep desulphurisation; (3) a relatively lower final sulphur content was obtained in the tests with low initial sulphur content. Figure 3(b) (plant scale) shows the comparison of desulphurisation effect by using the current CSF and the optimized CA slag in an industrial ladle treatment. It can be seen that (1) sulphur was also quickly removed after the top slag addition; (2) alloying and scrap addition resulted in a considerable resulphurisation of liquid steel. This is due to the high sulphur content in alloying elements (Table 3); (3) a similar level of sulphur content was achieved by using CSF and CA slag at the end of the treatment.
| Sample No. | Slag type | Time after slag addition (min) | [S] (ppm) | (S) (ppm) | a[O] (ppm) | Temp. (°C) | LS |
|---|---|---|---|---|---|---|---|
| T1-1 | CSF | 0 | 43 | 0 | 37 | 1655 | |
| T1-2 | 15 | 20 | |||||
| T1-3 | 30 | 13 | |||||
| T1-4 | 40 | 7 | |||||
| T1-5 | 55 | 5 | 1053 | 62 | 1656 | 211 | |
| T2-1 | CSF | 0 | 27 | 0 | 22 | 1638 | |
| T2-2 | 15 | 14 | |||||
| T2-3 | 30 | 5 | |||||
| T2-4 | 45 | 4 | |||||
| T2-5 | 55 | 4 | 552 | 18 | 1641 | 138 | |
| T3-1 | CA | 0 | 43 | 444 | 22 | 1649 | |
| T3-2 | 14 | 35 | |||||
| T3-3 | 24 | 29 | |||||
| T3-4 | 37 | 18 | |||||
| T3-5 | 49 | 16 | 951 | 15 | 1630 | 59 | |
| T4-1 | CA | 0 | 28 | 444 | 14 | 1645 | |
| T4-2 | 19 | 17 | |||||
| T4-3 | 34 | 11 | |||||
| T4-4 | 44 | 8 | |||||
| T4-5 | 54 | 7 | 949 | 14 | 1635 | 136 | |
| T5-1 | CSF | 0 | 33 | 1665 | |||
| T5-2 | 15 | 28 | |||||
| T5-3 | 55 | 41 | 1570 | ||||
| T6-1 | CA | 0 | 43 | 1642 | |||
| T6-2 | 15 | 29 | |||||
| T6-3 | 55 | 34 | 1570 |
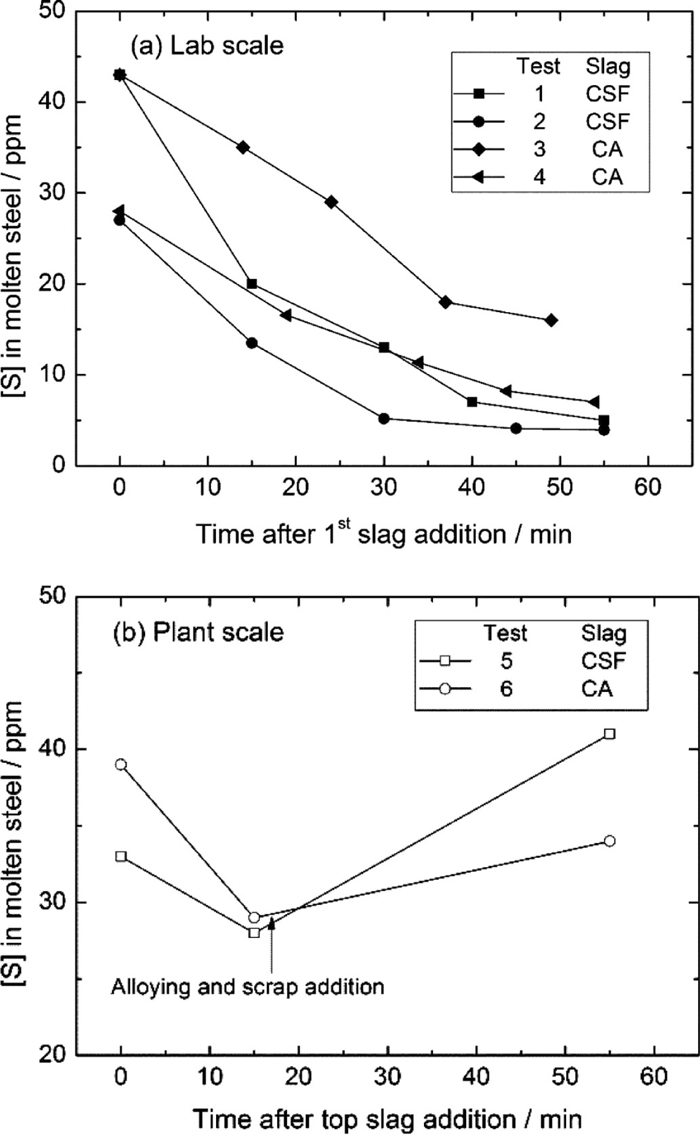
The evolution of [S] in molten steel as a function of time after slag addition: (a) laboratory experiment and (b) plant scale experiment.
The relation between sulphur distribution ratios, viz. the mass balance ratio (

The relation between the measured sulphur distribution ratio and mass balance values.
From the above desulphurisation results (i.e. Fig. 3 and Table 4), it can be concluded that a better desulphurisation effect, i.e. lower final sulphur content and higher LS were achieved with CSF based slag. A slightly worse desulphurisation result was obtained with CA slags on laboratory test (Tests 2 and 4 in Fig. 3(a)), while a comparable results were still achieved on plant scale test (Tests 5 and 6 in Fig. 3(b)). In order to understand this difference of deep desulphurisation effect with distinct slag chemistry better, the desulphurisation thermodynamics need to be discussed.
3.1.2. Desulphurisation ThermodynamicsSulphide capacity (CS), a function of slag chemistry and experimental temperature (Eq. (1)),14,15) is used to describe the sulphur absorption capability of slags. Since the sulphide capacity of a slag is only related with the slag chemistry and temperature, it can be calculated with the aid of FactSage software by using the experimental results (Tables 3, 4, 5). The detailed calculation method has been already described elsewhere.12) The calculated sulphide capacity values (CS) for the initial and the final slags are listed in Table 6. It can be seen that the sulphide capacity of CSF slag is much higher than that of CA slag; additionally, a decrease in slag sulphide capacity was found after the tests. The former is resulting from the high CaO content in the CSF slag (Table 5), providing a large amount of free oxygen ions (O2–) for the desulphurisation reaction between steel and slag (reaction (2)). While the later implies that the desulphurisation capability of the slags decreased as the reaction proceeds. This is because of the Si oxidation, resulting in an increase of SiO2 content in slag, which combines with the free oxygen ions (O2–) to form
| (1) |
| (2) |
| (3) |
| Test No. | Slag type | CaO | SiO2 | MgO | Al2O3 | Cr2O3 | Fe2O3 | MnO | CaF2 |
|---|---|---|---|---|---|---|---|---|---|
| 1 | CSF | 48.8 | 18.2 | 12.0 | 9.7 | – | – | – | 10.6 |
| 2 | 51.9 | 14.3 | 10.5 | 10.1 | – | – | – | 13.7 | |
| 3 | CA | 41.7 | 10.8 | 7.1 | 35.9 | 0.8 | 1.3 | 0.4 | – |
| 4 | 46.1 | 6.7 | 6.8 | 36.5 | 0.8 | 1.4 | 0.1 | – |
| Slag type | CAF | CA | ||
|---|---|---|---|---|
| Test No. | 1 | 2 | 3 | 4 |
| Initial slag | 1.5×10⁻² | 1.5×10⁻² | 2.8×10⁻³ | 2.7×10⁻³ |
| Final slag | 1.0×10⁻² | 1.4×10⁻² | 1.2×10⁻³ | 2.7×10⁻³ |
Figure 5 shows the relation between the measured sulphur distribution (LS) and the calculated CS. Although scatter is found in Fig. 5, the data points follow approximately a straight line with slope of 1, implying the sulphur distribution ratio was mainly influenced by the sulphide capacity of the slag. This can be understood by the equilibrated sulphur distribution ratio between slag and steel (Eq. (4)), which is obtained by relating the slag sulphide capacity (Eq. (1)) with the desulphurisation reactions (2) and (5).15)
| (4) |
| (5) |
| (6) |
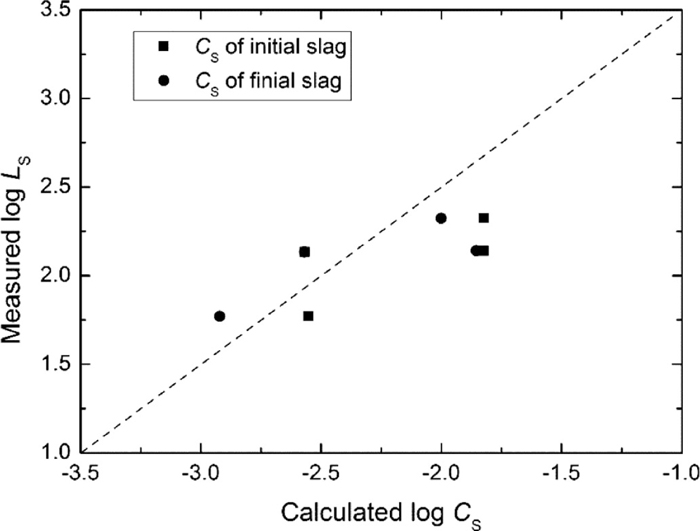
Relation between the measured sulphur distribution ratio LS and the calculated sulphide capacity CS.
| j | i | |||||
|---|---|---|---|---|---|---|
| O | Si | Cr | Mn | S | Al | |
| S | 0.27 | 0.065 | 0.01 | –0.025 | –0.028 | – |
| Al | –34740/T+11.95 | 0.056 | 0.0096 | 0.035 | – | 0.044 |
| Si | –0.119 | 0.103 | – | 0.033 | – | 0.058 |
| Mn | –0.083 | – | 0.0042 | – | – | – |
It can be seen from Eq. (4) that under thermodynamic equilibrium conditions the calculated log LS and log CS have a linear relation with the slope of 1, which was verified in the present work as shown in Fig. 5. In addition to the slag CS, which depends on slag chemistry and operation temperature, other parameters, such as steel chemistry also have a complex influence on sulphur distribution ratio due to their effect on the sulphur and oxygen activities in molten steel (Eq. (6)). By using the measured slag chemistry, steel chemistry and experimental temperature, the equilibrated LS can be calculated through Eq. (4).
Figure 6 shows comparison of the measured LS and the calculated equilibrated LS, in which the solid squares are obtained by using the chemistry of the initial slags and the solid circle by that of the final slags. The data points are more close to the one by one relation (dash line) when using the chemistry of the final slags than that of initial slags, implying that the slag-steel interaction with respect to desulphurisation was approaching the equilibration during the treatment. In the end of the experiment, however, the calculated equilibrated LS values are still larger than the measured values, meaning the desulphurisation equilibrium between slag and steel has not been reached. Therefore, the desulphurisation capacity of the slag had not been fully utilized during the treatment. In other words, the desulphurisation effect can be improved by using the present slags if kinetics allows.

Comparison between the measured LS and calculated equilibrated LS.
A kinetic model for the stainless steel desulphurisation has been developed in our previous work12) based on the two film theory.20) In the kinetic model, the dissolved sulphur was assumed to be removed by the slag through ion exchange, viz. O2– and S2– at the slag/steel interface and the sulphur transfer from the interface towards slag phase was considered to be the rate-limiting step. The desulphurisation kinetics can be expressed as follow:
| (7) |
| Test | slag | LS | ρ (g/cm3) | A (m2) | k (m/s) | [S]° (ppm) |
|---|---|---|---|---|---|---|
| 1 | CSF | 721 | 2.80 | 4.4×10⁻³ | 1.2×10⁻⁶ | 45 |
| 2 | CSF | 800 | 27 | |||
| 3 | CA | 300 | 43 | |||
| 4 | CA | 450 | 28 |
Figure 7 shows the comparison between the calculated and experimental data. The good agreement between calculated and measured sulphur evolutions shows a promising application of this model in practice. It can be seen from Table 7 and Fig. 7 that: (1) for the same slag, a lower initial sulphur content in the steel and a high equilibrated sulphur distribution ratio between slag and steel resulted in a better desulphurisation effect (see the comparison between Tests 1 and 2 and that between Tests 3 and 4). This is apparently due to the influence of the thermodynamic driving force on the desulphurisation reaction; (2) for a given test, the desulphurisation rate (i.e. slope of the calculated curve in Fig. 7) decreases with decreasing sulphur content in the steel. This is more obvious for the tests with CSF slag (Tests 1 and 2); (3) with a similar initial sulphur content in the steel and mass transfer coefficient of sulphur in the slag phase, the CSF (Tests 1 and 2) slag shows a relatively better desulphurisation effect than the CA slag. However, comparable final sulphur content and sulphur removal speed (i.e. Test 4) were still achieved with the synthetic CA slag as with the CSF slag in case of a low initial sulphur content condition (see results of Tests 2 and 4 in Fig. 7). Based on the results of both the industrial and laboratory tests, it can be concluded that the present synthetic CA slag is feasible for the low sulphur stainless steel refining process. (4) the fitted mass transfer coefficients of sulphur in slag phase is 1.2 × 10⁻⁶ m/s, which is in the same order of magnitude obtained by other researchers,8,12,21) suggesting the reliability of the present kinetic model.
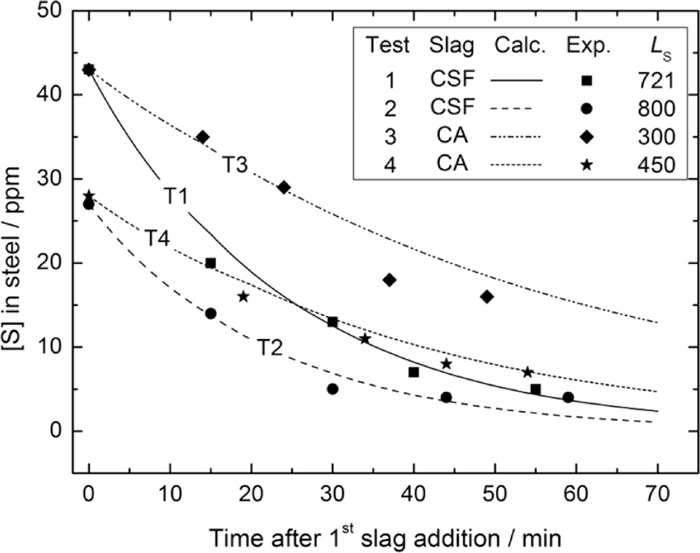
Experimental and modelling results for the [S] evolution during treatment.
The steel cleanliness with respect to inclusion population and chemistry are measured with SEM-AIA technique. The upper part of Fig. 8 shows the evolution of the inclusion size after the slag addition. For a given test, there is no considerable change in the average inclusion size, and no significant effect of the slag chemistry on inclusion size evolution was observed, while the maximum size of inclusions are found to be decreased during the treatment. The latter is attributed to the flotation of large inclusions. The evolution of inclusion area fraction, i.e. F.A., during the treatment is shown in the lower part of Fig. 8, where F.A. represents the inclusion area fraction, which is the ratio of the observed area of inclusions to the measured area of steel matrix. It decreased in all the laboratory tests (Fig. 8(a)), while it slightly increased in the industrial treatment. The former shows that the inclusion flotation and absorption occurred with all types of slag, and the latter is the consequence of slag entrapment and reoxidation due to strong stirring and alloying operation. Similar inclusion area fractions were obtained in the final steel samples by using CSF and CA slags both in laboratory and industrial scale.
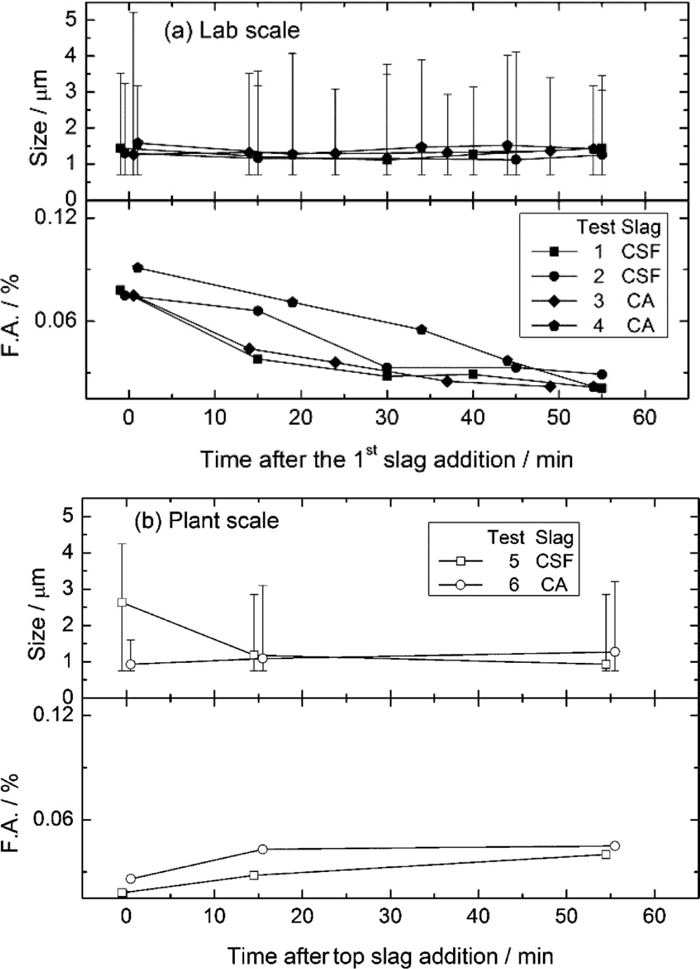
The evolution of inclusion size and area fraction (F.A.) as a function of treatment time.
Figure 9 shows the population density functions (PDF) of inclusions, which is obtained by dividing the frequency of inclusions in a given bin (inclusion number per area) with the bin width.22) No considerable difference can be found between PDFs of final samples, indicating that a similar inclusion size distribution is obtained with CA and CSF slags. The PDF curves calculated with experimental data (based on probability density function) in Fig. 9 are approximately quadratic, suggesting that the size distribution can be represented with log-normal PDFs. On the basis of the analysed results of inclusion size, area fraction and size distribution, it can be concluded that an equivalent steel cleanliness was obtained with the optimized CA as with CSF based slag.

Inclusion size distribution determined with the SEM-AIA technique for the final steel samples.
Figure 10 shows a typical evolution of the inclusions during the treatment of Test 4. The SiO2–MnO–Cr2O3 complex inclusions in spherical and angular shape are already present in the steel before the treatment (Fig. 10(a)). Apparently, they are the result of a reduction operation at the end of AOD process, where FeSi is added to recover Cr from high chromium oxides containing slag. Small holes can be found on these original inclusions, which are probably due to the MnS dissolution during the inclusions extraction.13) Al2O3 based inclusions with plate-like shape are formed after the slag and alloy addition, while the spherical inclusions containing Al2O3–SiO2–MnO can still be observed in the samples (Fig. 10(b)). Pure Al2O3 inclusions in octahedral shape and a small amount of Al2O3–MgO spinel were observed in the final samples (Fig. 10(c)). This evolution of inclusions during the experiment is believed to be the result of the slag-steel-refractory-inclusions interaction.
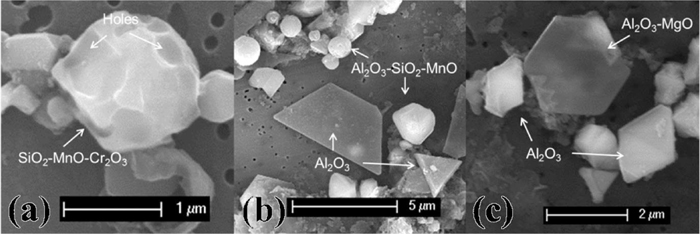
The inclusion morphology evolution in Test 4: (a) before the slag and alloy addition, (b) during the treatment and (c) at end of the treatment.
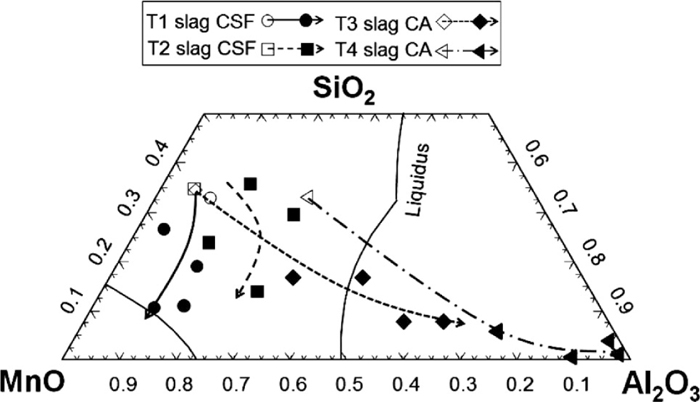
For each steel sample, at least 100 inclusions were measured with the SEM-AIA and the average composition was then obtained. Since the oxygen content in the oxysulphide inclusions is not directly measured with EDS, it is assumed that all measured Si, Al and Cr are in the form of SiO2, Al2O3 and Cr2O3, respectively. All S in the oxysulphide inclusions is assumed to form MnS first. The remaining Mn content after the formation of MnS is considered to be in the form of MnO. Table 9 shows the analysed composition of inclusions and that of steel samples (with ICP-AES), in which the symbol of [ ] denotes the dissolved element in molten steel. The compositional evolution of inclusions during the treatment is illustrated in Fig. 11. In order to fix the inclusion evolution into a ternary diagram (Al2O3, SiO2 and MnO), the Cr2O3 is not taken into account, small amount compounds like MgO and MnS are also not presented.
| Time (min) | Element content | Inclusion | |||||||||
|---|---|---|---|---|---|---|---|---|---|---|---|
| [Al] | [Si] | [Mn] | [Cr] | MgO | Al2O3 | SiO2 | MnO | Cr2O3 | MnS | ||
| T1-1 | 0 | – | 0.30 | 0.99 | 14.0 | 0.1 | 7.2 | 24.5 | 42.8 | 16.1 | 6.7 |
| T1-2 | 15 | – | 0.24 | 0.97 | 14.0 | 0.0 | 3.5 | 20.1 | 51.9 | 12.6 | 6.2 |
| T1-3 | 30 | – | 0.2 | 1.00 | 13.9 | 0.9 | 8.9 | 12.0 | 42.2 | 23.2 | 2.9 |
| T1-4 | 40 | – | 0.17 | 0.98 | 13.9 | 6.0 | 10.5 | 6.6 | 47.2 | 22.9 | 0.0 |
| T1-5 | 55 | – | 0.14 | 0.99 | 13.9 | 1.0 | 7.9 | 7.6 | 56.7 | 22.4 | 1.1 |
| T2-1 | 0 | – | 0.29 | 0.72 | 18.3 | 0.0 | 4.6 | 27.2 | 46.6 | 19.1 | 2.3 |
| T2-2 | 15 | 0.002 | 0.25 | 0.72 | 18.2 | 0.0 | 11.5 | 26.8 | 37.0 | 22.6 | 1.4 |
| T2-3 | 30 | 0.002 | 0.21 | 0.71 | 18.2 | 6.9 | 16.1 | 18.2 | 27.5 | 29.3 | 0.9 |
| T2-4 | 45 | 0.001 | 0.20 | 0.69 | 17.9 | 1.7 | 17.2 | 8.7 | 36.7 | 34.9 | 0.3 |
| T2-5 | 55 | – | 0.17 | 0.71 | 18.2 | 0.6 | 9.2 | 15.6 | 41.0 | 30.4 | 0.6 |
| T3-1 | 0 | – | 0.33 | 1.17 | 16.5 | 0.2 | 4.3 | 24.1 | 41.3 | 12.6 | 12.4 |
| T3-2 | 14 | 0.002 | 0.31 | 1.16 | 16.4 | 0.9 | 22.9 | 11.9 | 36.2 | 16.2 | 4.9 |
| T3-3 | 24 | 0.003 | 0.28 | 1.13 | 16.5 | 1.3 | 31.7 | 11.9 | 27.5 | 18.0 | 2.5 |
| T3-4 | 37 | 0.003 | 0.28 | 1.17 | 16.5 | 0.9 | 34.7 | 4.8 | 22.3 | 22.3 | 4.2 |
| T3-5 | 49 | 0.003 | 0.26 | 1.16 | 16.6 | 1.9 | 47.2 | 5.8 | 21.6 | 12.3 | 3.3 |
| T4-1 | 0 | 0.002 | 0.31 | 0.45 | 18.3 | 0.0 | 20.2 | 24.5 | 30.6 | 18.3 | 2.4 |
| T4-2 | 19 | 0.005 | 0.28 | 0.42 | 18.1 | 3.1 | 52.7 | 3.9 | 14.3 | 22.8 | 0.0 |
| T4-3 | 34 | 0.005 | 0.28 | 0.41 | 18.2 | 4.3 | 69.9 | 0.1 | 6.3 | 16.2 | 0.0 |
| T4-4 | 44 | 0.006 | 0.26 | 0.41 | 18.2 | 8.7 | 67.2 | 2.0 | 1.4 | 19.3 | 0.0 |
| T4-5 | 54 | 0.006 | 0.25 | 0.40 | 18.2 | 8.2 | 69.1 | 0.9 | 0.9 | 20.5 | 0.0 |
The compositional evolution of inclusions during the treatment at 1650°C (wt%).
It can be seen from Table 9 and Fig. 11 that: (1) the original inclusions were mainly in the form of MnO–SiO2–Cr2O3–MnS, apparently this is the result of the reduction operation at the end of AOD process; (2) after the slag and alloy additions (FeSi and/or Al), Al2O3 content in the inclusions rapidly increases with an accompanying decrease in SiO2 and MnO content in the tests with the CA slag and 3 g Al additions (Tests 3-4), while in the tests with the CSF slag and no Al additions (Tests 1-2) a small rise in Al2O3 content is observed at the early stage and then the Al2O3 content levels off followed by a small decrease. This compositional evolution of inclusions suggests that the original inclusions are reduced by aluminium through the reaction (8), leading to a considerable increase in Al2O3 content. The less obvious increase of Al2O3 content in the tests with the CSF slag (Tests 1 and 2 in Fig. 11) is a result of a small input of Al (from FeSi alloy); (3) In the end of the treatment, the inclusions contain mainly Al2O3–SiO2–MnO–Cr2O3 with low MnS content (Table 9). According to the thermodynamic calculation, these inclusions would be saturated with corundum phase (mainly Cr2O3) at the experimental temperature; (4) minor levels of MgO are detected in the inclusions in all the tests, probably due to the slag-steel-refractory-inclusions interaction.
| (8) |
Since the top slag has considerable impact on the steel chemistry through the desulphurisation and deoxidation reaction, and the molten steel directly reacts with inclusions, an improved understanding of the thermodynamics and kinetics of the slag-steel-inclusions interaction is of significant importance for inclusion chemistry control during ladle treatment.
3.2.2. Thermodynamics of the Slag-steel-inclusions Interaction 3.2.2.1. Slag-steel InteractionThe FeSi and Al were added during the treatment for alloying and deoxidation purposes, thus the deoxidation reaction with respect to Al and Si are mainly considered for the slag-steel reactions. These reactions can be expressed as follows:17,23)
| (9) |
| (10) |
| (11) |
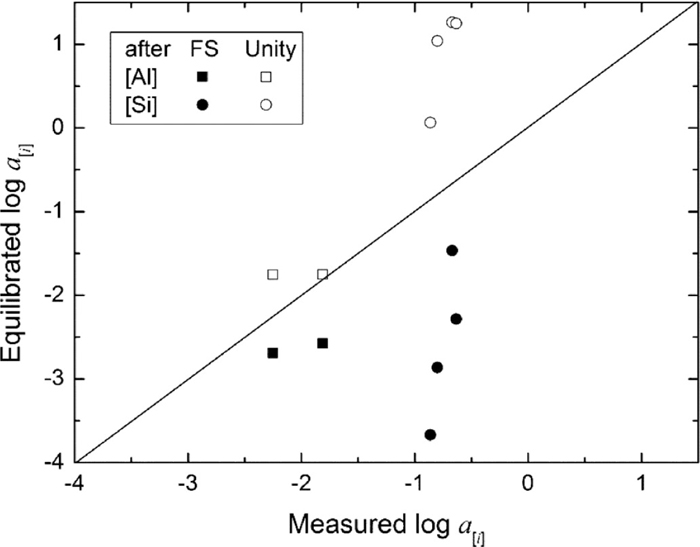
The comparison of calculated and measured activity of [Al] and [Si], where FS and Unity represent equilibration with top slag and pure oxides, respectively.
A comparison of the measured activities (a[Al] and a[Si]) with the equilibrated values is given in Fig. 12. The equilibrated activities are assumed to be equilibrated with the top slag and pure oxide, i.e. Al2O3 and SiO2, respectively. It is clear that the measured values (a[Al] and a[Si]) are larger than the equilibrated values when steel is assumed to be equilibrated with the top slag, while the measured values are lower than the calculations with the oxides saturated slag. This is more obvious for the Si deoxidation reaction, i.e. Si activity in molten steel is far removed from the equilibrium both with top slag and pure SiO2. Figure 12 shows: (1) the slag-steel interaction did not reach equilibrium during the treatment; (2) the reactions can proceed to increase the oxides (Al2O3 and SiO2) content in the slag and cease before the slag has been saturated with them if a longer slag-steel interaction is allowed. The later agrees with the compositional analysis results for steel samples that the [Si] content decreased during the treatment (Table 9). In general, it is believed that the reaction has reached equilibrium at the slag/steel interface at high temperature and this is corroborated by a number of laboratory studies and industrial trials.8,9,12,23) Therefore, there must be Al2O3 and SiO2 concentration gradients from the slag/steel interface towards the slag bulk. Actually, these concentration gradients are considered to be the driving force for the reactions.
3.2.2.2. Steel-inclusions InteractionThe deoxidation reactions to form complex oxide inclusions can be described with Eqs. (9), (10), (12) and (13).9,17,23) Similar with the case of the slag-steel reactions, the activity of Al2O3, SiO2, MnO and Cr2O3 in the inclusion complex can be calculated based on the element activities in molten steel. Here, the activity of [Al], [Si], [Mn] and [Cr] can be obtained through Eq. (11)18) based on the measured steel composition (Table 9), and then the activity of Al2O3, SiO2 MnO and Cr2O3 in the inclusions complex can be calculated and is denoted as ‘Equilibrated’ value. The oxygen activity and temperature measured at the end of treatment is used during the calculation. On the other hand, the activity of Al2O3, SiO2 and MnO can be directly estimated based on the average inclusion chemistry (Table 9 measured with SEM-AIA) with the aid of the FactSage software and is denoted as ‘FactSage’ value.13) The database of FToxide and FactPS is used during the estimation. The Cr2O3 exists both in the ‘slag’ and ‘corundum’ phases, and to simplify the estimation, its activity is set to one.
| (12) |
| (13) |
Figure 13 shows the comparison of the Equilibrated and FactSage estimated activities of Al2O3, SiO2, MnO and Cr2O3 in inclusions. Although the data points scatter to a considerable degree, the equilibrated activities for Al2O3, SiO2 and MnO are approximately in agreement with the FactSage estimated values, this implies that the steel-inclusions reaction is fairly close to the equilibrium with respect to the deoxidation of Al, Si and Mn during the treatment. Comparing to the non-equilibrium of the slag-steel reaction (Fig. 12), this is probably attributed to the large specific surface area of the inclusions, which allows enough steel/inclusion interface for the reactions. It should be noted that the estimated activity of Cr2O3 at its saturated state (corundum phase) is far away from the equilibrated value. This is probably due to (1) the imprecision of Cr2O3 activity estimation (simply to be 1); and (2) limited steel-solid corundum interaction with respect to Cr deoxidation.
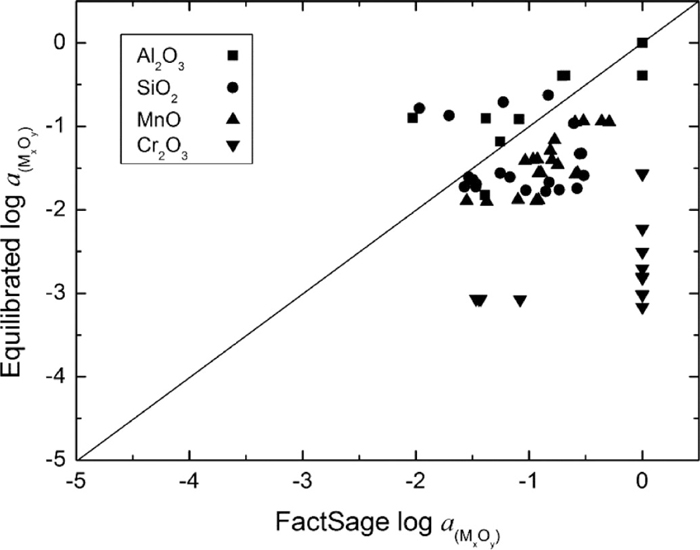
Comparison of the equilibrated and FactSage estimated activity of Al2O3, SiO2, MnO and Cr2O3 in inclusions.
Based on the above thermodynamic analysis of the slag-steel and steel-inclusions reactions (Figs. 12 and 13) and the experimental results (Table 9 and Fig. 11), it can be concluded that the slag-steel equilibrium has not been attained during the treatment, and the reaction between slag and steel is much slower than that between steel and inclusions. Therefore in the slag-steel-inclusions reaction system, it is the top slag-steel reaction, which affects the molten steel chemistry, and consequently influences the compositional evolution of inclusions during the ladle treatment.
3.2.3. Sulphur Content of the InclusionsAs seen in Table 9 the inclusions in the steel sample are mainly in the form of oxides with a minor amount of sulphides. As been understood that excepting the influence of solidification process, the sulphur content in inclusions is mainly dependent on the sulphide capacity (C'S) of the inclusions and the sulphur content ([%S]) in the steel.13) Here, the sulphide capacity of the inclusions could be calculated based on the inclusion oxides chemistry and the experimental temperatures. Furthermore, the equilibrated sulphur distribution ratio, i.e. L'S (= (%S)incl/[%S], between the steel and inclusions can be calculated. The calculation method of C'S and L'S for inclusions is similar with that for slag. The detailed calculation approach has been given in our previous paper.12) It should be noted that the measured oxides chemistry (Table 9) and sulphur content in the steel samples (Table 4) were used in the calculation. The upper part of Fig. 14 shows the relation of the calculated C'S and the measured L'S between inclusions and steel, while the lower part shows the relation between the measured L'S and the calculated equilibrated L'S.

The relation between the measured L'S and calculated C'S, as well as between the measured L'S and calculated equilibrated L'S.
It can be seen from the upper part of Fig. 14 that the data points approximately follow the line with a slope of 1, indicating that the sulphur distribution ratio between the inclusions and steel was mainly influenced with C'S of the inclusions. A good agreement between the equilibrated and measured L'S is obtained in the lower part of Fig. 14, suggesting the equilibrium between inclusions and steel with respect to sulphur was reached. Therefore, the sulphur content of inclusions could be predicted through the calculation of inclusion sulphide capacity and sulphur content in steel during the treatment. The former can be obtained by using the inclusion oxides chemistry and the treatment temperature, and the latter can be predicted through the developed desulphurisation kinetic model.
The deep desulphurisation and steel cleanliness of stainless steel refining by using an optimized CA based synthetic slag was studied under the industrial conditions on a laboratory scale. The sulphide capacity, sulphur distribution ratio and desulphurisation kinetics were investigated with respect to the desulphurisation effect of the current CSF and the optimized CA slags. The steel cleanliness was compared and the slag-steel-inclusions interaction was discussed based on thermodynamic considerations. The main results can be summarized as follows:
(1) Deep desulphurisation to the level of several ppm sulphur was achieved with an optimized CA based synthetic slag under industrial conditions in laboratory tests (i.e. 30–45 ppm sulphur content and doloma refractory crucible). A similar desulphurisation effect with current CSF and the optimized CA slags was obtained in the industrial experiment. This confirms the application feasibility of the optimized CA based synthetic slag for deep desulphurization purpose of stainless steel ladle refining.
(2) The deep desulphurisation was mostly influenced by the slag sulphide capacity, the steel chemistry and the deoxidation level of stainless steel. The sulphur evolution in steel during the ladle refining can be predicted with a developed kinetic model.
(3) An equivalent steel cleanliness was achieved with two current CSF and an optimized CA based synthetic slag, although a small amount of Al2O3–MgO spinel was observed in the final samples with CA based synthetic slag. This is believed to be the result of the slag-steel-refractory-inclusions interaction.
(4) The equilibrium was more easily reached for steel-inclusions interaction with respect to deoxidation than that for slag-steel interaction. Therefore in the slag-steel-inclusions reaction system, it is the top slag-steel reaction, which affects the molten steel chemistry, and consequently influences the compositional evolution of inclusions during the ladle treatment.
(5) The sulphur content in inclusions was predicted through the calculation of inclusion sulphide capacity and sulphur content in steel.