3. Results and Discussion
3.1. Liquid/Liquid Mixing Pattern
In the previous paper,10) we described that three types of liquid/liquid mixing pattern were observed as shown schematically in Fig. 3 and varied depending on operating factors such as N, Hand Voil/Vw. I (the left side of Fig. 3) is the region where each liquid phase exists separately and has no dispersion, II (the middle of Fig. 3) is the region where vortex of dispersed phase (liquid/liquid interface) arrives at impeller position and its dispersion starts into continuous phase, and III (the right side of Fig. 3) is the region where gas/liquid interface in addition to liquid/liquid one arrives at impeller position and dispersion occurs hard. Moreover, it was also found that the mixing pattern transited from I to II, and from II to III according to an increase in N and a decrease in H.
3.2. Calculation of Liquid/Liquid Mass Transfer Capacity Coefficient
According to double film theory, mass transfer rate of benzoic acid from liquid paraffin to water is given by
|
V
w
dC
w
/dt =K
w
a (
C
w
*
-
C
w
)
| (1) |
where V
w: water volume (m
3), C
w: concentration of benzoic acid in water (kg/m
3), K
wa: overall capacity coefficient (m
3/s), K
w: overall mass transfer coefficient (m/s), a: interfacial area between liquid paraffin and water (m
2), C
w*: concentration of benzoic acid in water in equilibrium with that in liquid paraffin (kg/m
3). When both of concentrations of benzoic acid in liquid paraffin and water are dilute enough, final partition ratio, h
*(=C
w*/C
oil), of benzoic acid between water and liquid paraffin keeps constant, where C
oil: benzoic acid concentration in liquid paraffin (kg/m
3).
Mass balance of benzoic acid is expressed by,
|
C
oil
V
oil
+ C
w
V
w
=α
| (2) |
where V
oil: volume of liquid paraffin (m
3),
α: total amount of benzoic acid dissolved in liquid/liquid system (kg). Thus, using
Eqs. (1) and
(2),
Eqs. (3),
(4),
(5) are obtained:
|
dCw / dt = m
1
(
m
2
-
C
w
)
| (3) |
|
m
1
= (
K
w
a / V
w
)
(
h*V
w
/ V
oil
+1
)
| (4) |
|
m
2
= (
h*α
/ V
oil
)
/ (
h*V
w
/ V
oil
+1
)
| (5) |
Solving Eq. (4) under an initial condition of Cw= 0,
|
(
m
2
-
C
w
)
/ m
2
= exp(
-
m
1
t
)
| (6) |
Kwa is obtained from a temporal change in Cw and Eq. (6). h* value was 0.445 from Voil=2.22×10⁻³ m3, Vw=1.90× 10⁻² m3 and α=3.48×10⁻³ kg.
On the other hand, Kw is given by
|
1/K
w
= 1/k
w
+ h
*
/k
oil
| (7) |
where k
w: water film coefficient of mass transfer (m/s), k
oil: oil film coefficient of mass transfer (m/s). Using the Wilke-Chang equation
11) which permits the diffusivities of benzoic acid in water and oil to be estimated, ratio of benzoic acid diffusivity in water to that in liquid paraffin, D
w/D
oil, became about 3.2. Assuming that mass transfer coefficient is proportional to square root of diffusivity, k
w/(k
oil/h
*) was calculated to be (3.2
1/2)(0.455)=0.81. It follows that the rate-determining step in the mass transfer rate in this system was mixture of benzoic acid diffusion in water and oil phases.
3.3. Effect of Mixing Pattern on Liquid/Liquid Mass Transfer Rate
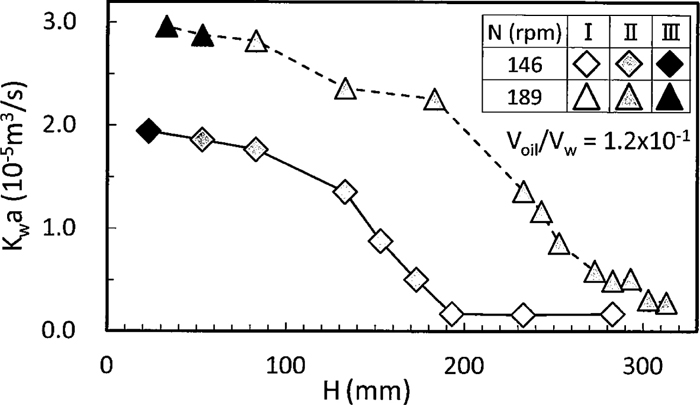
The relation between the overall capacity coefficient, Kwa, of benzoic acid transferred from liquid paraffin into water and H for N=146 and 189 rpm are shown in Fig. 4. Voil/Vw was fixed to 1.2×10⁻¹. Kw and a in the symbol of overall capacity coefficient denote overall mass transfer coefficient and liquid/liquid interfacial area, respectively. Mass transfer rate increased with an increase in N. Depending on mixing pattern described in Fig. 3, distinct change in kia was found as follows. Kwa was almost kept constant for different H in the region I where mass transfer rate was less affected by liquid/liquid interface because it moved like rigid body. On the other hand, Kwa began to increase with the decrease in H in the region II and the increasing rate of kia became lower toward the region III and furthermore in the region III. The reason why Kwa increased in the region II can be attributed to the fact that liquid/liquid interfacial area increases with the increase in dispersion of liquid paraffin into water. Moreover, the decrease in the increasing rate of Kwa in the region II near III as well as III is because most liquid paraffin has already dispersed into water and the increase in liquid/liquid interfacial area decreases.
The relation between Kwa and H for Voil/Vw=1.2×10–1 and 5.9×10⁻² is shown in Fig. 5 where N was fixed to 146 rpm. Mass transfer rate increased with an increase in Voil/Vw for the equal N and H, which seems to be caused by the fact liquid/liquid interfacial area increases with the increase in Voil/Vw as dispersion phase volume becomes large. The dependence of Kwa on the mixing pattern was similar between Figs. 4 and 5.
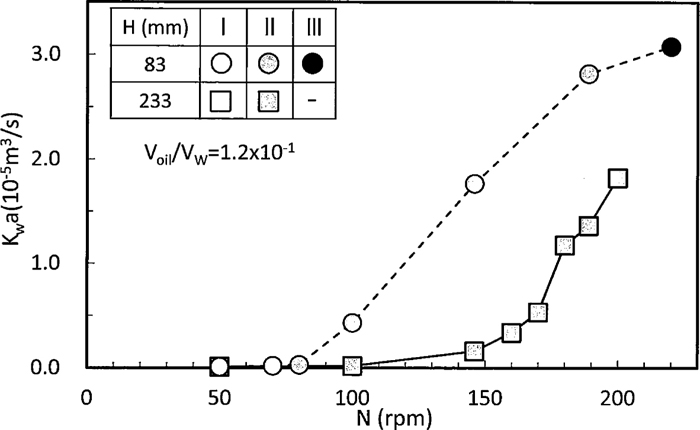
The relation between Kwa and N for H=83 and 233 mm is shown in Fig. 6 where Voil/Vw of liquid/liquid was fixed to 1.2×10⁻¹. Mass transfer rate increased with an increase in N because the it caused the transition of mixing pattern to I→II→III.
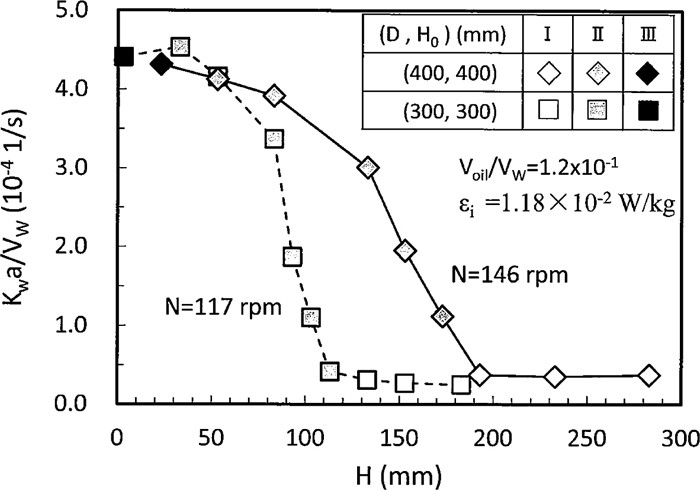
The calculated value of supply rate, εi, of mixing energy which will be described in section 3.4 became 1.18×10⁻² W/kg for N=146 rpm and D=H0=400 mm. On the other hand, N of the same εi value was 117 rpm for D=H0=300 mm. Figure 7 shows that the relation between Kwa/Vw and H for the above two vessels. Voil/Vw was kept to 1.2×10⁻¹, although liquid volume between two vessels was different from one another. Kwa values of two vessels were almost equal in the regions II near III and III, and differed in the region I and II except near III. Assuming that liquid paraffin is fully dispersed into water at the same particle radius, r and number of particles, n, a and Vw become to 4πr2n and (4πr3n/3)/(1.2×10–1), respectively. Therefore, the following equation is given,
|
K
w
a/V
w
= k
i
(
4π
r
2
n
)
(
1
.2×10
-1
)
/(
4π
r
3
n/3
)
=0
.36k
i
/r
| (8) |
When supply rate of mixing energy is equal, mass transfer coefficient, K
w and fully dispersed liquid radius, r are also the same. Thus, the values of K
wa/V
w expressed in
Eq. (8) was equal in the region II near III and III of
Fig. 7. On the other hand, K
wa/V
w values in the region II except near III was not equal because it was affected by the difference in liquid paraffin dispersion into water due to different transition points from I to II between two vessels.
A multi-regression analysis was applied to the relation between Kwa and operating variables for the region II. The equation became as follows:
|
K
w
a=6
.31×10
-21
N
4.61
(
H-
H
oil
)
-0.88
(
V
oil
/V
w
)
0.44
D
2.74
| (9) |
where R
2=0.62. As can be seen in
Figs. 4 ,
5 ,
6 ,
7, the transition of mixing pattern from II to III was accelerated along with the increase in rotation speed, the decrease in depth from free surface to impeller position and the increase in ratio of dispersion phase volume to water.
Equation (9) has also the same tendency as the transition of II–III. To apply these results to the extended system such as slag/metal system quantitatively, dimensional analysis is preferable. However, it was difficult as this study was carried out by only liquid paraffin and water system. It is an issue in the future to rearrange it with the added data of several liquid/liquid systems in view of dimensional analysis.
3.4. Comparison between Gas and Mechanical Stirrings for Liquid/Liquid Mass Transfer Rate
Supply rate of mixing energy of gas stirring expressed as εg (W/kg) is given by Eq. (10),
|
ε
g
= 8.58×
10
5
Q’T /W
w
log(
1+H/10.3
)
| (10) |
where Q’: gas flow rate (m
3/s), T: bath temperature (K), W
w: mass of water (kg), H: depth from free surface to the position of gas injection (m).
On the other hand, supply rate of mixing energy of mechanical stirring expressed as εi (W/kg) is given by Eq. (4),12)
|
ε
i
= N
P
⋅
ρ
m
⋅
N
3
⋅
d
i
5
/W
w
| (11) |
where N
P: power number (–),
ρm: mean density (kg/m
3), N: rotation speed (rps), d
i: impeller diameter (m). N
P is calculated from
Eq. (12) given by the Nagata’s formula,
13) where H
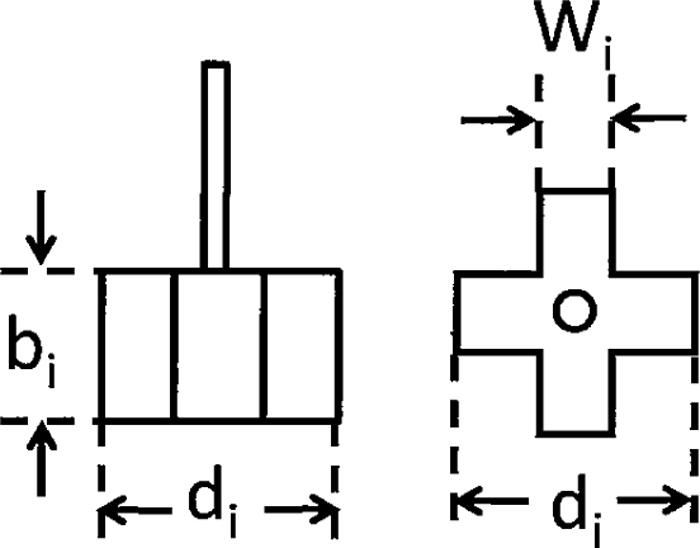
0: bath depth (m), D: vessel diameter (m), b
i: blade thickness (m), n
P: number of blade and
μm: mean viscosity (Pa·s).
|
N
P
= A/R
e
+ B{
(
10
3
+1
.2 R
e
0.66
)
/
(
10
3
+ 3
.2 R
e
0.66
)
}
P
(
H
0
/D
)
(0.35+b’/D)
| (12) |
The variables of A, B, P, b’ and Re in Eq. (12) are calculated from the following Eqs. (13), (14), (15) ,(16) ,(17).
|
A = 14 +(
b’/ D
)
{670
(
d
i
/ D – 0.6
)
2
+185
| (13) |
|
B = 10^{
1.3 – 4
(
b’/ D – 0.5
)
2
–1
.14 d
i
/ D
}
| (14) |
|
P = 1.1 + 4(
b’/ D
)
– 2.5
(
d
i
/ D – 0.5
)
2
–7(
d
i
/ D
)
| (15) |
|
R
e
=
ρ
m
N d
i
2
/
μ
m
| (17) |
Here,
ρm and
μm in
Eqs. (11) and
(17) are calculated from volume fraction of water and liquid paraffin. As shown in
Eqs. (4),
(5),
(6),
(7),
(8),
(9),
(10),
(11),
(12),
(13),
(14),
(15),
(16),
(17), the supply rate of mixing energy of mechanical stirring is not affected by H, depth from free surface to the impeller position, although that of gas stirring is dependent on H in
Eq. (3).
Both of εg for Q=10 and Q=20 L/min were calculated from Eq. (10) for H0=0.4 m, H=0.28 m, Voil/Vw=1.2×10–1 and T=298 K. Rotation speed for mechanical stirring was obtained by substituting εi values corresponding to the calculated εg ones into Eqs. (11), (12), (13), (14), (15), (16), (17). As shown in Table 3, the rotation speeds, N=146 and 189 rpm correspond to gas flow rates, Q=10 and 20 L/min at H=0.28 m, respectively.
Table 3. Calculation of supplied rate of stirring energy, gas flow rate and rotating speed.
| Q (L/min) | εg (W/kg) | N (rpm) | εi (W/kg) |
|---|
| 10 | 1.18 × 10⁻² | 146 | 1.18 × 10⁻² |
| 20 | 2.36 × 10⁻² | 189 | 2.35 × 10⁻² |
Comparison between Kwa of mechanical stirring and gas stirring for the same supply rate of mixing energy is shown in Fig. 8. Gas stirring was carried out through two-holes nozzle immersed into water and air was blown horizontally. Kwa values of mechanical stirring in the region I and up to a point of the region II was smaller than those of gas stirring, whereas they were larger than above the point of the region II and the region III. From the standpoint of slag/metal reaction practice carried out under high temperature, the region III may have potential to damage an impeller due to its partial exposure to atmosphere. Therefore, the mechanical stirring in the region II closed to the region III is more preferable in order to support enhancement in slag/metal mass transfer rate and stable slag/metal operation at the same time.
3.5. Oxygen Transfer Rate from Gas to Continuous Liquid Phase in Mechanical Stirring
In a mechanical stirring practice, oxygen transfers from air to water by means of two routes: one is that oxygen in air moves into water directly and the other that oxygen moves through liquid paraffin. Thus, oxygen balance in water is expressed by Eq. (18),
|
V
w
dC’
w
/dt = K
w,G-L
a
G-L
(
C’
*
w,G-L
–
C’
w
)
+ K
w,L-L
a
L-L
(
C’
*
w,L-L
–
C’
w
)
| (18) |
where K
w,G-L: overall mass transfer coefficient of oxygen between air and water (m/s), a
G-L: interfacial area between air and water (m
2), C’
*w,G-L: oxygen concentration in water in equilibrium with oxygen in air (kg/m
3), C’
w: oxygen concentration in water (kg/m
3), K
w,L-L: overall mass transfer coefficient of oxygen between liquid paraffin and water (m/s), a
L-L: interfacial area between liquid paraffin and water (m
2), and C’
*w,L-L: oxygen concentration in water in equilibrium with oxygen in liquid paraffin (kg/m
3).
Oxygen balance in liquid paraffin is given by oxygen input from air/liquid interface and oxygen output to water shown in Eq. (19).
|
V
oil
dC’
oil
/dt = K
oil,G-L
a
oil,G-L
(
C’
*
oil,G-L
–
C’
oil
)
– K
w,L-L
a
L-L
(
C’
*
w,L-L
–
C’
w
)
| (19) |
where C’
oil :oxygen concentration in liquid paraffin (kg/m
3), K
oil,G-L: overall mass transfer coefficient of oxygen between air and liquid paraffin (m/s), a
oil,G-L: interfacial area between air and liquid paraffin (m
2), C’
*oil,G-L: oxygen concentration in liquid paraffin in equilibrium with oxygen in air (kg/m
3). Assuming that oxygen transfer in liquid paraffin becomes a steady state quickly,
Eq. (19) can be expressed as
Eq. (20).
|
K
oil,G-L
a
oil,G-L
(
C’
*
oil,G-L
–
C’
oil
)
=K
w,L-L
a
L-L
(
C’
*
w,L-L
–
C’
w
)
| (20) |
Overall gas-liquid mass transfer coefficient, KG-L (m/s) is given by Eq. (21).
|
1/K
G-L
= 1/(
H’k
G,G-L
)
+1/k
L,G-L
| (21) |
where k
G,G-L is gas film coefficient of oxygen transfer (kg/(Pa·m
3·s)), k
L,G-L is liquid film coefficient of oxygen transfer (m/s), and H’ is Henry’s constant (Pa·m
3/kg) defined by
Eq. (22).
In
Eq. (22), p
oxy is oxygen partial pressure (Pa) and C
oxy is oxygen concentration in liquid (kg/m
3). When liquid took sufficient time to contact with air, C’
*oil,G-L in liquid paraffin became 11.6×10
–3 kg/m
3, whereas C’
*w,G-L in water was 9.3×10
–3 kg/m
3. Oxygen solubilities in liquid paraffin and water were approximately same and small enough. Substituting P
oxy=1.013×10
5×0.21=2.31×10
4 Pa and the above C’
*oil,G-L and C’
*w,G-L values into
Eq. (22), H’ values for liquid paraffin and for water were calculated to be 1.99×10
6 and 2.48×10
6 Pa·m
3/kg, respectively. Large Henry’s constant means that K
G-L≒ k
L,G-L in
Eq. (21) and rate determining steps for oxygen transfer between gas and liquid is liquid film diffusion.
For liquid-liquid mass transfer rate, Kw,L-L is given by Eq. (23),
|
1/K
w,L-L
= 1/k
w,L-L
+ h
**
/k
oil,L-L
| (23) |
where k
w,L-L: water film coefficient of oxygen transfer (m/s), k
oil,L-L: oil film coefficient of oxygen transfer (m/s), h
**: oxygen partition ratio (=C’
*w,L-L/C’
oil). The h
** value is obtained from the experiment with a closed vessel filled with water and liquid paraffin. Using the Wilke-Chang equation,
11) ratio of oxygen diffusivity in water to that in liquid paraffin, D
w,oxygen/D
oil,oxygen became about 3.2 as well as benzoic acid diffusivity in section 3.2. If mass transfer coefficient is proportional to square root of diffusivity, k
w,L-L/(k
oil,L-L/h
**) was calculated to be (3.2
1/2)(1.80)=3.2. It resulted in the rate-determining step of mixture of oxygen diffusion in water and oil phases as well as benzoic acid diffusion.
Thus, Eq. (20) can rewritten for C’*w,L-L, using constant parameters under a given operating factor such as liquid film coefficient of oxygen transfer through liquid paraffin, kL,G-L (m/s), aoil,G-L, Kw,L-LaL-L, C’*oil,G-L (=11.6×10⁻³ kg/m3), h**(=1.80), and time-dependent C’w.
|
C’
*
w,L-L
=(
k
oil,G-L
a
oil,G-L
C’
*
oil,G-L
+ K
w,L-L
a
L-L
C’
w
)
/
(
k
oil,G-L
a
oil,G-L
/h
**
+K
w,L-L
a
L-L
)
| (24) |
When resistance to oxygen transfer between gas and liquid paraffin is ignored compared with that between liquid paraffin and water, that is, koil,G-Laoil,G-L»Kw,L-Laoil,L-L, C’*w,L-L, Eq. (24) can be expressed as Eq. (25).
|
C’
*
w,L-L
= h
**
C’
*
oil,G-L
| (25) |
means liquid paraffin is saturated with oxygen because oxygen supply interface between air and liquid paraffin is sufficient during mechanical stirring practice. However, as oxygen transfer resistance usually exists between gas and liquid paraffin,
Eq. (24) must be used instead of
Eq. (25).
According to the visual observation, water contacted with air directly in the region III as well as with liquid paraffin, whereas it did not meet air in the regions I and II. Thus, the first term of the right side in Eq. (18) can be ignored for the region I and II as follows:
|
V
w
dC
w
/dt = K
w,L-L
a
L-L
(
C’
*
w,L-L
–
C’
w
)
| (18’) |
By substituting Eq. (24) into Eq. (18’), it can be integrated with C’w=C’0,w at t=0.
|
(
h
**
C’
*
oil,G-L
–
C’
w
)
/(
h
**
C’
*
oil,G-L
–
C’
0,w
)
=exp[– (α
K
w,L-L
a
L-L
/V
w
)t]
| (26) |
|
α = (
k
oil,G-L
a
oil,G-L
/h
**
)
/(
k
oil,G-L
a
oil,G-L
/h
**
+K
w,L-L
a
L-L
)
| (27) |
When koil,G-Laoil,G-L/h** approaches infinite, resistance of oxygen mass transfer between gas and liquid does not exist and α becomes unit.
For the region III, Eq. (18) can be integrated with C’w=C’0,w at t=0.
|
(
A – C’
w
)
/(
A – C’
0,w
)
=exp(
–Bt
)
| (28) |
|
A = (K
w,G-L
a
G-L
C’
*
w,G-L
+α
K
w,L-L
a
L-L
h
**
C’
*
oil,G-L
)/
(K
w,G-L
a
G-L
+α
K
w,L-L
a
L-L
)
| (29) |
|
B = (K
w,G-L
a
G-L
+α
K
w,L-L
a
L-L
)/V
w
| (30) |
where C’
*w,G-L and C’
*oil,L-L are 9.3×10
–3 and 11.6×10
–3 kg/m
3, respectively, as mentioned above.
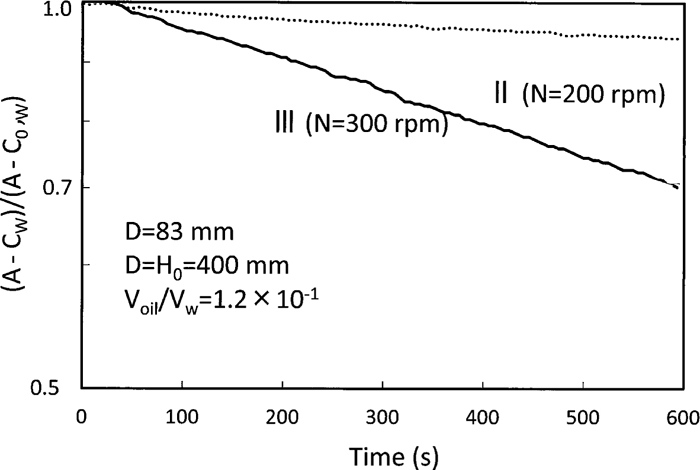
Typical examples of temporal change in oxygen concentration in water are shown in Fig. 9. Mixing patterns of N=200 and 300 rpm represented those of the region II and III, respectively. A in Eq. (28) for the region III was obtained from Kw,G-LaG-L calculated by trial-and-error method and αKw,L-LaL-L calculated by extrapolation of the region II. The slopes, (Kw,G-LaG-L+αKw,L-LaL-L)/Vw, of temporal change in oxygen concentration were linear, which means the overall volumetric coefficient was kept constant. Oxygen absorption rate in the region III was faster than that in the region I and II due to gas/liquid mass transfer in addition to liquid/liquid one.
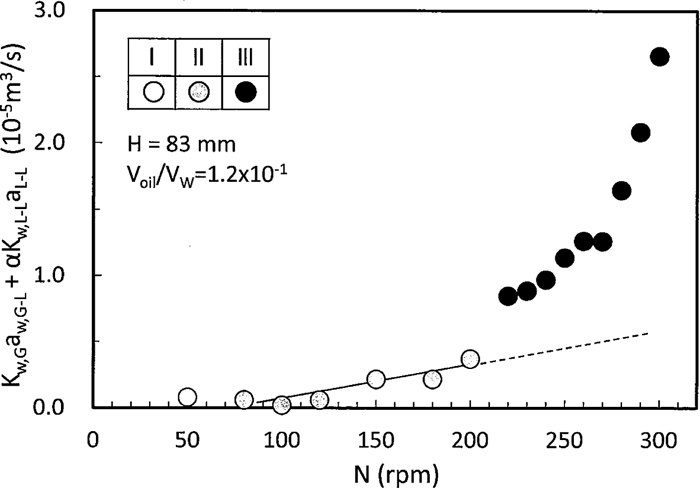
The relation between Kw,G-LaG-L+αKw,L-LaL-L and N for H=83 mm and Voil/Vw=1.2×10–1 is shown in Fig. 10 where the other operating factors were a standard, and the vertical axis of the region I and II indicates αKw,L-LaL-L. αKw,L-LaL-L was kept nearly constant from the region I to the first half of the region II and it began to increase from the second half of the region II. αKw,L-LaL-L values in the region III were given by extrapolating αKw,L-LaL-L in the second half of the region as indicated in a dotted line in Fig. 10. It was found that Kw,G-LaG-L+αKw,L-LaL-L of the region III increased in a discontinuous manner.
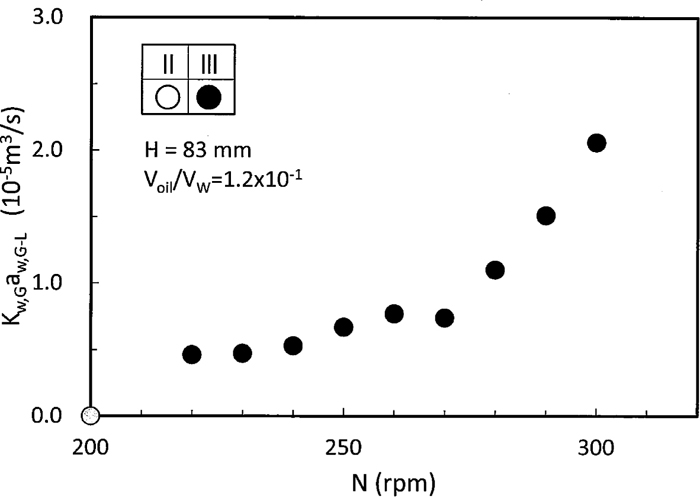
By subtracting the extrapolated αKw,L-LaL-L from the Kw,G-LaG-L+αKw,L-LaL-L in Fig. 10, increasing rate of Kw,G-LaG-L for rotation speed is shown in Fig. 11. As presented in the visual observation, the direct oxygen transfer between immersed air bubbles and water remarkably increased Kw,G-LaG-L in the region III.
αKw,L-LaL-L became 0.7×10⁻⁵ m3/s at N=200 rpm as shown in Fig. 10, whereas Kwa was estimated to be 2.9×10⁻⁵ m3/s under the same experimental condition as known from Fig. 6. The value of Kwa was 4.1 times larger than that of αKw,L-LaL-L. Using Eqs. (7) and (23), kw/(koil/h*) = 0.81 and kw,L-L/(koil,L-L/h**) = 3.2, and assuming that mass transfer coefficient is proportional to square root of diffusivity, Eq. (31) was obtained as follows.
|
K
w
a/K
w,L-L
a
L-L
= (
k
w
/1.81
)
/(
k
w,L-L
/4.2
)
= 2.3(
k
w
/k
w,L-L
)
= 2.3
(
D
w
/D
w,oxygen
)
1/2
| (31) |
Substituting benzoic acid diffusivity in water, D
w=0.9×10
–9 m
2/s
13) at 298 K and oxygen diffusivity in water, D
w,oxygen= 2.2×10
–9 m
2/s
12) at 290 K into
Eq. (30), K
wa/K
w,L-La
L-L became 2.3(0.9/2.2)
1/2=1.5. Thus,
|
α=(
k
oil,G-L
a
oil,G-L
/h
**
)
/(
k
oil,G-L
a
oil,G-L
/h
**
+K
w,L-L
a
L-L
)
= 1.5/4.1 = 0.37
| (32) |
Equation (32) gives koil,G-Laoil,G-L/Kw,L-LaL-L=1.0, which means oxygen transfer rate between air and liquid paraffin is almost the same value as that between water and liquid paraffin at N=200 rpm in the region II.