Abstract
The influence of TiO2 content and basicity on the surface tension of the molten blast furnace slag has been investigated using the dispensed drop method at 1673 K under the Argon atmosphere (Pressure ≈ 1.2 atm). The measurement shows that TiO2 plays a role as a surfactant in the CaO–SiO2–MgO–Al2O3–TiO2 system, and the decrease of the surface tension of the melt results from both the compositional changes and the structural change along with the composition variation. The surface tension of the slag rises from 413 mN/m up to 456 mN/m along with CaO/SiO2 mass ratio increasing from 0.90 to 1.20, while the structural variation only attenuates the rise of the surface tension of the slag. The thermodynamic model for determining the surface tension of molten slag by considering the surface tension and molar volume of the pure oxide components, and their ionic radii was applied to this molten slag bearing TiO2. The temperature dependence of the surface tension for pure TiO2 has been determined by comparing the measurement and the model calculation. The calculated surface tensions based on the present model are in good agreement with the experimental values. The maximum error and the average error are –7.52% and 3.27%, respectively. The influence of MgO and Al2O3 in the 5-component slag system has also been studied, and the addition of MgO or Al2O3 can increase the surface tension of the slag.
1. Introduction
The surface tension of molten slag is a key parameter in industrial processes at high temperatures for controlling the various surface and interfacial phenomena1,2,3) in ironmaking and steelmaking processes. Particularly, during the process of ironmaking in blast furnace with Vanadic Titanomagnetite,4) the mass percent of TiO2 can reach 25.00%, causing several critical problems, such as foaming slag,5,6,7,8) high viscous slag and high metal loss. Although a large number of experimental surface tension data has been reported for silicate melts,9,10,11,12) it is not possible to find appropriate data on the surface tension of molten slag bearing TiO2 because of the limited availability of these data, resulting in a difficulty not only for studying the interfacial phenomena between slag and hot metal but also for the slag foaming in the blast furnace. Therefore, to fully understand the physical and chemical aspects of the blast furnace slag bearing TiO2, the contribution arising from surface properties cannot be overlooked. Besides, knowledge of the dependence of surface tension on liquid composition might provide useful insight into liquid structure.
Some models13) have been developed for evaluating the surface tension of molten slag containing various components. Boni and Derge applied the additivity rule14) to predict the surface tension of multi-component slag. Tanaka et al.15,16) applied thermodynamic databases to evaluate the surface tensions of liquid alloys, ionic melts and oxide melts by using a model based on Butler’s equation.17) Based on the coexistence theory of slag melt structure and Butler’s equation, a calculation model was proposed for determining the surface tension of slag melt by Cheng et al.18) Although the calculated results were in good agreement with the experimental data, the applicability of this model to evaluate the surface tension of oxide melts was limited due to a lack of thermodynamic data for these particular multi-component systems. Recently, Tanaka et al.19) have developed a new model for evaluating the surface tension of molten silicates, which takes into consideration the ionic radii of the components. This particular model can be readily applied to many kinds of molten ionic mixtures and molten slag, because the surface tension of silicate melts can be calculated using the information on the surface tensions and molar volumes of pure oxides, as well as the cationic and anionic radii of the component oxides in the system. This model has already been applied to the calculations of surface tension for several ternary silicate melts20) comprising SiO2, Al2O3, CaO, FeO, MgO or MnO. Nakamoto et al.21) applied this model was to evaluate the surface tension of silicate melts containing the following surface-active components, B2O3, CaF2 or Na2O. A further extension of the above modified model was attempted for determining the surface tensions of the more complex 6-component slag systems by Hanao et al.22)
In this study, the influences of the TiO2 and CaO/SiO2 mass ratio in the surface tension of the molten TiO2–CaO–SiO2–Al2O3–MgO blast furnace slag were determined by adopting the improved sessile drop method, and the pyrolytic graphite was used to obtain the non-wetting drop shape for accurate measurement. Besides, another further extension of the above modified model was applied for determining the surface tensions of the molten slag bearing TiO2. The effects of MgO and Al2O3 on the surface tension of CaO–SiO2–MgO–Al2O3–TiO2 system were analyzed based on the present model.
2. Experimental Procedure
2.1. Experimental Apparatus
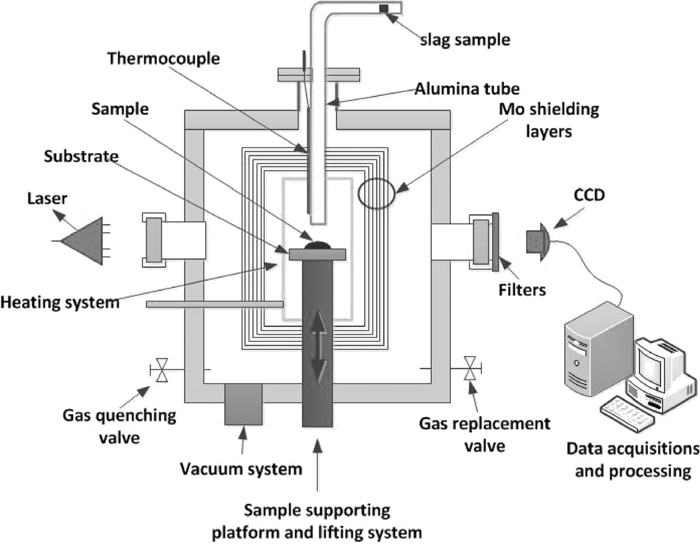
The modified sessile drop technique improved by the traditional sessile drop method, which was proposed by Fujii et al.,23) was adopted as the method for measuring the surface tension. An optical camera (Nikon D90) was used to record the image of the liquid drop. An advanced computer software, ADSA software, was used to facilitate the calculation of the surface tension. The flowchart24) presented in Fig. 1 shows the general procedure of ADSA for the determination of the surface tension from the sessile drops. The drop profile coordinates are obtained from the image of the drop using an image analysis process. The drop profile and physical properties, i.e. density and gravity, are the input to numerical schemes which are used to fit a series of curves. The best fit identifies the drop volume, radius of curvature at the apex, and the surface tension between the liquid and gas. The apparatus (shown in Fig. 2) includes the following six parts: the furnace, image-forming system, the vacuum-made system, the heating-control system, the cooling system and data processing system. To isolate the heating element from the sample, a reaction tube made from quartz was used. The tube was inserted into the furnace through an opening on the top furnace plate.

The powders of analytical reagents, TiO2, SiO2, Al2O3, CaO and MgO, were weighed on a microbalance and blended to produce the slag compositions, which are presented in Table 1. The powders were then mixed and melted in an electric resistance furnace in alumina crucibles. Slag samples were heated to 1723 K and sufficiently held for more than an hour in an Argon gas atmosphere to achieve thermal equilibrium. After melting, the slags were poured on a metal plate, where they immediately solidified, forming glass-like microstructure. Chemical compositions of the post-experimental slags were analyzed using X-ray fluorescence (XRF) spectroscopy and no apparent change was observed. Then, the cube samples with 3×3×3 mm3 for the measurements were prepared by cutting the bulk slag carefully.
Table 1. The chemical composition of 5-component slag bearing TiO
2 (in mass%).
| Sample No. | TiO2 | Al2O3 | MgO | CaO | SiO2 | Basicity, CaO/SiO2 |
|---|
| 1 | 8.00 | 14.00 | 8.00 | 36.67 | 33.33 | 1.10 |
| 2 | 13.00 | 14.00 | 8.00 | 34.05 | 30.95 | 1.10 |
| 3 | 18.00 | 14.00 | 8.00 | 31.43 | 28.57 | 1.10 |
| 4 | 23.00 | 14.00 | 8.00 | 28.81 | 26.19 | 1.10 |
| 5 | 28.00 | 14.00 | 8.00 | 26.19 | 23.81 | 1.10 |
| 6 | 33.00 | 14.00 | 8.00 | 23.57 | 21.43 | 1.10 |
| 7 | 23.00 | 14.00 | 8.00 | 26.05 | 28.95 | 0.90 |
| 8 | 23.00 | 14.00 | 8.00 | 27.50 | 27.50 | 1.00 |
| 9 | 23.00 | 14.00 | 8.00 | 30.00 | 25.00 | 1.20 |
| 10 | 23.00 | 14.00 | 6.00 | 29.86 | 27.14 | 1.10 |
| 11 | 23.00 | 14.00 | 10.00 | 27.76 | 25.24 | 1.10 |
| 12 | 23.00 | 14.00 | 12.00 | 26.71 | 24.29 | 1.10 |
| 13 | 23.00 | 14.00 | 14.00 | 25.67 | 23.33 | 1.10 |
| 14 | 23.00 | 12.00 | 8.00 | 29.86 | 27.14 | 1.10 |
| 15 | 23.00 | 16.00 | 8.00 | 27.76 | 25.24 | 1.10 |
| 16 | 23.00 | 18.00 | 8.00 | 26.71 | 24.29 | 1.10 |
| 17 | 23.00 | 20.00 | 8.00 | 25.67 | 23.33 | 1.10 |
For the accurate measurement of the surface tension, and the pyrolytic graphite (99.9% purity) was used to obtain the non-wetting drop shape necessary for accurate sessile drop measurement because of its non-wettability with the molten slag and chemical inertness. The graphite was in plate shape with the surface dimensions of 20 mm × 20 mm and the height of 4 mm. Its surface was mechanically ground and carefully polished using different sizes of diamond pastes to get an average roughness (Ra) of < 400 nm.
2.3. Surface Tension Measurement
Both the slag and the substrate were cleaned in acetone with ultrasonic for three times before measurement, and the cleaning time is 5 minutes for each cleaning. The sample and substrate were then put into a tube made of stainless steel outside the chamber (Seen in Fig. 2) and the substrate was placed on the top of a short piece of alumina rod respectively. The chamber of the furnace was first evacuated to about 5×10⁻⁴ Pa at the room temperature and then backfilled with high-purity (99.9999%) argon. Then, the furnace was heated at a rate of 20 K·min–1. When the temperature of the chamber reached the desired value, it should be kept for 30 minutes. Then the slag sample, initially placed in a tube made of stainless steel outside the chamber, was dropped through an open alumina tube into the chamber and then rested on the substrate surface. Because of the high testing temperature, the slag instantly melted after it was dropped. As soon as the drop was observed, the drop profile was recorded by a high resolution optical camera and the time was defined as the start point for the wetting. After the wetting experiment, the sample was furnace-cooled at a rate of 30 K·min–1.
3. Model for the Surface Tension Evaluation of Molten Slag
A prediction model derived by Tanaka et al.19) for the evaluation of the surface tension of ionic mixtures was applied to the 5-component molten slag in the CaO–SiO2–MgO–Al2O3–TiO2 system based on the Butler’s equation. The surface tensions of the 5-component molten slag is calculated from Eqs. (1), (2), (3), (4), (5):
|
σ=
σ
Si
O
2
Pure
+
RT
A
Si
O
2
ln
M
Si
O
2
Surf
M
Si
O
2
Bulk
| (1) |
|
σ=
σ
CaO
Pure
+
RT
A
CaO
ln
M
CaO
Surf
M
CaO
Bulk
| (2) |
|
σ=
σ
A
l
2
O
3
Pure
+
RT
A
A
l
2
O
3
ln
M
A
l
2
O
3
Surf
M
A
l
2
O
3
Bulk
| (3) |
|
σ=
σ
MgO
Pure
+
RT
A
MgO
ln
M
MgO
Surf
M
MgO
Bulk
| (4) |
|
σ=
σ
Ti
O
2
Pure
+
RT
A
Ti
O
2
ln
M
Ti
O
2
Surf
M
Ti
O
2
Bulk
| (5) |
Where
|
M
i
P
=(
R
A
R
X
⋅
N
i
P
)
/
(
R
S
i
4+
R
Si
O
4-
⋅
N
Si
O
2
P
+
R
C
a
2+
R
O
2-
⋅
N
CaO
P
+
R
M
g
2+
R
O
2-
⋅
N
MgO
P
+
R
A
l
3+
R
O
2-
⋅
N
A
l
2
O
3
P
+
R
T
i
4+
R
O
2-
⋅
N
Ti
O
2
P
)
| (6) |
Subscript
i refers to the following components: SiO
2, CaO, CaF
2, Al
2O
3, MgO, TiO
2. Subscripts A and X refer to the cations and anions of component
i, respectively. Superscripts “Surf” and “Bulk” indicate the surface and bulk, respectively.
R is the gas constant,
T is the absolute temperature,
σ
i
Pure
is the surface tension of the pure molten component
i, which is treated as a model parameter.
Ai =
N
0
1
/
3
⋅
V
i
2
/
3
corresponds to the molar surface area in a monolayer of pure molten component
i (
N0: Avogadro’s number,
Vi: molar volume of the pure molten component
i).
N
i
P
is the mole fraction of the component
i in phase P (P=Surf or Bulk).
RA is the radii of the cation, and
RX is the radii of the anion.
For example:
|
R
A
=
R
Si
4+
,
R
Ca
2+
,
R
Al
3+
,
R
Mg
2+
,
R
Ti
4+
R
X
=
R
SiO
4
4-
,
R
O
2-
,
R
F
-
| (7) |
where
SiO
4
4-
is considered to be the minimum anionic unit in SiO
2, and the value of
R
Si
4+
/
R
SiO
4
4-
was experimentally determined to be 0.5.
20,21,22) The above
Eqs. (1),
(2),
(3),
(4),
(5) have been derived on the basis of Butler’s equation by considering the following assumptions [1] and [2]:
20,21,22)
[1] It has been known that molten ionic mixtures readily undergo surface relaxation due to spontaneous changes in the ionic distance at the surface, which causes the energetic state of the surface to approach that of the bulk state. Thus, the contribution from excess Gibbs energy terms is neglected in Butler’s equation.
[2] In ionic substances, it is well known that their ionic structures depend upon the ratio of the cation to anion radii. In order to evaluate the ionic structures and physical chemical properties of ionic materials, the cation to anion radii ratio should be considered.
Data on the ionic radii were obtained from Shannon25) and Sohn,26) and the molar volumes of the pure oxides except TiO2 recommended by Mills and Keene14) and used in previous study20,21,22) were adopted in the present model. These values are listed in Tables 2 and 3, respectively. The temperature dependences of the surface tension for pure SiO2, CaO, Al2O3 and MgO were evaluated in previous work20,21,22) and used in the current study. The equations for determining the temperature dependences of surface tension are listed in Table 4. The chemical compositions for the surface tension evaluation based on the present model are also shown in Table 1.
Table 2. Radii of the cationic and anionic ions.
| Ion | Radii (Å) |
|---|
| Si4+ | 0.42 |
| Ca2+ | 0.99 |
| Al3+ | 0.51 |
| Mg2+ | 0.66 |
| Ti4+ | 0.61 |
| O2– | 1.44 |
Table 3. Molar volumes of the pure components.
| Oxide | Temperature(K) dependence of molar volume (m3/mol) |
|---|
| SiO2 | 27.516{1+10–4(T–1773)}·10–6 |
| CaO | 20.7{1+10–4(T–1773)}·10–6 |
| Al2O3 | 28.3{1+10–4(T–1773)}·10–6 |
| MgO | 16.1{1+10–4(T–1773)}·10–6 |
| TiO2 | 22.2{1–4.689·10–5(T–1023)}·10–6 |
Table 4. Temperature dependence of the surface tension of pure components.
| Oxide | Temperature(K) dependence of surface tension (mN/m) |
|---|
| SiO2 | 243.2+0.031T |
| CaO | 791–0.0935T |
| Al2O3 | 1024–0.177T |
| MgO | 1770–0.636T |
| TiO2 | 1384.3–0.6254T |
4. Results and Discussion
4.1. Evaluation of the Temperature Dependence of the Surface Tension for Pure TiO2
The molar volume of the TiO2 was referred to the literature data reported by R. KNOCHE et al.27) The molar volume for TiO2 at 1023 K is 22.20 cm3/mol and the temperature dependence coefficient is –46.98×10⁻⁶°C–1. The linear relation was also shown in Table 3.
Due to the lack of surface tension data for pure TiO2, the temperature dependence of the surface tension for pure TiO2 melt was evaluated in this study. For this purpose, the NO. 4 slag (TiO2 content is 23.00 mass%) was selected and its surface tensions were measured at the following elevated temperatures: 1643 K, 1673 K, 1698 K and 1723 K. The surface tension for pure TiO2 at 1673 K was taken as an example to explain the general procedure of the determination of the surface tension for pure TiO2. Firstly, the surface tension of the No. 4 slag was measured and substituted in Eqs. (1), (2), (3), (4) as a known quantity. Then the mole fractions of SiO2, CaO, Al2O3 and MgO at the surface were obtained because the surface tensions for pure SiO2, CaO, Al2O3 and MgO were also known quantities. Thereby, the mole fraction of TiO2 at the surface was got because the sum of the mole fractions of TiO2, SiO2, CaO, Al2O3 and MgO principally equals to 100%. Finally, the surface tension for pure TiO2 at 1673 K was achieved according to Eq. (5) by the aid of the surface tension of the slag at 1673 K and the mole fraction of TiO2 at the surface. The surface tensions for pure TiO2 at different elevated temperatures obtained by the aforementioned method were plotted in Fig. 3 shown as rectangle plots. The temperature dependence of its surface tension was evaluated by the least square method shown as the solid line, and the linear relation was also listed in Table 4.
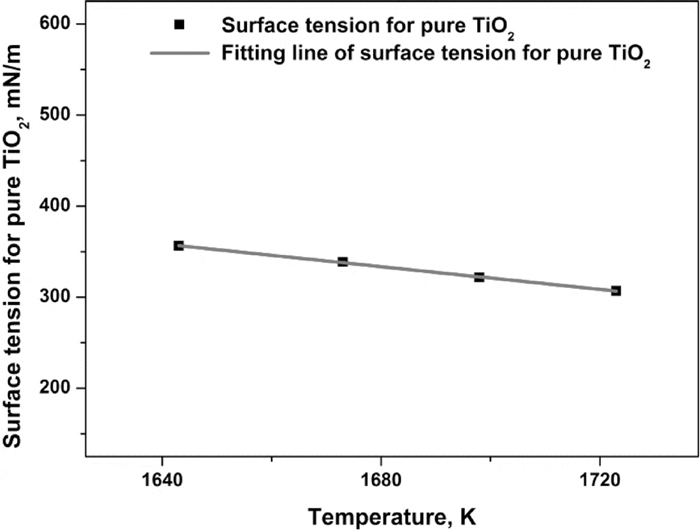
Figure 4 shows the relation between TiO2 mass fraction and the surface tension of the molten slag. The surface tension decreases along with the addition of TiO2, proving that TiO2 plays a role as a surface active agent in the 5-component slag. Here, there is a comparison between the calculated results and the experimental values, showing that the evaluated values are in good agreement with the experimental results.
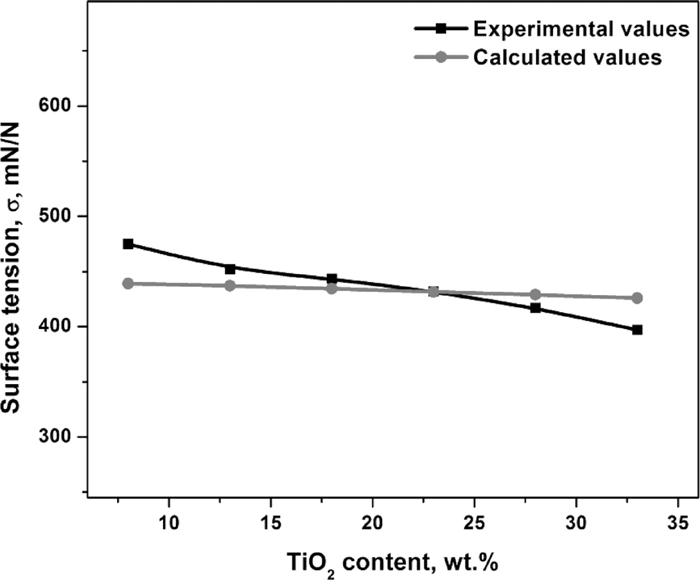
It is well known that the structure and molecular distribution of the molten slag at the surface are, in many cases, quite different from that present in the bulk. As shown in Fig. 5, along with the increase of the TiO2 content, the mole fraction of TiO2 at the surface goes up rapidly from 9.15% to 38.64%. On the contrary, the increase of TiO2 content results in the dramatic decrease of the mole fraction of SiO2 at the surface. The mole fraction of CaO at the surface is very low though it has the largest mole fraction in the bulk. The mole fractions of Al2O3 and MgO are very low and change a little because of the fixed values shown in Table 1. Table 5 shows the surface tensions for each oxide at 1673 K. It should be pointed out that the lower the surface tension, the more likely it is for this component to migrate for the surface phase, which can explain the distribution for the mole fractions of oxides. The decrease of the surface tension for the slag results from the dramatic increase of the mole fraction at the surface of the low surface tension oxide, TiO2 and the decrease of the mole fraction at the surface for CaO. The fall range for the surface tension of the slag is attenuated by the decrease of the mole fraction at the surface for SiO2.

Table 5. Surface tensions of each oxide at 1673 K.
| Oxide | SiO2 | CaO | Al2O3 | MgO | TiO2 |
|---|
| Surface tension, mN/m | 295.06 | 634.57 | 727.88 | 705.97 | 338.00 |
It is well known to us that the two principal parameters which influence the surface tension of liquid metals or alloys are the melt composition and temperature. As for the molten slag, the melt’s structure may play an equally important role in the determination of the surface tension of the slag. Next the influence of the melt’s structure on the surface tension of the slag along with the compositional variation will be discussed. It is generally recognized that there are three kinds of ions existing in the slag melts: cations (Ca2+, Mg2+ and Ti4+ in this study), simple anions (O2–) and complicated units (Q1, Q2, Q3, Q4 for Si and Al). NBO/T, a measure for the degree of the polymerization of the slag was proposed by Mills et al.,13) which is defined as following: NBO/T = number of non-bridging O / tetragonally-bonded oxygen. As a basic oxide, TiO2 can promote the depolymerization of the slag structure, and NBO/T will increase. In other words, the much more complicated units, such as Qn(Si) and Qn(Al) (Here n=3, 4), will turn into Qn(Si) and Qn(Al) (Here n=1, 2). Furthermore, the complicated units, Q1 and Q2 for Si and Al, have a much smaller moment than that of the simple anion, O2–, resulting in that Q1 and Q2 will be excluded outside to the surface layer. As a result, the number of the complicated units will increase, while the number of free oxygen will reduce. As a consequence, the surface tension of the melt will drops down because of the decrease of the total ion moment at the surface.
To sum up, the decrease of the surface tension of the melt results from both the compositional changes and the structural change along with the composition variation.
4.3. Influence of CaO/SiO2 Mass Ratio on the Surface Tension
The relation between the surface tension of the molten slag and CaO/SiO2 mass ratio was shown in Fig. 6. With the increase of CaO/SiO2 mass ratio, the surface tension goes up slightly from 413 mN/m up to 456 mN/m, and the calculated results based on the present model are in good agreement with the experimental values.
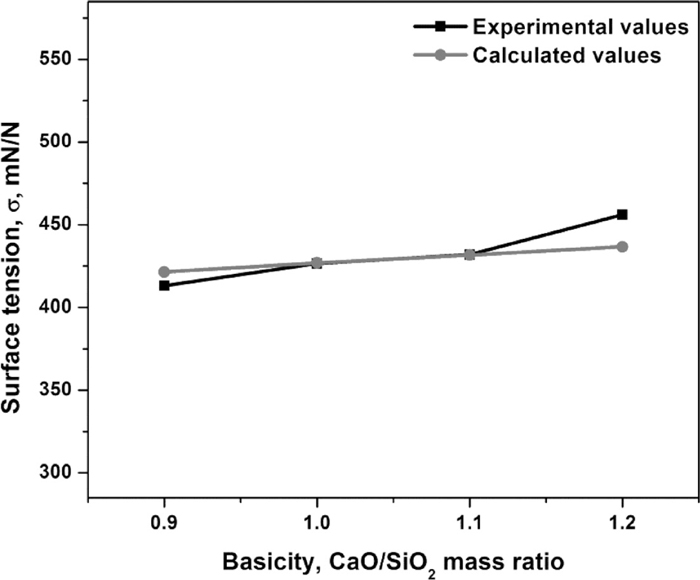
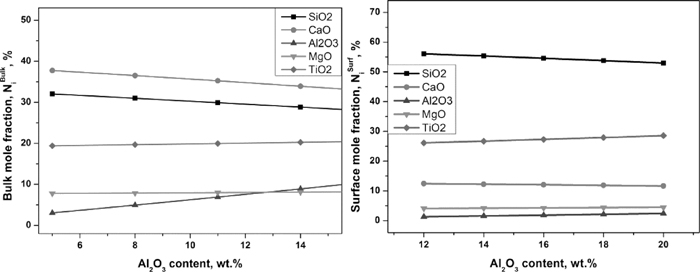
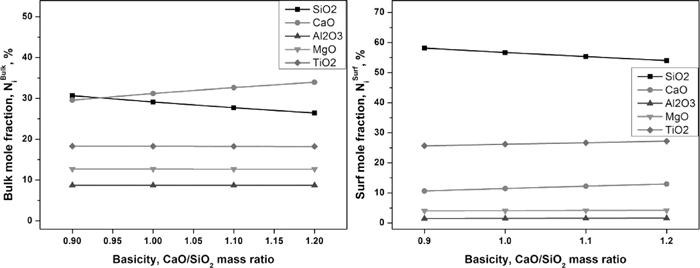
For one hand, the influence of compositional changes on the surface tension will be discussed firstly. Along with the increase of the CaO/SiO2 mass ratio, the mole fraction of SiO2 at the surface reduces slightly, but it is still the highest because of its lowest surface tension as shown in Fig. 7. The mole fraction for TiO2 at the surface is second highest because of the lower surface tensions as shown in Table 5. The mole fractions of MgO and Al2O3 at the surface are very low and do not change because of the fixed values. Although the mole fraction of CaO in the bulk is the highest, its mole fraction at the surface is only about 11.00%. The increase of the surface tension results from the decrease of the mole fraction for SiO2 with the lowest surface tension and the slight increase of the mole fraction for CaO.
For another, the influence of basicity on the melt’s structure has a similar effect with that of TiO2. The basicity can also promote the depolymerization of the slag structure, and the parameter, NBO/T will increase. The variation of the melt’s structure will decrease the surface tension of the slag, while the compositional changes at the surface, especially the reduce of SiO2 and the increase of CaO, play a more pronounced effect on the surface tension, which indicates that the melt’s structure only attenuates the rise of the surface tension of the slag.
4.4. Influence of MgO Content on the Surface Tension
Figure 8 shows the relationship between MgO mass fraction and the surface tension of the molten slag. The surface tension of the slag ascends slightly with the increase of MgO content. As shown in Fig. 9, the increase of the MgO content can promote the slight rise of its mole fraction at the surface tension, but its mole fraction is still at a low level, resulting in the rise of the surface tension of the molten slag. As for the TiO2, Al2O3 and CaO, their mole fractions at the surface does not change. Besides, the increase of MgO content results in the decrease of the mole fraction for SiO2 at the surface, which attenuates the growth rate of the surface tension for the slag.
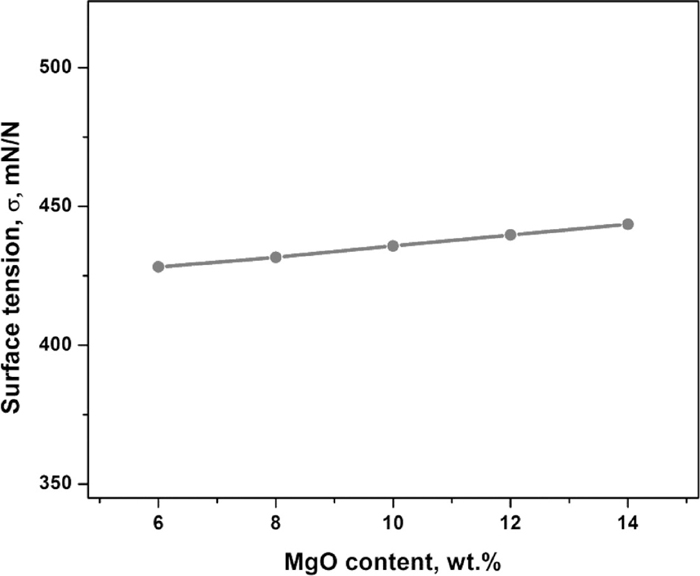
As for the influence of the melt’s structure on the surface tension, similar to the basicity. The parameter, NBO/T will increase along with the increase of MgO. The variation of the melt’s structure will decrease the surface tension of the slag, while the compositional changes at the surface, especially the reduce of SiO2 and the increase of CaO, play a more pronounced effect on the surface tension, which indicates that the melt’s structure only attenuates the rise of the surface tension of the slag. It should be pointed out that the increase of MgO has a more remarkable effect in the growth rate of the surface tension of the slag comparing with the increase of basicity.
4.5. Influence of Al2O3 Content on the Surface Tension
The dependency of the surface tension of the molten slag on Al2O3 content based on this present model is shown in Fig. 10. The surface tension of the slag increases slightly along with the increase of Al2O3 content. As shown in Fig. 11, there is little change for the distribution of the mole fractions of TiO2, MgO, Al2O3 and CaO with increasing the Al2O3 content, indicating that the compositional changes has no effect in the surface tension of the slag.
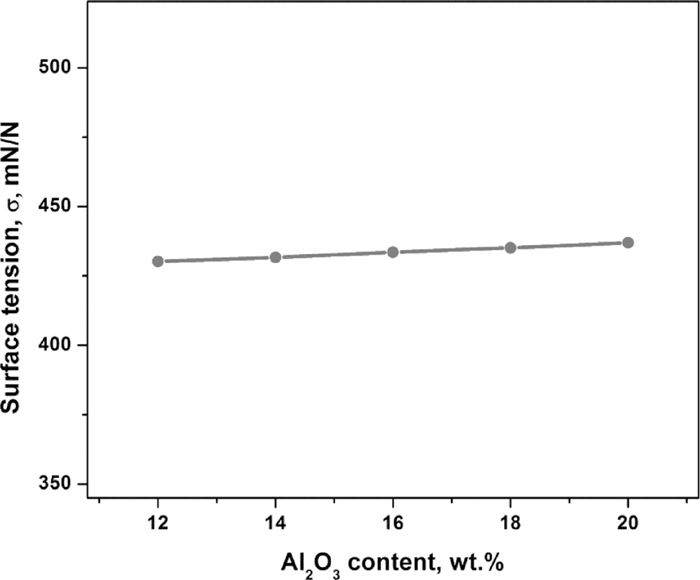
It is well known to us that Al2O3 is an amphoteric oxide, and is presents the alkalinity under the condition that CaO/SiO2 mass ratio equals to 1.10. Contrary to the influence of TiO2, MgO or basicity, the parameter, NBO/T will drops down along with the increase of Al2O3. In other words, the much more complicated units, such as Qn(Si) and Qn(Al) (Here n=1, 2), will turn into Qn(Si) and Qn(Al) (Here n=3, 4). As a result, the number of complicated units at the surface will reduce, and the number of the free oxygen with a bigger moment will increase. As a consequence, the surface tension of the melt will goes up because of the increase of the total ion moment at the surface. It should be pointed out that MgO has a greater effect on increasing the surface tension of the slag comparing with Al2O3 under the condition of the same quality.
4.6. Reproducibility
The comparison between the evaluated results and experimental surface tension values for the molten CaO–SiO2–MgO–Al2O3–TiO2 slag system has been studied. The reproducibility is evaluated as the error and the average error defined as Eqs. (8) and (9).
|
Error=
σ
Calc
-
σ
Expe
σ
Expe
×100%
| (8) |
|
Average error=
1
N
∑
1
N
|
σ
Calc
-
σ
Expe
σ
Expe
|
×100%
| (9) |
Where the
σExpe and
σCalc values correspond to the experimental surface tension values in the literature and the calculated surface tension, respectively.
N corresponds to the number of the literature data.
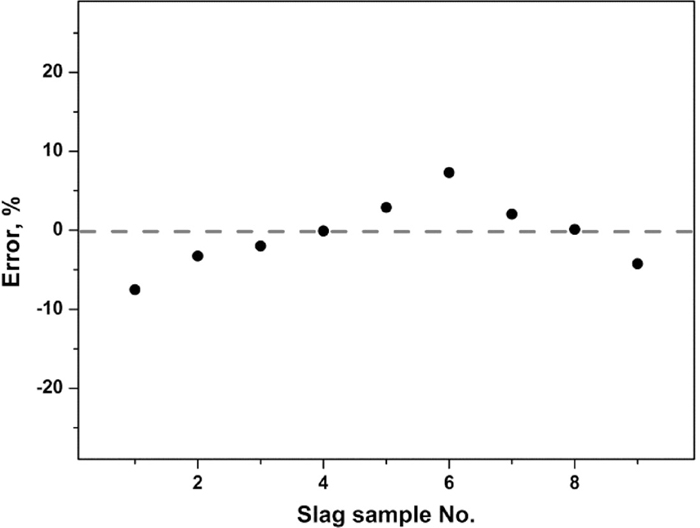
The maximum error between the calculated values and the measured results is –7.52% as shown in Fig. 12. The average error of the present model is 3.27%, showing that the evaluated surface tensions based on the present model are in good agreement with the experimental values.
5. Conclusions
The surface tension of the molten TiO2–CaO–SiO2–Al2O3–MgO blast furnace slag were determined by adopting the improved sessile drop method and the thermodynamic model for determining the surface tension of molten slag by considering the surface tension and molar volume of the pure oxide components, and their ionic radii was applied to molten slag bearing TiO2.
(1) The temperature dependence of the surface tension for pure TiO2 has been determined, and the linear relation is as follows:
|
σ
TiO
2
Pure
=1 384.3-0.6254*T mN/m
|
(2) For the 5-component slag system, the TiO2 can reduce the surface tension of the slag, proving that TiO2 is a surfactant. The decrease of the surface tension of the melt results from both the compositional changes and the structural change along with the composition variation. The increase of the CaO/SiO2 mass ratio can results in the rise of the surface tension for the slag, while the structural variation only attenuates the rise of the surface tension of the slag. Both MgO and Al2O3 can increase the surface tension of the slag, and MgO has a greater effect on increasing the surface tension of the slag comparing with Al2O3 under the condition of the same quality.
(3) The calculated surface tensions based on the present model are in good agreement with the experimental values, and the maximum error and the average error are –7.52% and 3.27%, respectively.
Acknowledgements
The authors are especially grateful to the National Natural Science Foundation of China (NSFC) (Grant No. 51090383).
References
- 1) K. Mukai: ISIJ Int., 32 (1992), 19.
- 2) Y. A. Minaev: Metallurgist, 50 (2006), 168.
- 3) N. Siddiqi, B. Bhoi, R. K. Paramguru, V. Sahajwalla and O. Ostrovski: Ironmaking Steelmaking, 27 (2000), 367.
- 4) D. Xie, Y. Mao and Y. Zhu: Proc. of 7th Int. Conf. on Molten Slags, Fluxes and Salts, The South African Institute of Mining and Metallurgy, South Africa, (2004), 28.
- 5) R. Jiang and R. Fruehan: Metall. Trans. B, 22 (1991), 481.
- 6) Y. Zhang and R. Fruehan: Metall. Trans. B, 26 (1995), 803.
- 7) Y. Ogawa, H. Katayama, H. Hirata, N. Tokumitsu and M. Yamauchi: ISIJ Int., 32 (1992), 87.
- 8) S. Y. Kitamura and K. Okohira: ISIJ Int., 32 (1992), 741.
- 9) Z. Yang, K. Wu and Z. Huang: Acta Metall. Sin., 24 (1988), 42.
- 10) D. Walker and O. Mullins, Jr.: Contrib. Mineral. Petrol., 76 (1981), 455.
- 11) D. Skupien and D. Gaskell: Metall. Trans. B, 31 (2000), 921.
- 12) W. Kingery: J. Am. Chem. Soc., 42 (1959), 6.
- 13) K. C. Mills: Proc. of Int. Conf. of Southern African Pyrometallurgy, Cradle of Humankind, South Africa, (2011).
- 14) R. Boni and G. Derge: J. Met., 8 (1956), 53.
- 15) T. Tanaka, K. Hack, T. Iida and S. Hara: Z. Metallkd., 87 (1996), 380.
- 16) T. Tanaka, K. Hack and S. Hara: Calphad, 24 (2000), 465.
- 17) G. Cheng and N. Liao: J. Iron Steel Res. Int., 6 (1999), 17.
- 18) J. Butler: Proc. R. Soc. A, 135 (1932), 348.
- 19) T. Tanaka, T. Kitamura and I. A. Back: ISIJ Int., 46 (2006), 400.
- 20) M. Nakamoto, A. Kiyose, T. Tanaka, L. Holappa and M. Hämäläinen: ISIJ Int., 47 (2007), 38.
- 21) M. Nakamoto, T. Tanaka, L. Holappa and M. Hämäläinen: ISIJ Int., 47 (2007), 211.
- 22) M. Hanao, T. Tanaka, M. Kawamoto and K. Takatani: ISIJ Int., 47 (2007), 935.
- 23) P. Shen, H. Fujii, T. Matsumoto and K. Nogi: Scr. Mater., 48 (2003), 779.
- 24) M. Hoorfar and A. W. Neumann: Adv. Colloid Interface Sci., 121 (2006), 25.
- 25) R. Shannon: Acta Crystallogr., A, 32 (1976), 751.
- 26) I. Sohn and D. J. Min: Steel Res. Int., 83 (2012), 611.
- 27) R. Knoche, D. Dingwell and S. Webb: Geochim. Cosmochim. Acta, 59 (1995), 22.