Regular Article
Relationship between Chemical Structure of Caking Additives Produced from Low Rank Coals and Coke Strength
2014 Volume 54 Issue 11 Pages 2426-2431
Details
2014 Volume 54 Issue 11 Pages 2426-2431
Coke strength can be enhanced by adding HyperCoals (HPC). HPC can be produced from different rank of coals including low rank coals. The aim of this study is to investigate and evaluate the usability of HPC from low rank coals as caking additive. 1H-NMR, solid state 13C-NMR, and elemental analysis were carried out to investigate the molecular structure of HPC prepared from low rank coals. The results showed that the number of aromatic rings in unit structure increased from 1-2 in original coals to 2-3 in HPCs extracted at 633 K. Effect of extraction temperature was also investigated and it was found that ratio of 3 aromatic rings increased in HPC extracted at 673 K, in comparison to HPC extracted at 633 K. The strength of cokes produced by adding HPC was directly a function of number of aromatic rings in the HPC and increased with increasing number of rings.
It is necessary to use caking coals to produce high quality coke. However, caking coal is expensive and its reserve amount is small. Therefore, a technology without reducing the quality and with increasing the blending ratio of the non- and/or slightly caking coals is desired. Generally, coke strength decreases with increasing the ratio of non- and/or slightly caking coals, however, it is possible to recover or improve the strength by adding HyperCoal (HPC) produced by the solvent extraction.1,2,3) Takanohashi et al.2) reported that coke strength increased by producing HPC from a caking coal and adding it to blending coals including 35 mass% of non- and/or slightly caking coal. Shishido et al.3) reported that the higher ratio of non- and/or slightly caking coals were blended, the more blending effect on the coke strength improved. Thus, adding HPC is effective to improve the strength of coke blended with non- and/or slightly caking coals.
On the other hand, since HPC can be produced from various coals including lignite and sub-bituminous4) coal, it is expected to produce HPC from cost-effective low-rank coals. Koyano et al.5) reported that when adding various poly–aromatic hydrocarbons to coals as caking additive, the coke strength increased in the cases of more than 4 aromatic rings and the effect enhanced with increasing the number of aromatic rings. Also comparing between the poly–aromatics with the same ring size, the coke strength improved more with peri-type compounds than cata-type ones.5)
It is previously reported that the average number of aromatic rings in low-rank coals is around 1-2.6) If the number of aromatic rings in HPC produced from low-rank coals is nearly equal (1-2 rings), the improvement of coke strength may not be expected, although it should not be easily compared with model compounds since their polarity or molecular weight are different. Moreover, since low-rank coals contain a large amount of oxygen functional groups,7) the plasticity of blending coals may significantly decrease. The details on the molecular structure of HPC and the mechanism of its effect have not been clarified so far.
In the current work, structural analysis of HPC produced from low-rank coals on various extraction conditions was performed in order to clarify its molecular structure and characteristics. By adding those HPC to slightly caking coal, the effect on coke strength and its relationship to molecular structure was investigated.
Two Indonesian low-rank coals, Pasir (Pa) sub-bituminous coal and Mulia (Mu) lignite coal, were used to produce HPC by solvent extraction. One Chinese coal, Kouryusho (KRS) slightly caking coal, was used as a standard coal for cokemaking. Low-rank coals were ground to under 0.15 mm and the standard coal was ground to 0.42–1.0 mm, 0.15–0.42 mm and under 0.15 mm, respectively. Ground coals were dried in vacuo at 353 K for 12 hours. Ultimate analysis and ash content of coal samples are shown in Table 1.
| mass%, daf | H/C | O/C | Ash mass%, db | |||||
|---|---|---|---|---|---|---|---|---|
| C | H | N | S | O (diff.) | ||||
| Mulia | 57.2 | 5.6 | 0.8 | 0.1 | 36.3 | 1.17 | 0.48 | 2.6 |
| Pasir | 66.0 | 5.4 | 1.2 | 0.2 | 27.2 | 0.98 | 0.31 | 5.5 |
| KRS | 80.0 | 5.2 | 1.6 | 0.4 | 12.8 | 0.78 | 0.12 | 7.7 |
A semi-flowing extractor was used for thermal solvent extraction. Schematic of extraction apparatus is shown in Fig. 1. Around 2.5 g of coal was set on a stainless filter in an extractor, and purged with N2 of 1.0 MPa initial pressure. The sample cell was filled with 1-methylnaphthelene (1MN) and heated up to the extraction temperature (633 K or 673 K) and 1MN was continuously injected into the system at a flow rate of 0.4 ml/min for 60 min. The extract solution was dissolved into 40 times volume of hexane and separated into soluble part (1MN and hexane soluble part) and insoluble one. The insoluble part was dried in vacuo at 353 K for 12 hours. This dried insoluble part was defined as HPC. Henceforward, HPC produced from low-rank coals was represented as Mu-360, Mu-400, Pa-360 and Pa-400, respectively (e.g. Mu-360 means HPC produced from Mulia coal at 633 K). Additionally, for comparison, HPC (BIT-380) produced from a bituminous coal by using bench scale HPC plant (0.1 t/d) was used for HPC sample.

Schematic of semi-flowing extractor.
The extract obtained from the ultrasonic extraction with CS2/Pyridine mixed solvent (1:1 by volume) at room temperature was also used, in order to examine possibility of chemical reactions during thermal solvent extraction described above. These room-temperature extracts produced from Mu and Pa were represented as Mu-RT and Pa-RT, respectively.
Ultimate analysis of these extracts is shown in Table 2.
| Sample | mass%, daf | H/C | O/C | ||||
|---|---|---|---|---|---|---|---|
| C | H | N | S | O (diff.) | |||
| BIT-380 | 86.2 | 5.9 | 1.8 | 0.6 | 5.5 | 0.82 | 0.05 |
| Mu-RT | 72.7 | 7.4 | 0.8 | 0.1 | 19.0 | 1.22 | 0.20 |
| Mu-360 | 76.0 | 5.5 | 0.9 | 0.3 | 17.3 | 0.87 | 0.17 |
| Mu-400 | 78.7 | 5.3 | 1.3 | 0.5 | 14.2 | 0.81 | 0.14 |
| Pa-RT | 71.1 | 7.0 | 1.2 | 0.2 | 20.5 | 1.18 | 0.22 |
| Pa-360 | 77.7 | 5.5 | 1.3 | 0.3 | 15.2 | 0.85 | 0.15 |
| Pa-400 | 79.2 | 5.3 | 1.6 | 0.5 | 13.4 | 0.80 | 0.13 |
The aromaticity (fa) and hydrogen type distribution were measured by liquid state 1H-NMR (Lambda500, JEOL). CS2/pyridine-d5 (1:1 by volume) was used for solvent. Hydrogen types were classified to 4 types. The one was aromatic hydrogen (Har, 6.0–10.0 ppm). The others were aliphatic hydrogen, Hα (2.0–5.0 ppm), Hβ (1.1–2.0 ppm) and Hγ (0.2–1.1 ppm).
The aromatic carbon ratio (fa) and hydrogen type distribution were measured by liquid state 1H-NMR (Lambda500, JEOL). CS2/pyridine-d5 (1:1 by volume) was used for solvent. Hydrogen types were classified to 4 types, aromatic hydrogen; Har (6.0–10.0 ppm), aliphatic hydrogen attached on carbon at α position; Hα (2.0–5.0 ppm), at β position; Hβ (1.1–2.0 ppm) and at γ position; Hγ (0.2–1.1 ppm).
2.4. Solid State 13C-NMR MeasurementOxygen type distribution and fa were measured by solid state 13C-NMR (CMX-300, JEOL). Oxygen type distribution for room-temperature extract was assumed as similar to the values for original coal, because it was not solid state, like a pitch. Classification of the 13C-NMR spectrum was determined by reference to the literature;8) aliphatic carbon (Cali, 0–93 ppm) and aromatic one (Car, 93–171 ppm).
In this paper, it was assumed that there were three oxygen types, phenolic hydroxyl group (148–171 ppm), carboxyl group (171–200 ppm) and ether. The oxygen content of ether type was calculated from the total oxygen content minus the phenolic hydroxyl and carboxyl ones.
2.5. Coke Strength MeasurementCoke sample was produced from KRS by adding HPC. The adding HPC amount was 3 mass%. In case adding HPC, to avoid the effect of coal particle size distribution, under 0.15 mm of coal was replaced by HPC. Particle size distribution of coal for cokemaking is shown in Table 3.
| Sample | Particle size | No additive | 3% additive |
|---|---|---|---|
| KRS | 0.42–1.0 mm | 33 mass% | 33 mass% |
| 0.15–0.42 mm | 33 mass% | 33 mass% | |
| Under 0.15 mm | 34 mass% | 31 mass% | |
| Additive | Under 0.15 mm | 0 mass% | 3 mass% |
Schematic of cokemaking and strength measurement is shown in Fig. 2. Approximately 5 g blended coal sample was put into baking vessel. Bulk density of blended coal was 800 kg/m3. Packed sample was carbonized under a weight load of 6.24 kPa (200 g) and N2 flow by muffle oven (FO410, Yamato). The oven was heated up from room temperature to 1273 K at 3 K/min heating rate. Once temperature reached 1273 K, the sample was held for 30 min and cooled down to 473 K in N2 flow. After cool down, the coke was taken out from the baking vessel and was used for strength measurement. Generally three coke pieces were produced in one condition.

Schematic of cokemaking and strength measurement.
The coke compressive load was measured using an Auto Graph (AG-IS-5kN, SHIMADZU). Coke indirect tensile strength was calculated by Eq. (1).9)
| (1) |
In here, S is coke indirect tensile strength (MPa), P is failure load (N), r is sample radius (mm), l is sample thickness (mm). r and l of produced coke were approximately 8.7 mm and 11.0 mm, respectively. The strength data were plotted on a Weibull plot, and the value corresponding to the scale parameter was defined as the coke representative strength.
Yields of extract, residue and gas + hexane soluble are shown in Fig. 3. Here, the yield of gas + hexane soluble is the value of coal organic components minus yields of residue and extract. In comparison between the room-temperature extraction and the 633 K extraction, HPC (extract) yield increased from 8.1% to 20.0% for Pa, from 13.6% to 18.0% for Mu. From the result of ultimate analysis in Table 2, the H/C atomic ratio decreased from 1.18 to 0.85 for Pa, from 1.22 to 0.87 for Mu and came close to the value of BIT-380 produced from bituminous coal (H/C : 0.82). The O/C atomic ratio also decreased from 0.22 to 0.15 for Pa, from 0.20 to 0.17 for Mu and slightly approached to the value of BIT-380 (O/C : 0.05). In addition to the above results, the production of a significant amount of gas and hexane soluble indicates the occurrence of chemical reaction such as thermal decomposition in both coals at 633 K extraction.

Results of solvent extractions at room temperature, 633 K and 673 K.
Furthermore, at 673 K extraction, HPC yield increased to 26.4% for Pa, and to 20.0% for Mu. Also H/C and O/C decreased to 0.80 and 0.13 for Pa, 0.81 and 0.14 for Mu, which means H/C became almost the same as the value of BIT-380, and O/C also came closer to it. From these results, it was expected that further chemical reaction has progressed at 673 K extraction.
3.2. Structural Analysis 3.2.1. 1H-NMR SpectrumTable 4 shows hydrogen type distribution and the number of hydrogen type per 100 carbons. In the 633 K extraction, Har fraction significantly increased from 15.7% to 43.9% for Pa, from 18.0% to 42.7% for Mu, in comparison with room-temperature extraction. On the other hand, Hβ and Hγ fraction showed a tendency to decrease. From the above results, it is indicated that as chemical reaction such as thermal decomposition progressed at 633 K extraction, aromatic hydrogen (Har) increased and conversely aliphatic hydrogen (Hβ and Hγ) decreased.
| Sample | Hydrogen fraction [%] | Number of Hydrogen [–/100 Carbons] | ||||||
|---|---|---|---|---|---|---|---|---|
| Har | Hα | Hβ | Hγ | Har | Hα | Hβ | Hγ | |
| BIT-380 | 40.6 | 29.1 | 24.4 | 6.0 | 33.4 | 24.0 | 20.1 | 4.9 |
| Mu-RT | 18.0 | 19.8 | 41.7 | 20.6 | 6.1 | 26.6 | 61.6 | 28.7 |
| Mu-360 | 42.7 | 15.6 | 33.9 | 7.8 | 28.3 | 16.0 | 34.7 | 8.0 |
| Mu-400 | 37.4 | 20.4 | 32.9 | 9.3 | 30.4 | 16.6 | 26.7 | 7.6 |
| Pa-RT | 15.7 | 19.3 | 44.4 | 20.7 | 17.8 | 24.3 | 51.5 | 25.3 |
| Pa-360 | 43.9 | 18.1 | 30.3 | 7.6 | 29.5 | 18.0 | 30.2 | 7.6 |
| Pa-400 | 41.9 | 23.2 | 27.9 | 7.1 | 33.6 | 18.6 | 22.4 | 5.7 |
From the number of hydrogen type per 100 carbons, at 673 K extraction Har increased to 33.6 for Pa and 30.4 for Mu, and Hβ and Hγ fraction decreased.
3.2.2. 13C-NMR SpectrumFigures 4 and 5 shows solid state 13C-NMR spectrum of Pa and Mu. The results were standardized to be the same spectrum area. Comparing the spectrum of raw coal with that of 633 K extraction, it is identified that for both coals, the aromatic carbon ratio increased and the aliphatic carbon decreased at 633 K extraction. In 673 K extraction, this increase/decrease progressed more and the spectrum came close to that of BIT-380.

Solid state 13C-NMR spectrum (a)comparison of Pasir coal with Pa-360 (b)comparison of BIT-380, Pa-360 and Pa-400.

Solid state 13C-NMR spectrum (a)comparison of Mulia coal with Mu-360 (b)comparison of BIT-380, Mu-360 and Mu-400.
Table 5 shows the oxygen type distribution and the number of oxygen type per 100 carbons. The number of oxygen per 100 carbons in carboxyl group decreased for both coals at 633 K extraction. It became 4.4 from 7.4 for Pa, 4.9 from 5.4 for Mu. Those values decreased more at 677 K extraction, to 2.5 for Pa and to 2.6 for Mu. The above results indicate that the thermal solvent extraction caused decarboxylation reaction. From the number of oxygen type per 100 carbons, the phenolic hydroxyl group of Mu has not decreased so much even at 677 K extraction, but that of Pa slightly decreased according to thermal solvent extraction. About the ether oxygen, for both coals, the number per 100 carbons decreased at 633 K extraction but had no change at 677 K. From the above results, it is clarified that the decrease of O/C by thermal solvent extraction was mainly caused by decarboxylation reaction.
| Sample | Oxygen fraction [%] | Number of Oxygen [–/100 Carbons] | ||||
|---|---|---|---|---|---|---|
| COOH | Ar–OH | -O-(diff.) | COOH | Ar–OH | -O-(diff.) | |
| BIT-380 | 19.8 | 80.2 | 0.0 | 1.0 | 3.9 | 0.0 |
| Mu-RT* | 27.4 | 44.2 | 28.4 | 5.4 | 8.7 | 5.6 |
| Mu-360 | 28.1 | 54.5 | 17.3 | 4.9 | 9.5 | 3.0 |
| Mu-400 | 19.3 | 60.3 | 20.4 | 2.6 | 8.1 | 2.8 |
| Pa-RT* | 34.2 | 49.3 | 16.5 | 7.4 | 10.6 | 3.6 |
| Pa-360 | 29.5 | 53.6 | 16.9 | 4.4 | 8.0 | 2.5 |
| Pa-400 | 19.6 | 59.7 | 20.7 | 2.5 | 7.6 | 2.6 |
The several structural parameters were calculated by using ultimate analysis, hydrogen/oxygen type distribution, and aromatic carbon ratio (fa) which was measured by solid state 13C-NMR or by the modified Brown-Ladner method for room-temperature extracts.
For the calculation, structural analysis program proposed by Sato10) was used. Here it was assumed that all of sulfur type was thiophene, and for nitrogen, on the basis of the result of Pa-360 by XPS,11) 25% was pyridine ring, 75% was pyrrole ring and there was no quaternary nitrogen. Table 6 shows main structural parameters per unit structure; the degree of aromatic ring condensation: Cp/Car, the number of aromatic rings: Ra, the number of naphthenic rings: Rna, the degree of aromatic ring substitution: σ, the number of nitrogen, sulfur and oxygen. In here, unit structure means the average molecular structure composed of a fused aromatic ring and side chains.
| Sample | fa (±0.03) | Cp/Car | Ra | Rna | σ | Number of Heteroatom [–/1 unit] | |||
|---|---|---|---|---|---|---|---|---|---|
| 13C | 1H | N | S | O | |||||
| BIT-380 | 0.71 | 0.76 | 0.60 | 4.6 | 1.5 | 0.35 | 0.4 | 0.1 | 1.1 |
| Mu-RT | – | 0.45 | 0.97 | 1.1 | 1.0 | 0.72 | 0.2 | 0.0 | 3.7 |
| Mu-360 | 0.65 | 0.72 | 0.79 | 2.1 | 0.6 | 0.39 | 0.2 | 0.0 | 2.7 |
| Mu-400 | 0.69 | 0.76 | 0.64 | 2.9 | 0.6 | 0.35 | 0.3 | 0.1 | 2.4 |
| Pa-RT | – | 0.52 | 0.83 | 1.8 | 1.8 | 0.82 | 0.3 | 0.1 | 5.2 |
| Pa-360 | 0.64 | 0.73 | 0.74 | 2.6 | 0.1 | 0.36 | 0.2 | 0.0 | 2.4 |
| Pa-400 | 0.70 | 0.78 | 0.69 | 2.7 | 0.4 | 0.32 | 0.3 | 0.1 | 2.1 |
Cp: Peripheral carbon number of aromatic rings
Car: Carbon number of aromatic rings
Cp/Car: Degree of aromatic ring condensation
Ra: Number of Aromatic rings
Rna: Number of Naphthenic rings
σ: Degree of aromatic ring substitution
Ra for both coals was 1-2 at room temperature, and it increased to 2-3 at 633 K extraction. Also Rna decreased from 1.8 to 0.1 for Pa, from 1.0 to 0.6 for Mu.
It was considered that the increase of Ra at 633 K extraction was caused by the occurrence of aromatization reaction as well as the extraction of heavy components along with the increasing extraction yield. One possible chemical reaction may be aromatization reaction by dehydrogenation of naphthenic ring.
At 673 K extraction, Ra increased to 2.7 for Pa and 2.9 for Mu. It is estimated that at higher extraction temperature, heavier components were extracted and aromatization reaction progressed more.
3.2.4. Average Molecular StructureFigure 6 shows the average molecular structure per unit structure satisfied with structural parameters. The percentage indicates the ratio of its presence for each. For BIT-380 it became peri-type structure with 4-5 aromatic rings. As mentioned before, in case of model compounds, improvement of coke strength was observed from more than 4 rings and the effect was better in peri-type structure.5) Thus, this result of structural analysis also indicates that BIT-380 has enough improvement effect for coke strength.
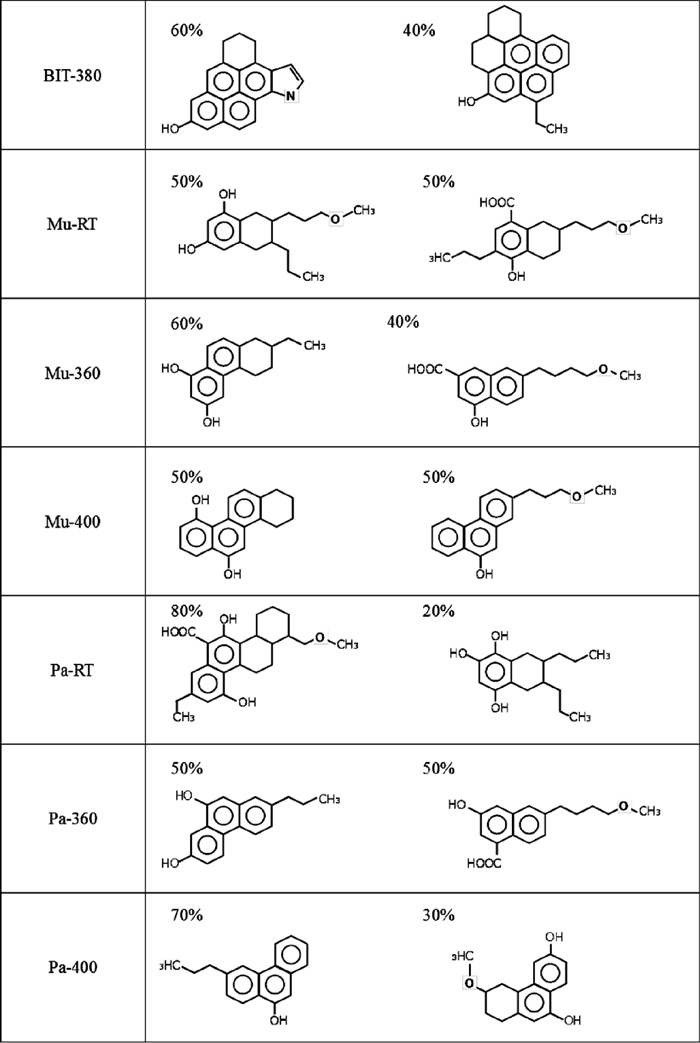
Average molecular structure of extracts.
The room-temperature extract from Mu was consisted of 1 aromatic ring with relatively long side chains. At 633 K extraction, its Ra increased to 2 and the length of side chain decreased.
The room-temperature extract from Pa had 1-2 aromatic rings, and the numbers of naphthenic ring and substituent groups was larger than Mu-RT. At 633 K extraction, Rna decreased and heavier component (2-3 aromatic rings) was obtained. Similar to Mu, the decrease of oxygen and side chain was also confirmed. At 673 K extraction, the percentage of 3 rings increased and the length of side chain became shorter.
3.3. Coke StrengthCoke yield, shrinkage ratio and bulk density are shown in Fig. 7. The coke yield was decreased by adding HPC. The shrinkage ratio was decreased by adding Mu-360 or Pa-360. However, in case adding BIT-380, Mu-400 or Pa-400, the shrinkage ratio was increased. It is possible that coal plastic property was improved by adding BIT-380, Mu-400 and Pa-400. The bulk density was decreased by adding HPC. This is because of the decrease of coke yield. However, comparing the effect of adding HPC extracted by 633 K with 673 K from the same low-rank coal, the coke yield became similar value, but the shrinkage ratio of coke adding HPC extracted at 673 K was higher than that at 633 K. As a result, the bulk density of coke adding HPC extracted at 673 K was higher than that at 633 K and approached to that of coke adding BIT-380.

Yield (a), shrinkage ratio (b) and bulk density (c) of the coke.
Weibull plot of coke indirect tensile strength is shown in Fig. 8. In this figure, m represents coke strength dispersion (higher value of m means smaller dispersion) and η is the representative coke indirect tensile strength (coke indirect tensile strength in case of cumulative crushing probability of 63.2%). KRS coke was the standard coke sample and η became 0.62 MPa. In case adding BIT-380, the coke strength was absolutely improved (η of coke added BIT-380 was 2.02 MPa). In case adding HPC extracted at 633 K (Mu-360 and Pa-360), the coke strength almost did not change. On the other hand, by adding HPC extracted at 673 K the coke strength was improved (Mu-400 : 1.01 MPa, Pa-400 : 0.83 MPa).

Weibull plot of coke strength.
The representative coke indirect tensile strength was plotted as a function of Ra of added HPC, as shown in Fig. 9. Higher coke strength was obtained in case of higher Ra. It was indicated that the coke strength was influenced by Ra of HPC. Similar result was reported in the previous study.5) In that report, the coke strength was decreased by adding model compound which is consisted of less than 3 aromatic rings. In this work, Ra of Mu-400 and Pa-400 was less than 3, however, these additives improved the coke strength. Koyano et al.5) reported that if molecular weight of additive is larger, its boiling point is higher, and much more fraction of poly-aromatic hydrocarbons should contribute to co-fusing. As a result, the additive improves the coal plastic property. In the current work, the unit average molecular structure of HPC was consisted of around 3 aromatic rings (as shown in Fig. 6). However, actual molecular structure is considered to be consisted of higher molecular-weight components connected by methylene and ether bonds etc.. Thus, even HPC composed of average rings of 2-3 may have significantly high boing point. Also, as shown in Figs. 4 and 5, since HPC has oxygen functional groups, those form hydrogen bonds easily, resulting in inhibition of volatilization of HPC itself. Furthermore, it was considered that the boiling point of HPC increased because the Ra was increased with increasing extraction temperature. Takanohashi et al.2) investigated the effect of extraction temperature on dynamic viscoelasticity of HPC produced form low-rank coal and reported that resolidification temperature of the HPC increased with increasing extraction temperature. Due to the above reasons, it was concluded that HPC produced from low-rank coals at 673 K improved the coke strength.

Relationship between number of aromatic rings of additive and coke tensile strength η.
HPC produced from bituminous and low-rank coals was investigated by liquid state 1H-NMR, solid state 13C-NMR and ultimate analysis. On the basis of these results, the average molecular structure was estimated and the effect of thermal solvent extraction on the chemical structure was investigated. Also, the strength of coke adding HPC produced from low-rank coals was measured to evaluate the effect of the chemical structure of HPC on coke strength. As a result, the following conclusions were obtained.
(1) Decarboxylation and aromatization reactions were occurred by 633 K and 673 K extractions for low-rank coals. Consequently, fa increased and H/C and O/C decreased, and then these parameters approached to HPC produced from bituminous coal.
(2) The average molecular structure of HPC was estimated. Ra of HPC produced from bituminous coal was 4-5 and its molecular structure was peri-type. While, in case of low-rank coals, Ra increased with the extraction temperature. Ra of the extract obtained at room temperature and 633 K were consisted of 1-2 (Mu-RT : 1.1, Pa-RT : 1.8) and 2-3 (Mu-360 : 2.1, Pa-360 : 2.6), respectively. Also, when HPC was produced at 673 K, the ratio of 3 aromatic rings increased.
(3) The coke strength increased with Ra of HPC. In the previous study, the coke strength decreased by adding model compounds consisted of less than 3 aromatic rings. However, in this work, the coke strength increased by adding HPC which Ra was less than 3. It can be attributed to the difference in the boiling point. Since molecular weight of HPC can be larger than that of model compounds and HPC has oxygen functional groups, it is expected that even HPC composed of average rings of 2-3 has significantly high boing point. As a result, most of HPC remains in coke without volatilizing and contributes to improvement of coke strength.
This work has been done in Development of Cokemaking Technology from Low-grade and Nonconventional Carbon Resources, Division of High-Temperature Processes, Academic Society, the Iron and Steel Institute of Japan. The authors would like to acknowledge the research group members gratefully.