Regular Article
Analysis on Inherent Characteristics and Behavior of Recycling Dust in Freeboard of COREX Melter Gasifier
2014 Volume 54 Issue 12 Pages 2737-2745
Details
2014 Volume 54 Issue 12 Pages 2737-2745
The generator gas of melter gasifier inevitably carries a lot of dust, which would be transported to the freeboard for recycling, as a result of the existence of the fluidized bed. The recycling dust, with an attractive concentration of C and Fe, is considered as a useful secondary material, thus it is important to investigate the inherent characteristics and behavior of recycling dust in the freeboard. In the present work, the recycling dust characteristics are investigated through the granulometry, chemical, mineralogical and micro analysis. The recycling dust has an irregular shape and an uneven granulometric distribution with the following primary minerals: Fe, FeO, SiO2, 2CaO·SiO2 and 2CaO·Al2O3·SiO2. Furthermore, a three-dimensional mathematical model at steady state is developed to describe the recycling dust combustion and the freeboard temperature distribution, which significantly influences the recycling dust behavior. The region of high temperature above 3000 K can be observed in front of DB due to the combustion of C in the recycling dust, with a combustion ratio of almost 100%. Based on the above analysis, the recycling dust behavior is complex. Fe and FeO in the recycling dust may be oxidized and finally smelts into liquid iron, while other minerals smelt into molten slag. It is worth noting that the phenomena of circulation and accumulation of alkali metals, ZnO and S could occur, despite that most of them are discharged out of the melter gasifier through the generator gas and molten slag.
The COREX process, which has been the successfully applied in industrial scale production in South Africa, South Korea, India and China, is one of the most promising alternative ironmaking processes independent from coking coal while capable of meeting the environmental requirements.1,2,3) The most innovative characteristic of COREX process is that all metallurgical work is carried out in two separate process reactors, namely pre-reduction shaft furnace and melter gasifier. The pre-reduction shaft furnace is placed above the melter gasifier to facilitate the gravity-induced descent of the material.4,5) According to the physical state of the burden mixture and the different conditions of the chemical reactions, the melter gasifier, as shown in Fig. 1, could be divided into five zones from bottom to top, which are hearth, raceway, moving bed, fluidized bed and freeboard respectively.6,7,8,9,10,11,12,13)

Schematic diagram of COREX melter gasifier.
Due to the existence of the fluidized bed, the generator gas of melter gasifier inevitably carries a lot of dust. The generator gas enters 4 hot gas cyclones for dedusting. Then the dust separated from the generator gas is transported by the conveying gas (nitrogen) to the freeboard for recycling. 4 dust burners (DB) and 6 oxygen burners (OB) are installed in the bottom of freeboard to convey recycling dust and oxygen. Practical production shows that the recycling dust contains a considerable amount of carbon. The combustion of the carbon in the recycling dust with oxygen releases a large amount of heat that will impact the freeboard temperature, which should be maintained within a certain range. An inadequate freeboard temperature would lead to the issue that the hydrocarbons in the coal could not crack completely and the tar generates to block the generator gas nozzle, while an excessive freeboard temperature may result in the burnout of the refractory and the device in the freeboard, especially the distribution system. In addition, the dust in the generator gas with higher temperature would soften and bond together to block the generator gas nozzle. Practical production shows that the generator gas temperature should be kept from 1303 K to 1363 K.
Therefore, the freeboard is an important region in COREX melter gasifier. Sun et al.14) analyzed the influence of operation parameters on the generator gas temperature through statistical and theoretical calculation. Liu et al.15) developed a one-dimensional model to analyze the devolatilization of lump coal falling in the freeboard. However, the recycling dust combustion in the freeboard could not be derived from their works. Berger et al.16) investigated the recycling dust combustion in front of DB by using different numerical approaches. However, the calculated generator gas temperature was 1174 K, which was significantly lower than the measured data. Sun et al.17) simulated the freeboard temperature fields under the conditions of fully open OBs and fully closed OBs by introducing a three-dimensional model ignoring the drag force of particles. However, the calculated results proved to be unsatisfactory as a result of the poor mesh quality. As can be seen from the above introduction, the work related to the inherent characteristics and behavior of recycling dust in the freeboard is limited.
Firstly, the recycling dust characteristics, including particle size distribution, chemical composition, mineralogical composition and morphology, are analyzed in the present work. These data will be applied to the mathematical model. Secondly, a modified three-dimensional mathematical model at steady state, which takes the drag force of particles and the turbulence model into consideration, is developed to describe the recycling dust combustion. The inner characteristics of the freeboard, especially the temperature distribution, are also analyzed. Thirdly, based on the recycling dust characteristics and the freeboard temperature distribution, the recycling dust behavior is further discussed.
The recycling dust was sampled from COREX-3000, the largest plant with a design production capacity of 1.5 million tons of hot metal per year, in China. As a preparation step, it was dried for 4 h at 378 K and stored in a desiccator. The recycling dust was characterized through granulometry analysis, chemical analysis, mineralogical analysis and micro analysis.
2.1. Granulometry AnalysisThe particle size distribution of the recycling dust is shown in Fig. 2. It can be seen that the particle size distribution is heterogeneous with a range between 5.03 and 91.09 μm. The mean particle size of the recycling dust is 28.88 μm, which is larger than other typical steel plant metallurgical dusts, such as the sintering dust and the electric arc furnace dust,18,19) and similar to the blast furnace dust.20) Such an uneven granulometric distribution probably results from the following aspects. (1) The source of the recycling dust is complex. When the burden materials, including direct reduction iron (DRI) from the pre-reduction shaft furnace, lump ore and flux, falls onto the moving bed surface through the freeboard which is as high as 14 m, part of the materials could breakup, and produce a lot of dust. On the other hand, along with the rapid heating process and gasification process of the lump coal in the moving bed, a lot of dust is generated by the thermal crack of lump coal. (2) Some smaller sized particles could agglomerate to form larger sized particles, which will be discussed later.

Particle size distribution of recycling dust.
The chemical analysis result of the recycling dust is presented in Table 1. The chemical composition of the recycling dust depends on its source, which has been discussed above. The main compositions include C, Fe, CaO, SiO2, Al2O3 with a total mass fraction up to 90%. Especially the sum of the total C and Fe, which are useful elements in COREX process, is higher than 80%, making recycling dust a valuable secondary material. Wasting of resources can be avoided by recycling these dusts. In addition, iron exists in the form of hematite, magnetite, wustite and metallic iron. However, since the DRI, the source of iron in the recycling dust, is composed of wustite and metallic iron,4,5) the recycling dust only contain wustite and metallic iron. On the other hand, the reduction reaction condition of dust is relatively better in the generator gas pipe, considering the smaller particle diameter, the higher gas temperature and reduction potential that contribute to the reduction of wustite in the dust, which leads to the higher metallization ratio of the recycling dust.
| TC | TFe | MFe | CaO | SiO2 | MgO | Al2O3 | MnO | ZnO | K2O | Na2O | P | S |
|---|---|---|---|---|---|---|---|---|---|---|---|---|
| 35.00 | 47.10 | 42.45 | 4.70 | 5.40 | 1.40 | 3.20 | 0.10 | 0.01 | 0.39 | 0.10 | 0.04 | 0.99 |
The mineralogical characterization of the recycling dust was performed by X-ray diffraction (XRD) analysis. The XRD pattern of the recycling dust is shown in Fig. 3. It can be seen that metallic iron (Fe), wustite (FeO), quartz (SiO2), calcium silicate (2CaO·SiO2) and gehlenite (2CaO·Al2O3·SiO2) are present in the recycling dust. It indicates that SiO2 could form three kinds of minerals in the recycling dust. Furthermore, since carbon from the lump coal exists in the form of amorphous carbon and other micro-composition, including MgO, MnO and ZnO, is relatively low in concentration, they could not be verified by XRD.
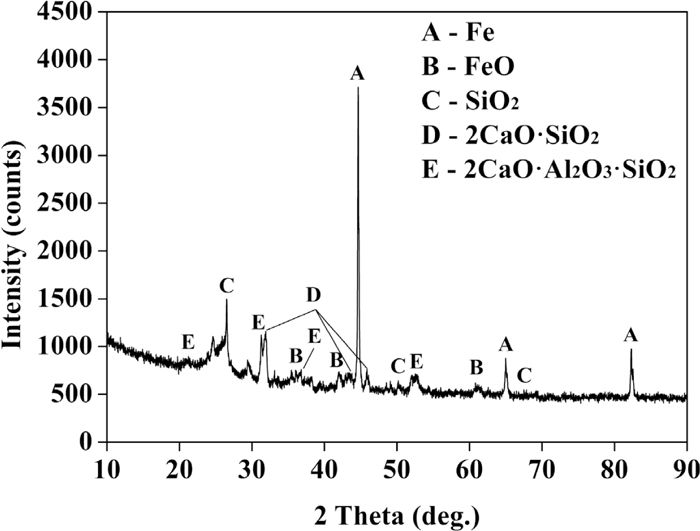
XRD pattern of recycling dust.
Scanning electron microscopy (SEM) was used to gain further knowledge of the morphology and structure of the recycling dust. The scanning electron micrograph of recycling dust with a magnification of 500× is shown in Fig. 4. The shape of recycling dust appears irregular. The agglomeration between the smaller sized particles can be observed clearly. Through X-ray energy dispersive spectrometry (EDS), it can be seen that a large proportion of metallic iron, wustite and some gangue exist in the white agglomeration, and part of carbon is wrapped by metallic iron. In addition, the EDS analysis shows that the smooth, black particles are carbon from the lump coal.

Scanning electron micrograph (magnification 500×) of recycling dust. Where: A: Agglomeration with metallic iron, wustite and some gangue, C: Carbon.
A modified three-dimensional mathematical model at steady state is developed to analyze the recycling dust combustion. The diameter and chemical composition of recycling dust measured above are applied to this model. In addition, the freeboard temperature distribution is discussed in detail, which exerts a significant influence on the recycling dust behavior.
3.1. Model Formulation 3.1.1. Governing Equation and Chemical ReactionsThe governing equations for the gas phase and particle phase are summarized in Table 2. The gas phase is treated as a continuum phase using the Eulerian method. The gas flow is solved by a set of three-dimensional steady state Reynolds averaged Navier-Stokes equations. The particle phase is treated as a dispersed phase using the Lagrangian method. The discrete particles trajectories are determined by the Newton’s second law of motion without considering the interaction among particles. The drag force and the turbulence dispersion are considered in calculating the particle movement. In addition, the changes of gas and particle temperature are governed by three physical processes: convection heat transfer, radiative heat transfer and heat transfer associated with mass transfer.
| Gas phase | Particle phase | |
|---|---|---|
| Mass |
|
|
| Momentum |
|
|
|
| ||
| Energy |
|
|
|
| ||
| Gas species |
| |
| Turbulent kinetic energy |
| |
| Turbulent dissipation rate |
| |
The chemical reactions considered in this model are as listed in Table 3. The heterogeneous reactions, including carbon combustion, Boudouard reaction and water gas reaction, are calculated based on the multiple surface reaction model.23) The eddy dissipation model24) is used to simulate the homogeneous reactions, including the combustions of CO and H2. In order to simplify the model, other possible chemical reactions, including oxidation of Fe and FeO, gangue melting and alkali metals gasification that will be discussed later, are not considered, because of their relatively lower heat release or absorption, reaction rate and oxygen consumption compared with the carbon combustion. Thus ignoring these reactions has little effect on the recycling dust combustion and freeboard temperature distribution.
| Chemical reactions | Reaction rates expressions |
|---|---|
| C+1/2O2→CO |
|
| C+CO2→2CO |
|
| C+H2O→CO+H2 |
|
| CO+1/2O2→CO2 |
|
| H2+1/2O2→H2O |
The schematic diagram of the COREX melter gasifier freeboard is shown in Fig. 5, and the arrangement diagram of DB and OB is described in Fig. 6. The DBs and the OBs enter the freeboard with a 8° angle to the horizontal. The DB is coaxial, with the recycling dust and the conveying gas (nitrogen) in the inner tube, and oxygen in the annular region. In addition, extra oxygen is fed through the OB. The typical plant operating parameters of COREX melter gasifier, as listed in Table 4, are used as the boundary conditions. As for the wall, the free-slip condition is applied at the wall boundary. At any point along the wall, the energy wall function is used to describe the wall heat loss. Besides, a zero gradient condition for all species is assumed at walls.

Schematic diagram of COREX melter gasifier freeboard.

Arrangement diagram of DB and OB.
| Parameters | Value | |
|---|---|---|
| Recycling dust | 6900 kg/h | |
| Generator gas pressure | 350 kPa | |
| Oxygen fed through OB | 4500 Nm3/h | 298 K |
| Oxygen fed through DB | 18400 Nm3/h | 298 K |
| Nitrogen fed through DB | 1200 Nm3/h | 298 K |
| Reducing gas fed through moving bed | 0.45 m/s | 1150 K |
| Reducing gas composition in volume fraction | ||
| CO | 70.2% | |
| CO2 | 2.2% | |
| H2 | 22.6% | |
| H2O | 5.0% | |
For computational convenience, the assumptions in this model are given as below. (1) CH4, which is less than 3%, is ignored, and hence, the gas species considered in this model include CO, CO2, H2, H2O, N2 and O2. (2) The composition, velocity and temperature of the reducing gas fed through the moving bed are assumed to be uniform in the freeboard bottom, as listed in Table 4, and they are obtained from the mass and thermal balance calculations of COREX melter gasifier.16) (3) The reducing gas fed through the moving bed is assumed to carry large amounts of fine carbon particles generated by the thermal crack of the lump coal, and these carbon particles will participate in Boudouard reaction and water gas reaction.16) (4) Because it is impossible to directly measure the diameter and flow rate of carbon particle as a result of the harsh environment in the freeboard, the calculation condition of carbon particle is assumed to be the same as the data of Berger’s work.16) (5) The carbon particle and the recycling dust are assumed to be spherical and there is no break-up and coalescence. (6) Since the falling time of DRI, non-coking coal, silica and coke from the top of freeboard to the moving bed is very short, it has almost no effect on the characteristics inside freeboard. Thus, only the gas, the carbon particle and the recycling dust are considered.
The numerical technique is based on a three-dimensional, finite volume model. The total number of cells is 54260, and each cell represents a control volume. The differential equations are integrated directly in the control volume of the computational domain. The SIMPLE method for the relationship between velocity and pressure corrections and the first order upwind scheme for discretizing convection terms are applied in this model.25,26)
3.2. Model ValidationThe mathematical model is validated in terms of the gas composition. In the present work, the generator gas composition including CO, CO2 and H2 from the simulated results is compared with the plant operational data, as summarized in Table 5. Generally speaking, despite the moderate differences in the absolute values between measurement and simulation, the calculated gas volume fraction is basically consistent with the measured data, which proves the applicability of the present model for prediction of the recycling dust combustion and characteristics inside freeboard.
| Measured results | Simulated results | Absolute Error | Relative Error | |
|---|---|---|---|---|
| CO | 62.8% | 64.4% | 1.6% | 2.5% |
| CO2 | 10.6% | 10.5% | 0.1% | 0.9% |
| H2 | 18.8% | 19.0% | 0.2% | 1.1% |
In order to fully understand the characteristics inside the freeboard in terms of the velocity, temperature, species distributions, the plane defined by centerlines of the DB and the freeboard (i.e., the vertical plane in Fig. 5(b)) and the plane determined by centerlines of the DB and the OB (i.e., the horizontal plane in Fig. 6) are selected respectively.
The gas phase velocity distributions in the vertical plane and the horizontal plane are shown in Fig. 7. It could be found that the gas stream forms a high speed jet, which gradually expands in the radial and axial direction, after exiting DB or OB. Due to the higher gas flow rate and the reaction of incomplete carbon combustion which increases gas volume, the region of the high speed jet in front of DB is larger than that in front of OB. In the central region of freeboard, the gas velocity gradually decreases to the value of about 1 m/s as a result of the enlarged space. Around the generator gas nozzle, the gas velocity increases slightly owing to the relatively small diameter of the generator gas nozzle.

Gas phase velocity distributions in (a) vertical plane and (b) horizontal plane.
The gas phase temperature distributions in the vertical plane and the horizontal plane are described in Fig. 8. The region of high temperature more than 3000 K can be formed in front of DB due to the combustion of recycling dust. Furthermore, the carbon in the recycling dust has almost completely burned out in front of DB. Although the gas temperature in front of DB is almost equal to that in front of tuyere in the raceway,9) the gas flow circulation is not observed in front of DB, thus the thermal damage probability of DB is much lower than that of tuyere. The high temperature region in front of DB is larger than that in front of OB, which is consistent with the gas velocity field discussed above, as a result of the higher gas flow rate and the stronger combustion heat release. Furthermore, the gas temperature decreases slightly in the top region of the freeboard mainly on account of the wall heat transfer. In addition, the generator gas temperature is about 1338 K, which meets practical production requirements.

Gas phase temperature distributions in (a) vertical plane and (b) horizontal plane.
The volume fraction distributions of gas species (CO, CO2, H2 and H2O) in the vertical plane are described in Fig. 9. Generally speaking, the volume fraction distribution of CO or H2 shows an opposite tendency to that of CO2 or H2O in the freeboard. Due to the combustion of recycling dust, CO and H2, the volume fraction of CO2 and H2O is highest, while that of CO and H2 is lowest in front of DB, which is consistent with the gas temperature field. With the movement of gas, the volume fraction of CO2 and H2O gradually decreases on account of the dilution by the high volume fraction of CO and H2 in the reducing gas from the moving bed. Furthermore, in the upper part of freeboard, the volume fraction of CO and H2 in the peripheral region near the wall is higher than that in the central region. It can be analyzed that the weak combustion region, in which the gas temperature is lower than 1500 K, exists between two burners. Part of reducing gas from the moving bed passes through these regions with weaker combustion to contribute to a higher volume fraction of CO and H2 near the wall.

Volume fraction distributions of gas species in vertical plane: (a) CO, (b) CO2, (c) H2 and (d) H2O.
Three variation trends could be observed in the radial distributions of the gas temperature and species along the DB level (refer to Fig. 5(b)) as shown in Fig. 10. Firstly, in front of DB, the volume fraction of N2, which serves as the conveying gas of the recycling dust, rapidly decreases as a result of dilution by other gas species. Secondly, although the volume fractions of CO and H2 are lower in front of DB, they gradually increase due to the rich contents of CO and H2 in the reducing gas from the moving bed. Thirdly, after that gas exits DB, the volume fractions of CO2, H2O and gas temperature first increase and then decrease, under the combined effects of combustion and dilution as discussed above. In addition, since the DB has an inclination in relation to the horizontal and O2 is fed through the periphery region of the DB, the volume fraction of O2 first increases and then decreases as well.

Radial distributions of gas temperature and species along dust burner level.
In actual production, due to the change in raw materials fed into the melter gasifier and production operations, the generator gas temperature may fluctuate, thus the flow rate of oxygen fed through OB should be adjusted to achieve a reasonable generator gas temperature. In this section, five oxygen flow rates, which varies from 4500 Nm3/h (minimum flow rate) to 8100 Nm3/h by a 900 Nm3/h step, are selected.
The effect of flow rate of oxygen fed through OB on generator gas temperature is shown in Fig. 11. As oxygen flow rate increases from 4500 Nm3/h to 8100 Nm3/h, the generator gas temperature rises by 41 K. It is worth noting that when the oxygen flow is set at 7200 Nm3/h or 8100 Nm3/h, the generator gas temperature reaches 1371 K or 1380 K, exceeding the safe range (1303–1363 K), which may result in the refractory burnout and the generator gas nozzle blocking caused by the softening and bond of the dust. Therefore, under the current operating conditions, the flow rate of oxygen fed through OB should be controlled in the range less than 6300 Nm3/h.

Effect of flow rate of oxygen fed through OB on generator gas temperature.
The effect of flow rate of oxygen fed through OB on generator gas composition in volume fraction is summarized in Fig. 12. It can be seen that the volume fractions of CO and H2 increase by 1.23% and 0.51%, while that of CO2 decreases by 1.23%, when the flow rate of oxygen increases from 4500 Nm3/h to 8100 Nm3/h. This phenomenon is basically consistent with the actual production, and results from the fact that the increasing freeboard temperature improves the rates of Boudouard reaction and water gas reaction, contributing to a greater amount of CO2 and H2O consumption.

Effect of flow rate of oxygen fed through OB on generator gas composition in volume fraction.
Based on the above analysis, it could be concluded that the flow rate of oxygen has a positive relationship with the generator gas temperature, and a negative relationship with the volume fractions of CO2 in the generator gas. In actual production, the ironmaking professionals used to passively adjust the oxygen flow rate according to the generator gas temperature, ignoring the effects of oxygen flow rate on the generator gas composition. However, the generator gas in the melter gasifier would be conveyed into the shaft furnace to reduce the iron ore, and its higher volume fraction of CO2 would affect the reduction efficiency of the shaft furnace and decrease the metallization rate of DRI. Thus, it would result in an increasing reduction load of melter gasifier, which increases the fuel rate of melter gasifier. Therefore, in addition to generator gas temperature, the volume fraction of CO2 in generator gas should also be strictly controlled to allow for adjustment of the oxygen flow rate.
After being fed into the freeboard through DB, the recycling dust rapidly flows through the region of high temperature with more than 3000 K, and the carbon in the recycling dust burned completely. However, the behaviors of other minerals in the recycling dust, including Fe, FeO, SiO2, 2CaO·SiO2 and 2CaO·Al2O3·SiO2, are still not clear. Therefore, the behavior of recycling dust would be discussed based on the different minerals features as follows.
Due to the high volume fraction of O2 and the high temperature in front of DB, Fe and FeO in the recycling dust may be oxidized to Fe3O4, even Fe2O3. Then the iron oxide rapidly softens, melts and forms liquid drops to drip into the moving bed, in which the iron oxide gradually smelts into liquid iron. According to the phase diagram of Al2O3–CaO–SiO2,27) the melting temperature of SiO2, 2CaO·SiO2 and 2CaO·Al2O3·SiO2 is 1998 K, 2403 K and 1863 K respectively, which is far lower than the temperature in front of DB, thus these minerals also softens, melts and drips into the moving bed, in which they gradually smelts into molten slag, while a small amount of them smelts into liquid iron.
The alkali metals in the recycling dust immediately gasify and blend into the reducing gas, as a result of the high temperature above 3000 K in front of DB. In the upper part of freeboard, since the gas temperature decreases, the alkali metals could be divided into four parts as shown in Fig. 13. Firstly, a part of alkali metals condense in the surface and pore of the burden materials. Along with the descending of the burden materials, some alkali metals gasify again in the raceway where the temperature is above 3500 K9,10,11) and ascend with the reducing gas. In the low temperature region of moving bed, they either condense in the surface and pore of burden materials once more or pass into the freeboard with the reducing gas. While other alkali metals are absorbed by the molten slag and discharged out of the melter gasifier. Secondly, a part of alkali metals condense on the surface of dust which would be blown out of the freeboard. After being dedusted, they would be fed into the freeboard again. Thirdly, a part of alkali metals condense in the gap of the furnace lining, which will lead to the breakage and thickening of the furnace lining. Fourthly, a part of alkali metals will be discharged out of the freeboard through the generator gas, and gather in the sludge after the cold gas washing. Therefore, based on the above analysis, it can be seen that part of the alkali metals, carried by the recycling dust, is discharged out of the melter gasifier through the molten slag and the generator gas, while the remaining part of the alkali metals circulate in the melter gasifier.

Cycle diagram of alkali metals in melter gasifier.
The behaviors of S and ZnO in the recycling dust resemble those of alkali metals. Most of S is discharged out of the melter gasifier through molten slag, while most of ZnO is discharged through the generator gas. It is noted that the part of ZnO will condense in the furnace lining gap, which leads to thickening of the furnace lining. Certainly, part of S and ZnO circulates by being absorbed by the dust blown into the freeboard. Furthermore, although the mineral structures of the micro-composition in the recycling dust, including MgO and MnO are not proven by XRD, they finally smelt into molten slag, while a small amount of them smelts into liquid iron as in the case of SiO2.
Based on the above analysis, it could be concluded that the behaviors of different chemical composition in the recycling dust are complex. Especially the phenomena of circulation and accumulation could occur for the alkali metals, S and ZnO. Their accumulation in the melter gasifier inevitably leads to many production problems, thus it is a meaningful topic as to whether the current practice of dust use is optimal. There might be a better way of effective utilization of melter gasifier dust containing much C and Fe, just like blast furnace dust. This effective utilization will be further explored. Furthermore, these behaviors have been discussed merely based on the inherent characteristics of recycling dust and the simulated freeboard temperature distribution, the recycling dust behavior will be further verified in the future experimental investigation.
The inherent characteristics of recycling dust are obtained by using many techniques. The mean particle size of the recycling dust is 28.88 μm. The recycling dust has an irregular shape and an uneven granulometric distribution, which results from the complex source of the recycling dust and the agglomeration of the smaller sized particles. The primary chemical composition of the recycling dust is C and Fe with a total mass fraction up to 80%. Many minerals, including Fe, FeO, SiO2, 2CaO·SiO2 and 2CaO·Al2O3·SiO2, are detected in the recycling dust. A modified three-dimensional mathematical model at steady state is successfully developed to analyze the recycling dust combustion. As an important influence factor for the recycling dust behavior, the freeboard temperature distribution is also analyzed. The drag force of particles and the turbulence model are considered in this model. It can be seen that the combustion of C in the recycling dust mainly occurs in front of dust burner, with a combustion ratio of almost 100%. Thus a region of high temperature more than 3000 K can be observed in front of DB. Under the present calculation conditions, the flow rate of oxygen fed through OB should be controlled within the range of less than 6300 Nm3/h to prevent an excessive generator gas temperature. However, the decreasing oxygen flow rate results in a higher volume fraction of CO2, which would decrease the reduction efficiency of the shaft furnace and increase the fuel rate of melter gasifier. Therefore, in actual production, the suitable oxygen flow rate could be adjusted based on the generator gas temperature and composition. Furthermore, the recycling dust behavior is complex. Because of the high volume fraction of O2 and the high temperature in front of DB, Fe and FeO in the recycling dust may be oxidized to Fe3O4, even Fe2O3, and finally smelts into liquid iron. While other minerals, including SiO2, 2CaO·SiO2, 2CaO·Al2O3·SiO2, MgO and MnO, finally smelt into molten slag. It is worth noting that the phenomena of circulation and accumulation of the alkali metals, ZnO and S could occur, despite that most of them are discharged out of the melter gasifier through the generator gas and molten slag. Thus a further exploration in effective utilization of melter gasifier dust is meaningful. In addition, these behaviors will be further verified in the future experimental investigation.
The authors would like to thank the financial support from the National Natural Science Foundation of China (No. U1260202) and Specialized Research Fund for Doctoral Program of Higher Education (No. 20120006110002). The authors are thankful for the linguistic corrections from Mr. Siming CHEN in this work.
Ac: Pre-exponential factors, –
Ap: Particle area, m2
a1, a2, a3: Drag coefficient constants, –
C1, C2: Turbulent model constants, –
CA: Empirical constant, –
CD: Drag coefficient, –
Cp: Heat capacity, J/kg·K
Di, reac: Diffusion rate coefficient of the reactant gas phase species i, K0.75/m
Di: Mass diffusion coefficient of specie i, m2/s
Dref: Reference diffusivity, –
dp: Particle diameter, m
E: Activation energy, J/mol
fD: Drag force from a particle, N
Gk: Turbulence production due to viscous force, kg/m·s3
H: Enthalpy, J/kg
Hreac: Reaction heat, J/kg
h: Heat transfer coefficient, W/m2·K
[i]: Molar concentration of reactant species i, kmol/m3
k: Turbulent kinetic energy, m2/s2
kc: Kinetic rate, –
mp: Mass of particle, kg
np: Particle number per unit volume, m–3
P: Pressure, Pa
Pi, reac: Partial pressure of the reactant gas phase species i, Pa
q: Heat transfer from a particle, W
R: Gas-law constant, 8.314472 J/mol·K
Ri: Reaction rate of species i, kg/m3·s
Re: Reynolds number, –
Sct: Turbulent Schmidt number, –
Tg: Gas temperature, K
Tp: Particle temperature, K
t: Time, s
Yi: Mass fraction of species i, –
YC, Surf: Mass fraction of C in the particle surface, –
Greek letters
ε: Turbulence dissipation rate, m2/s3
εp: Particle emissivity, –
θR: Radiation temperature, K
λ: Thermal conductivity, W/m·K
ρ: Density, kg/m3
μ: Laminar viscosity, Pa·s
μt: Turbulent viscosity, Pa·s
σB: Stefan-Boltzmann constant, 5.67×10⁻⁸ W/m2·K4
σk, σε: Turbulence model constants, –
Abbreviations
DB: Dust burner
DRI: Direct reduction iron
EDS: X-ray energy dispersive spectrometry
OB: Oxygen burner
SEM: Scanning electron microscopy
XRD: X-ray diffraction