2. Experimental
2.1. Solid/liquid Mass Transfer
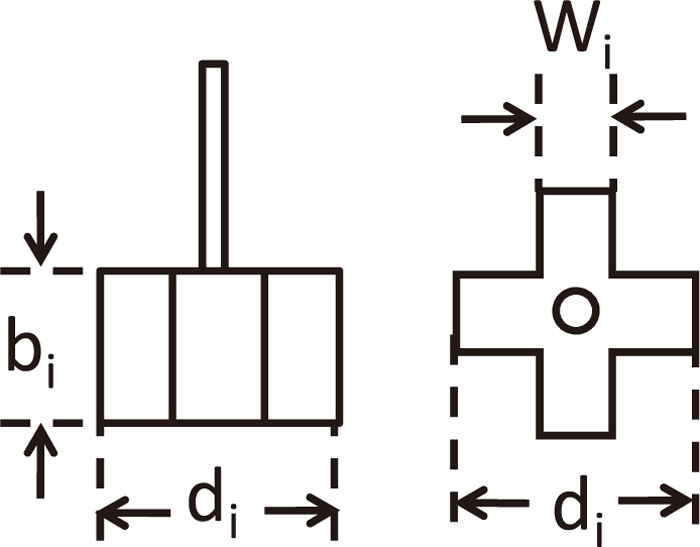
Figure 2 shows a schematic view of experimental apparatus. Perlite particles and 2.35×10⁻⁴ M of HCl aq. were put into an acrylic vessel of inner diameter, D (mm) and height, L (mm) so as to be static bath depth, H0 (mm). Pearlite (density, ρd=100 kg/m3, Mitsui Mining & Smelting Co., Ltd.) was arranged in the almost equal size, immersed into 2×10⁻³ M of NaOH aq. for 6 hours and dried in the room for 12 hours. Four blades of impeller was used as shown schematically in Fig. 3. The impeller whose diameter was expressed as di mm, thickness as bi mm and width as wi mm was set in the central axis of the vessel.
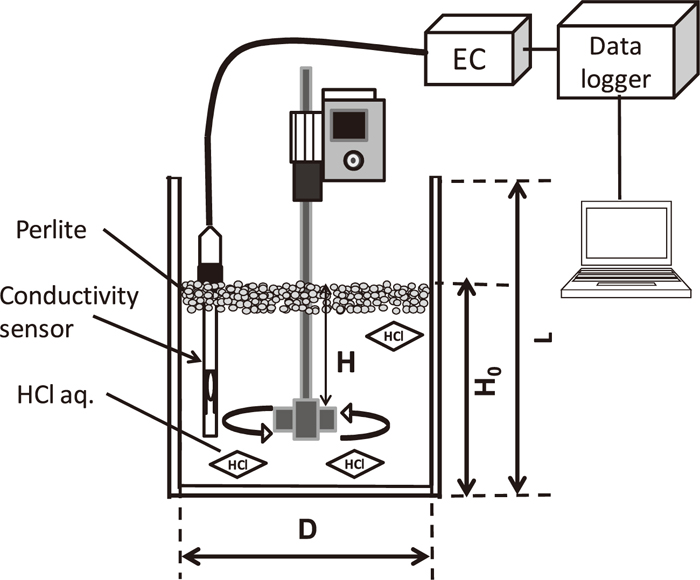
H+ in HCl aq. reacts with Na+ on pearlite surface according to mechanical stirring. H+ was measured by electrical conductivity meter (Automatic system research, mk-250EC) shown as EC in Fig. 2 and mass transfer rate was calculated from its temporal change. Experimental condition is shown in Table 1. The operating factors such as rotating speed, N (rpm), impeller depth, H (mm), volumetric ratio of solid to liquid, VS/VL were changed on the basis of D=H0=300 mm, (di, bi, wi)=(116 mm, 67 mm, 31 mm) and dp=2.3 mm.
Table 1. Experimental condition of mechanical stirring.
| Variables | |
|---|
| Vessel inner diameter, D (mm) | 300, 400 |
| Bath depth, H0 (mm) | 300, 400 |
| Impeller diameter, di (mm) | 116, 156 |
| Impeller thickness, bi (mm) | 67, 85 |
| Impeller width, wi (mm) | 31, 42 |
| Rotating speed, N (rpm) | 0–335 |
| Impeller depth, H (mm) | 0–300 |
| Solid-liquid ratio, VS/VL (–) | 0.02, 0.06, 0.12, 0.24 |
| Dispersion phase | Perlite |
| Mean diameter of perlite, dp (mm) | 1.3, 2.3, 3.1 |
Gas injection practice was carried out for comparison with mechanical stirring. The nozzle with four holes at regular intervals was set in the central axis of the vessel. Gas was injected horizontally into liquid. Experimental condition is shown in Table 2. Gas flow rate, Q (L/min) and nozzle depth, H (mm) were changed under D=H0=300 mm, hole diameter, d=3 mm and VS/VL=0.12.
Table 2. Experimental condition of gas stirring.
| Variables | |
|---|
| Inner diameter, D(mm) | 300 |
| Bath depth, H0 (mm) | 300 |
| Gas flow rate, Q (L/min) | 5, 20, 40 |
| Nozzle depth, H (mm) | 100, 150, 200, 250 |
| Solid-liquid ratio, VS/VL (–) | 0.12 |
| Hole diameter, d (mm) | 3 |
| Number of hole | 4 |
As hydrochloric acid is strong acid, it is ionized perfectly by Eq. (1) in water.
Mole electric conductivity, λ, of strong electrolyte defined by electric conductivity, κ (S/cm), per electrolyte concentration, C (mol/L) was expressed as Eq. (2).
|
λ≡
10
3
κ/C=
λ
(
H
+
)
+
λ
(Cl
-
)
=
λ
∞
| (2) |
where
λ∞: infinitely-diluted mole electric conductivity (Scm
2mol
–1),
λ(H+) = 349.8 (Scm
2mol
–1),
λ(Cl–) = 76.4 (Scm
2mol
–1).
13) Thus,
Eq. (2) became
|
λ=
10
3
κ/C=
λ
∞
=349.8+76.4=426.2
| (3) |
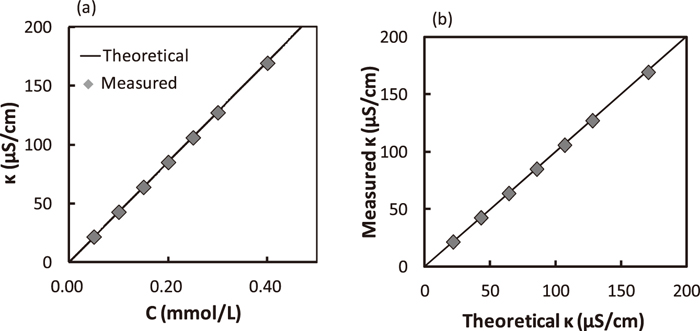
Equation (4) was verified by the experiment where a given amount of hydrochloric acid was dissolved in ion-exchanged water of 100 mL and electric conductivity was measured. Relation between electric conductivity and concentration of hydrochloric acid is shown in Fig. 4(a). “Theoretical” in Fig. 4(a) means Eq. (4). Theoretical electric conductivity values agreed well with measured ones. Figure 4(b) shows relation between measured and theoretical electric conductivity. It was found that concentration of hydrochloric acid is obtained from Eq. (4) by measuring electric conductivity from these two figures.
3. Results and Discussion
3.1. Effect of Solid/liquid Mixing Pattern on Mass Transfer
3.1.1. Calculation of Solid/liquid Mass Transfer Coefficient
Ion-exchanged reaction of pearlite is expressed by Eq. (5).
|
R-
Na
+
+HCl→R-
H
+
+NaCl
| (5) |
Ion-exchanged reaction rate is determined by diffusion in the fluid film, chemical reaction on the solid/liquid interface or diffusion in the solid phase. As the rate is normally controlled by the diffusion in the fluid film14) at the early stage, solid/liquid mass transfer rate is given by Eq. (6).
|
-VdC/dt=
k
S-L
a
S-L
(
C-
C
i
)
| (6) |
where, k
S-L: solid/liquid mass transfer coefficient (m/s), a
S-L: total surface area of pearlite particles (m
2), C: HCl concentration (kgmol/m
3), C
i: HCl concentration on pearlite (kgmol/m
3), V: volume of HCl aq. (m
3). On the assumption that C
i equals to be 0,
15,16) integration of
Eq. (6) gives
Eq. (7) , where C
0: initial HCl concentration (kgmol/m
3).
|
Vln(
C
0
/C
)
=
k
S-L
a
S-L
t
| (7) |
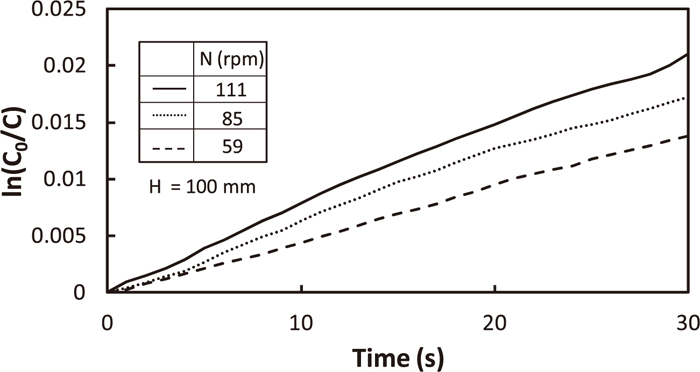
Some examples of temporal change in C0/C are shown in Fig. 5. As logarithmic C0/C increased almost linearly with time, the slope enabled us to achieve kS-L. The aS-L was obtained from the average diameter regarding as sphere. As perlite particles moved quickly on HCl aq. even at the minimum rotation speed, N=40 rpm in the experimental condition, total surface area of pealite particles was used for Eq. (7).
3.1.2. Effect of Rotation Speed on Solid/liquid Mass Transfer Rate
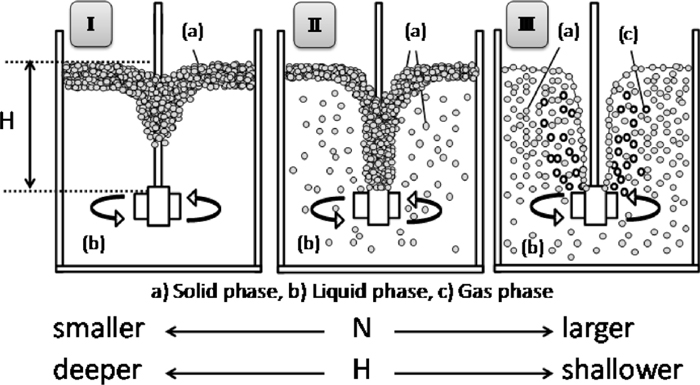
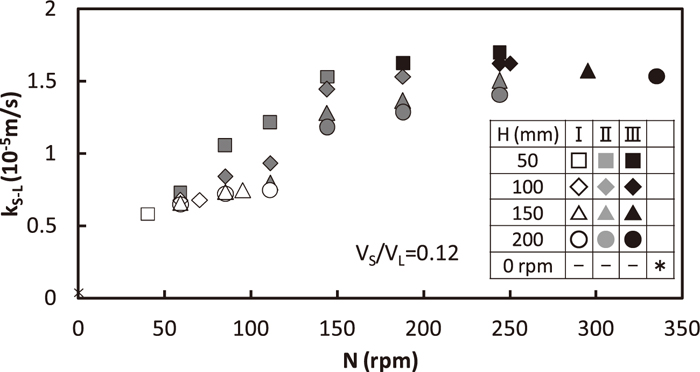
Relation between kS-L and rotating speed is shown in Fig. 6. VS/VL is fixed to 0.12 and H is varied between 50 and 200 mm. Each plot is differentiated by solid/liquid mixing pattern9) describer in chapter 1. The kS-L value was near 0 for N=0 rpm, which meant that solid/liquid mass transfer rate depended on mechanical stirring. kS-L increased with the increase in N due to the stirring energy in bath. kS-L increased moderately with the increase in N in the region I, the increasing rate of kS-L against N became larger in the region II, and it returned to the moderate increase in the region III. The reason of the behavior in the region II is why solid particles are partly dispersed in continuous liquid phase where solid/liquid stirring is seemed to be more severe than the floated solid particles/liquid. The additional discussion will be made in section 3.4. On the other hand, both in the region I where no solid particles disperse and in the region III where almost all of solid particles exist in liquid, the increase in kS-L depends only on the stirring energy by impeller rotation.
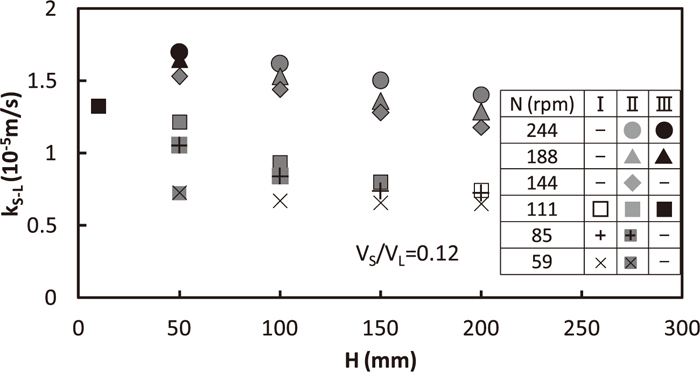
Relation between kS-L and depth, H, from gas/solid interface to upper part of impeller is shown in Fig. 7. VS/VL is fixed to be 0.12 and N is varied between 59 and 244 rpm. kS-L increased with the decrease in H because of the increasing ratio of dispersed particles in the region II. However, kS-L was kept to be almost constant in the region I shown in N=59 rpm, because the change in H gave no change in stirring energy nor dispersion.
3.1.4. Effect of Ratio of Solid/liquid on Solid/liquid Mass Transfer Rate
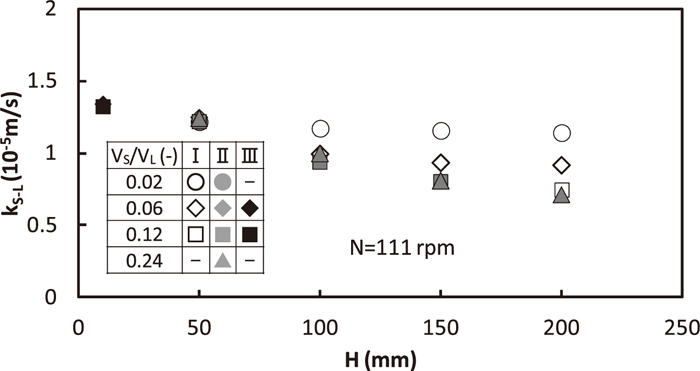
Effect of VS/VL on kS-L for N=111 rpm is shown in Fig. 8. Both in the regions of II and III, kS-L had no change in VS/VL. However, kS-L in the region I increased with the decrease in VS/VL for the equal H because dispersed solid particles contacted with liquid more sufficiently.
3.1.5. Effect of Impeller Diameter on Solid/liquid Mass Transfer Rate
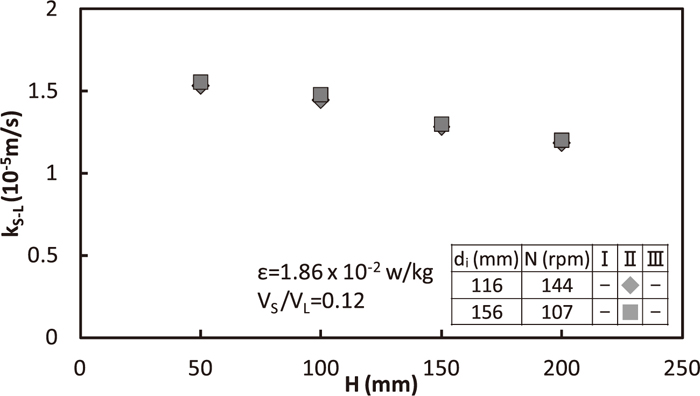
Relation between kS-L and H in the region II is shown in Fig. 9. Here, both impeller diameter and rotation speed changed so as to supplied rate, ε, of energy into bath and VS/VL was fixed to be 1.86×10⁻² w/kg, 0.12 (–), respectively. ε was calculated from the method in section 3.2. Solid/liquid mass transfer rate has no change for the same ε.
3.1.6. Effect of Vessel Diameter on Solid/liquid Mass Transfer Rate
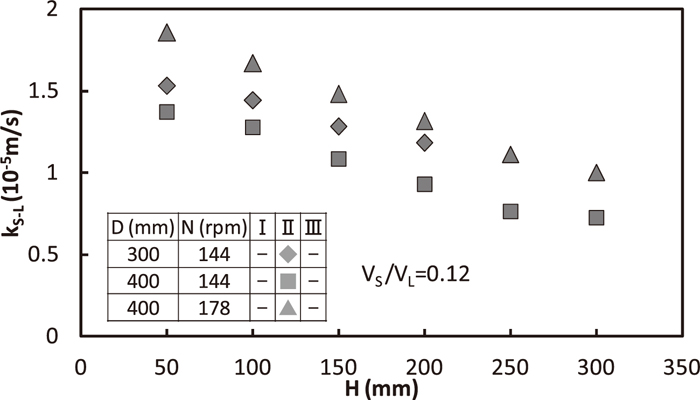
Relation between kS-L and H in the region II is shown in Fig. 10. Here, both impeller diameter and rotation speed changed and VS/VL, di was fixed to be 0.12 (–), 116 mm, respectively. ε equaled to 1.86×10⁻² w/kg for (D,N) = (300 mm, 144 rpm) as well as (400 mm, 178 rpm). Both of larger vessel diameter and rotation speed increased kS-L, for the same ε value.
3.1.7. Effect of Pearlite Diameter on Solid/liquid Mass Transfer Rate
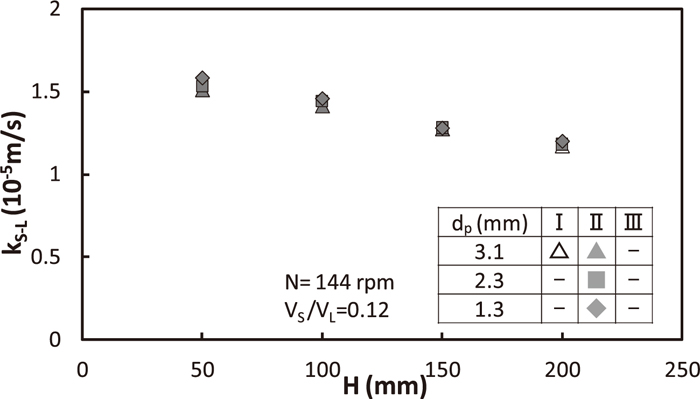
Relation between kS-L and H is shown in Fig. 11. Pearlite diameter, dp was changed from 1.3 mm to 3.1 mm, although VS/VL, N and D are fixed to be 0.12 (–), 144 rpm, 300 mm, respectively. kS-L did not depend on pearlite diameter.
3.2. Comparison between Solid/liquid and Liquid/liquid Mass Transfer Rates
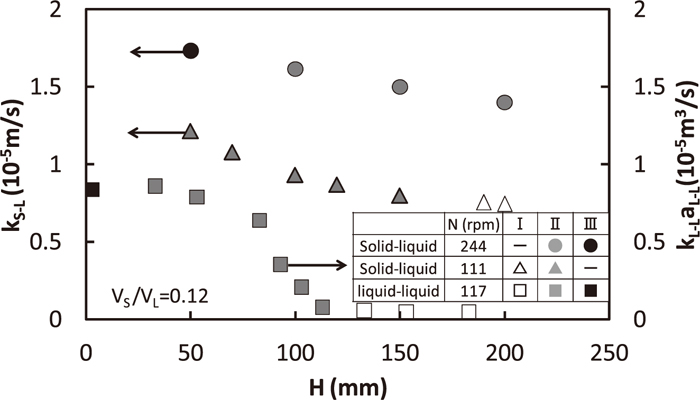
Relations between kS-L and H, and liquid/liquid capacity coefficient, kL-LaL-L (m3/s) and H11) are shown in Fig. 12. Although both of solid/liquid and liquid/liquid mass transfer rates increased with the decrease in H in the region II, the increasing ratio of the liquid/liquid is more remarkable than that of the solid/liquid. It is due to the fact that the decrease in H causes the increase in liquid/liquid interfacial area, aL-L as the dispersed phase increases, whereas it is not expected for the solid/liquid. Both of liquid/liquid and solid liquid mass transfer rates were almost constant in the region I.
3.3. Dimensionless Equation of Solid/liquid Mass Transfer Rate
Assuming that a single particle moves into liquid at a terminal velocity, Froessling formula17) on solid/liquid mass transfer rate was introduced as Eq. (8). Semi-empirical equations18) for particles/liquid mass transfer rate in a mechanically-stirred vessel were proposed as Eq. (9), based on Eq. (8).
|
Sh=2+0.6
Re
p
1/2
Sc
1/3
| (8) |
where Sh: Sherwood number (=k
S-Ld
p/D
HCl), Re
p: particle Reynolds number (=
ρNd
pd
i/
μ), Sc: Schmidt number (=
μ/
ρD
HCl), D
HCl: diffusivity coefficient of HCl (m
2/s),
ρ: density of HCl aq. (kg/m
3),
μ: viscosity coefficient of HCl (Pa·s). A, B, n and m in
Eq. (9) are factors determined by the experiment.
The kS-L values were affected on VS/VL in addition to N in the region I as seen in Fig. 8, and on H in the regions II and III like Figs. 6, 7, 8, 9, 10, 11, 12. Thus, the dimensionless Eq. (9) for region I and II was modified as Eqs. (10) and (11), respectively.
The region I;
|
Sh=2+
BRe
p
n
Sc
1/3
(
V
S
/
V
L
)
P
| (10) |
The region II and III;
|
Sh=2+
BRe
p
n
Sc
1/3
(
H/D
)
q
| (11) |
where p and q are factors obtained from regression analysis.
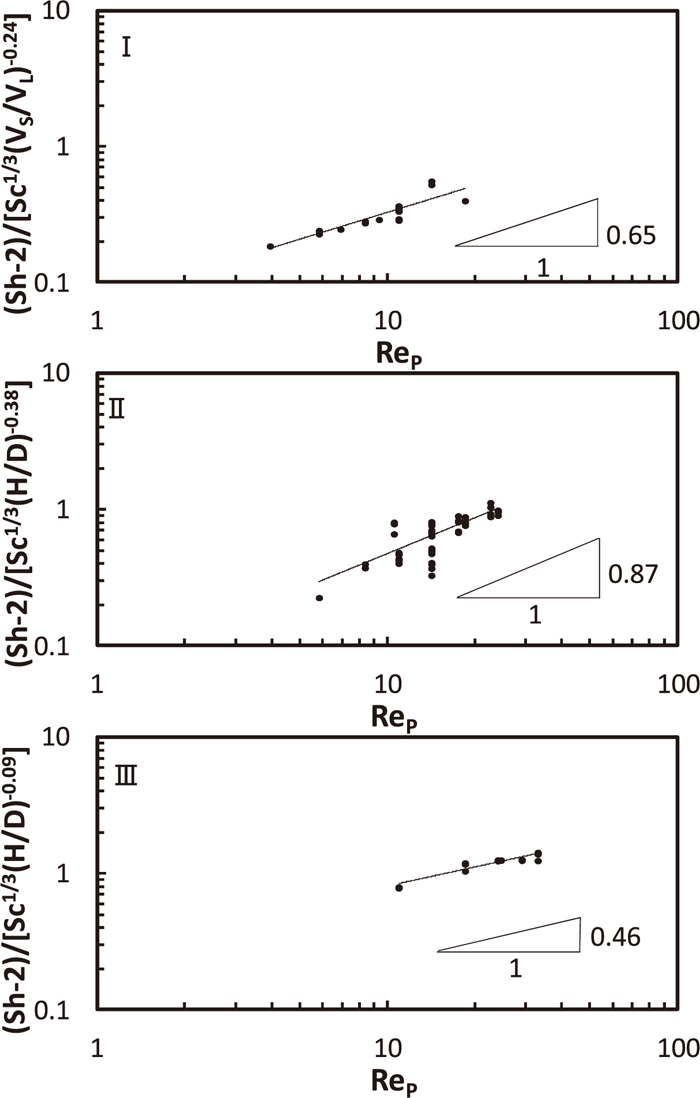
The dimensionless equation of each region is obtained as shown in Fig. 13. Data in the region II dispersed more widely than those in the regions I or III due to partly dispersed two reaction zones. Factors (B, n, p) in the region I were (0.071, 0.65, –0.24) obtained from the data of N ≧ 40 rpm (ReP ≧ 4.0) in this experimental condition, whereas (B, n, q) in the regions II and III are (0.063, 0.87, –0.38), (0.28, 0.46, –0.09), respectively. Power of Rep in the region II was larger than any other regions and that of (H/D) in the region II was smaller than that in the region III. It result from the change in dispersion behavior of particles which generates only in the region II. From the point of dispersion ratio of particles, the change in kS-L is described in the following section 3.4.
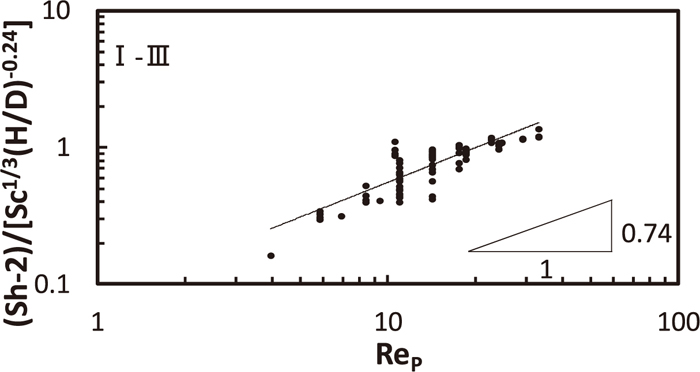
The dimensionless equation of all data in the regions I to III is obtained from Fig. 14. As power of (VS/VL) was negligible small, (B, n, q) became (0.079, 0.74, –0.24).
3.4. Dispersion Ratio in the Region II
All particles exists on liquid in the region I and most particles disperse into liquid in the region III. On the other hand, in the region II dispersion of particles increases with the increase in rotation speed and the decrease in distance between free surface and impeller position. Defining kS-L between floating particles and liquid as kI, and that between dispersed particles and liquid as kIII, kS-L of the region II, kII is expressed by the dispersed particles ratio, α, as follows.
|
k
II
=(1-α)
k
I
+α
k
III
| (12) |
Rearranging Eq. (12),
|
α=(
k
II
-
k
I
)/(
k
III
-
k
I
)
| (13) |
Here, α is expressed using the kS-L value of the region I near the transition I–II as kI and the kS-L value of the region III near the transition II–III as kIII.
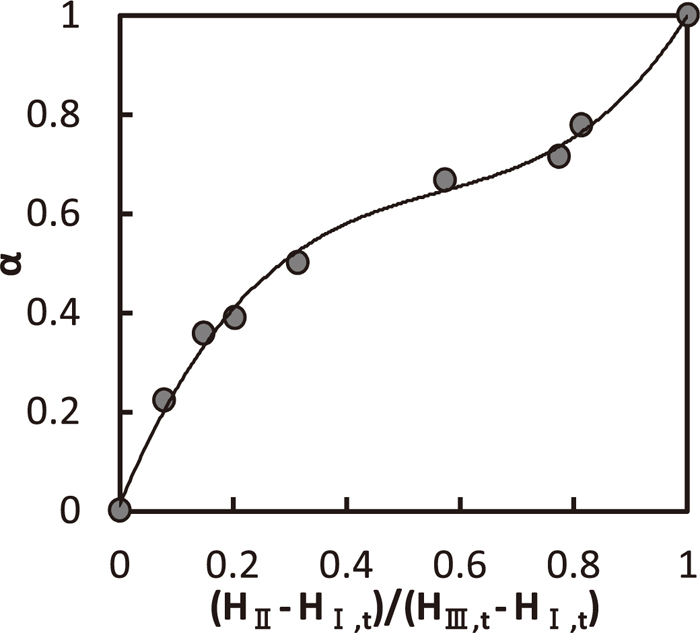
When H is changed under constant N, H of the transition I–II and II–III are defined as HI,t, HIII,t, respectively. Relation between α and (HII–HI,t)/(HIII,t–HI,t) is shown in Fig. 15. HII means H in the region II. Dispersion ratio in the region II was ranged by normalized H. Change rate of α was shelving in the center of the region II and sharp near the regions I and III.
When N is changed under constant H, N of the transition I–II and II–III are defined as NI,t, NIII,t, respectively. Relation between α and (NII–NI,t)/ (NIII,t–NI,t) is shown in Fig. 16. NII means N in the region II. As well as Fig. 15, kS-L values of the region I near the transition I–II and of the region III near the transition II–III were used as constant kI, kIII, respectively. However, as kI and kIII in the region II change normally with N because of change in supplied rate of energy into bath, kI is underestimated, whereas kIII overestimated in Fig. 16. Thus, it was lead to larger α value than the actual one in Eq. (13). From Fig. 16, dispersion ratio in the region II was roughly ranged by normalized N in spite of an overestimate of α curve.
3.5. Comparison of Solid/liquid Mass Transfer Rate between Mechanical Stirring and Gas Injection
3.5.1. Solid/liquid Mass Transfer Rate of Gas Injection Practice
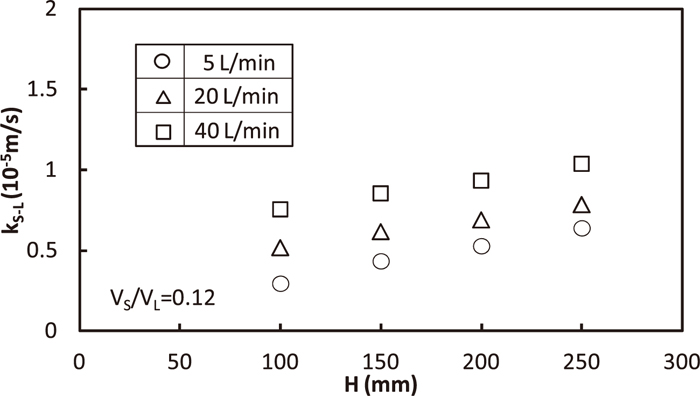
Relation between kS-L and the distance between gas/solid surface and hole position of the immersed nozzle, H, for the various gas flow rate, Q, is shown in Fig. 17. kS-L increased with the increase in H and Q, because supplied rate of energy into bath increased.
3.5.2. Comparison of Solid/liquid Mass Transfer Rate between Mechanical and Gas Stirrings
Here, solid/liquid mass transfer rate was compared between mechanical and gas stirring in the case of the same supplied rate of energy into bath. Supply rate of energy by gas stirring expressed as εg (W/kg) is given by Eq. (14).19)
|
ε
g
=0.0143QT/
W
w
log(
1+H/10.3
)
| (14) |
where Q: gas flow rate (NL/min), T: bath temperature (K), W
w: mass of water (kg), H: depth from free surface to the position of gas injection (m).
On the other hand, supplied rate of energy by mechanical stirring expressed as εi (W/kg) is given by Eq. (15).20)
|
ε
i
=
N
P
ρ
w
N
3
d
i
5
/
W
w
| (15) |
where N
P: power number (–),
ρw: liquid density (kg/m
3), N: rotation speed (rps), d
i: impeller diameter (m). N
P is calculated from Nagata’s formula.
20)
Both of εg for Q=5, 10 and 20 L/min were calculated from Eq. (14) for D=H0=0.3 m, H=0.1 m and T=298 K. Rotation speed for mechanical stirring was obtained by substituting εi values corresponding to the above calculated εg ones and Np given by Horiuchi et al.11) into Eq. (15). As shown in Table 3, the rotation speeds, N=111, 146 and 189 rpm correspond to gas flow rates, Q=5, 10 and 20 L/min, respectively.
Table 3. Gas flow rate and rotating speed for the same supplied rate of stirring energy.
| Q (L/min) | N (rpm) | ε×103 (W/kg) |
|---|
| 5 | 111 | 9.4 |
| 20 | 188 | 37.5 |
| 40 | 244 | 74.9 |
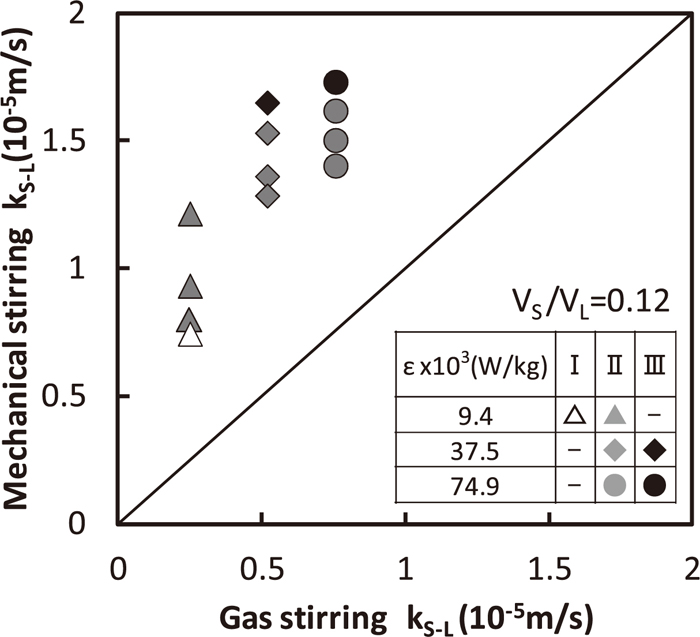
Comparison of kS-L between mechanical and gas stirring for the same supplied rate of energy into bath is shown in Fig. 18. kS-L values of mechanical stirring were distinguished by the mixing pattern. No region I occurred at εi = 37.5 × 10⁻³ and 74.9 × 10⁻³ w/kg, even if the impeller was just set on the vessel bottom. Solid/liquid mass transfer rate of mechanical stirring was faster than that of gas stirring in this experimental condition regardless of the mixing pattern. On the other hand, liquid/liquid mass transfer rate of mechanical stirring in the region I and up to a point of the region II is smaller than those of gas stirring, whereas they were larger than above the point of the region II and the region III.11) As known by the visual observation, it is due to the fact that solid/liquid mixing during gas injection practice is limited to the gas passing part and a lot of particles floated on liquid steadily.