Abstract
Formation of the reversed austenite by intercritical annealing has been studied in the 0.2C–5Mn steel by means of X-ray diffraction, scanning electron microscopy and transmission electron microscopy. It is found that the volume fraction of reversed austenite increases solely with increasing annealing temperature. While the volume fraction of retained austenite begins to go up around 575°C and exhibits a maximum value of 33.0% at 650°C; and when above 650°C, the retained austenite volume fraction decreases with increasing annealing temperature. At the same time, the concentrations of C and Mn in austenite which contribute a lot to the thermal stabilization of austenite are investigated to explain the variation of retained austenite volume fraction. And the microstructure evolution of different annealing temperatures is also observed.
1. Introduction
As TRIP or TWIP effects of metastable retained austenite play important role on the excellent ductility of the TRIP steels and TWIP steels, it may be expected that increasing the metastable austenite volume faction would effectively improve the ductility of the steel.1,2,3,4) And increasing the thermal stability of the reversed austenite will be obviously useful for increasing the volume fraction of the metastable retained austenite.
Large austenite volume fractions resulted from the duration of intercritical annealing which promotes carbon and manganese partitioning from ferrite into austenite have been reported. The alloy amount added into the steel used in these studies is significantly reduced as compared to TWIP steels. Retained austenite volume fraction up to around 40% in 0.1C–6.0Mn alloys was reported by Miller;5) And the medium manganese steels which have mechanical properties of strength 560–1430 MPa and total elongation 10–36% were reported by Merwin.6) And the new-type medium manganese steels with 3 wt.% to 9 wt.% Mn studied in our previous work7,8,9,10,11) were also reported to be able to produce substantially improved mechanical properties with total elongation high up to 30–40% and strength high up to 1–1.5 GPa. And the heat treatment process used by us for the medium manganese steels is that the steel will be firstly austenitized at a relative high temperature and then followed by intercritical annealing which can obtain about 30–40 vol.% retained austenite with ultrafine duplex structure.11)
And as the alloying element has strong effect on the stability of the reversed austenite, increasing the concentration of Mn and C in the reversed austenite can lead to good austenite thermal stability.12,13) So in this work, the chemical composition factor which significantly affects the thermal stability of the reversed austenite was studied. And in detail, the partitioning behavior and the effect of C and Mn elements in 0.2C–5Mn steel during those intercritical annealing process are still not very clear in this study. So the objective of this study is to investigate the C and Mn partitioning behavior in 0.2C–5Mn steel and its effect on the thermal stability of the reversed austenite, the variation of the retained austenite volume fraction and the microstructure evolution of the 0.2C–5Mn steel during those corresponding intercritical annealing processes.
2. Experiment Procedures
The steel ingot with the chemical composition of Fe–0.2C–4.70Mn (in wt.%) and other trace elements as given in Table 1 was prepared by vacuum induction melting. And then the ingot was homogenized at 1250°C for 2 h and forged into rods with diameter of 16 mm. These forged rods were austenized at 850°C for 0.5 h and then water-quenched to room temperature. And then, the rods were cut into small pieces and intercritically annealed at different temperatures with salt bath and followed by water-quenching again. Based on phase diagram as shown in Fig. 1, heat treatments were selected as follows: austenization temperature (TA) 850°C, austenization holding time (tA) 0.5 h, annealing temperatures (TAn) 525°C, 575°C, 625°C, 650°C, 675°C, 725°C, and annealing times (tAn) 10 min, 1 h, 6 h.
Table 1. Chemical composition (wt.%) of the steel in this study.
| C | Mn | Si | P | S | N | Al | Ti |
|---|
| 0.2 | 4.70 | <0.01 | 0.006 | 0.005 | 0.003 | <0.005 | <0.005 |
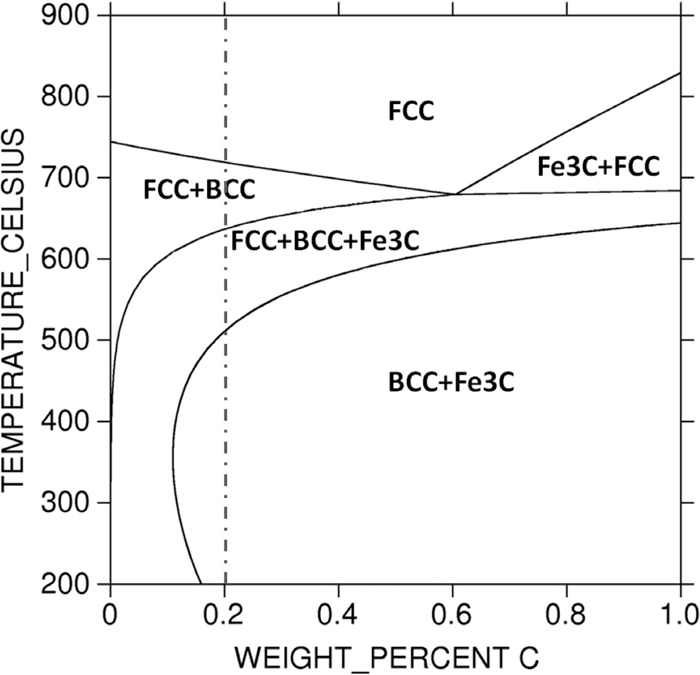
In this paper, the equilibrium phase diagram of the designed steels shown in Fig. 1 was calculated by the Thermo-Calc with the TCFE6 database. Austenite volume fraction of specimens was tested by XRD and microstructures of specimens were characterized by SEM and TEM. Manganese content in ferrite and austenite were measured by TEM-EDS. The hardness tests were performed on a Digital Micro-hardness Tester (FM-300) with 100 g load and the final hardness value is the average result of 5 different points on the sample. Samples for XRD and SEM were mechanically ground, polished with silk and finally electrolytically etched in the solution of 10% chromic acid (for XRD) and etched in 2% natal (for SEM) respectively. And samples for TEM were ground to foils with thickness about 50 μm, and then electro-polished with solution of 5% perchloric acid and 95% alcohol. Samples for hardness tests were mechanically ground and polished with silk. The XRD with Co-Kα radiation was used to measure the volume fraction of the retained austenite. The calculations were performed based on the integrated intensities of (2 0 0)α, (2 1 1)α, (2 0 0)γ, (2 2 0)γ and (3 1 1)γ diffraction peaks. And for each diffraction peak, there was a volume fraction of the retained austenite Vi which was calculated from the integrated intensities of ferrite and austenite peaks with equation (1), and the volume fraction of retained austenite Vγ was the average of Vi.7)
|
V
i
=
1
1+G(
I
α
/
I
γ
)
| (1) |
where I
α and I
γ are the average integrated intensity obtained at (2 0 0)
γ, (2 2 0)
γ, (3 1 1)
γ diffraction peaks and (2 0 0)
α, (2 1 1)
α diffraction peaks.
The carbon content in retained austenite was calculated from the austenite lattice parameters corresponding to their peak positions by the following equation.14)
|
a
γ
=3.556+0.0453
X
C
+0.00095
X
Mn
| (2) |
where a
γ is the austenite lattice parameter in Angstroms (10
–10 m) and X
C (wt.%) and X
Mn (wt.%) are carbon content and manganese content in retained austenite.
3. Results
3.1. Changes in the Volume Fraction of Retained Austenite with Annealing Temperature
Figure 2 shows the changes in the volume fraction of retained austenite (measured by XRD after water-quenched to room temperature) with annealing temperatures for 10 min, 1 hour and 6 hours. The retained austenite volume fraction maintains low value of less than 5% until up to the annealing temperature of 575°C. When above this temperature, the volume fraction increases with raised temperature and presents a maximum value of 33.0% at the temperature of 650°C with 6 h annealing. And the maximum values of austenite volume fraction for 10 min and 1 h annealing are 15.6% and 22.0% which are lower than the value of 6 h annealing. The steep increase in volume fraction when above the temperature of 575°C is generally caused by the reversed transformation from martensite to austenite.15) When above 650°C, the retained austenite volume fraction decreases with the increase of the annealing temperature. And around the 675°C, it can be found that the retained austenite amount decreases with the increasing annealing time.
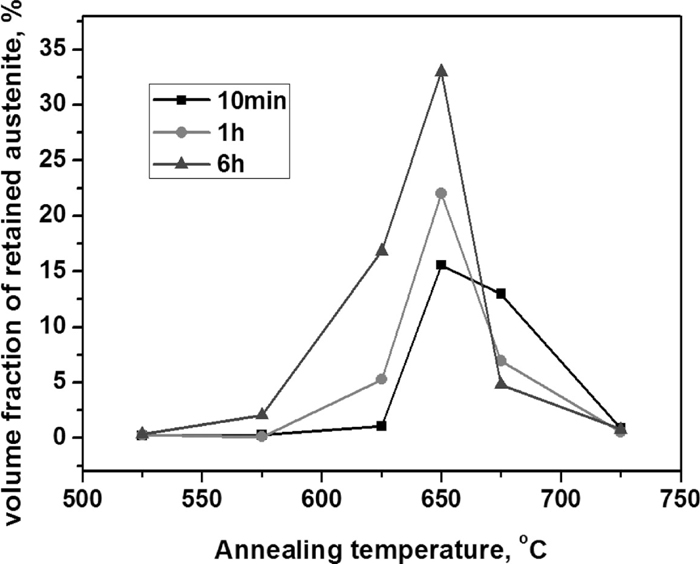
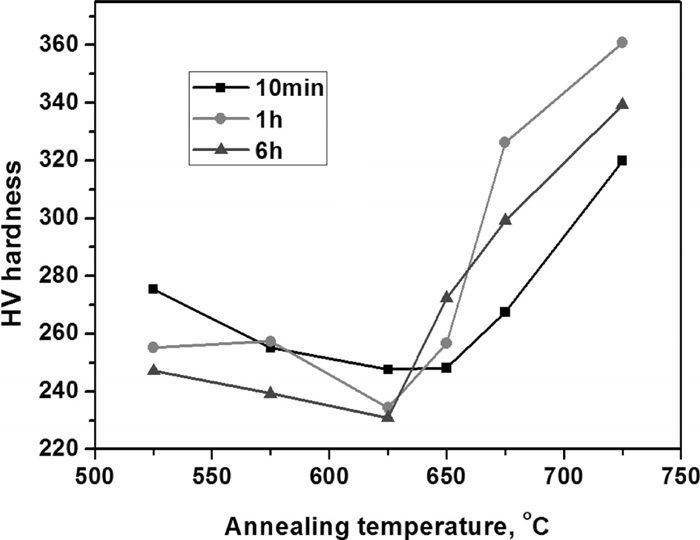
Figure 3 shows the hardness variation with the change of annealing temperature. With raised temperature, the hardness decreases before 625°C, while all increases with elevated temperatures.
3.2. Observation of Microstructures
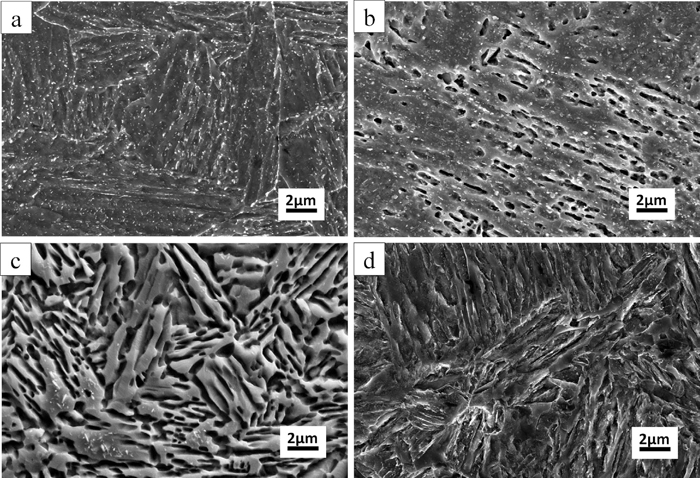
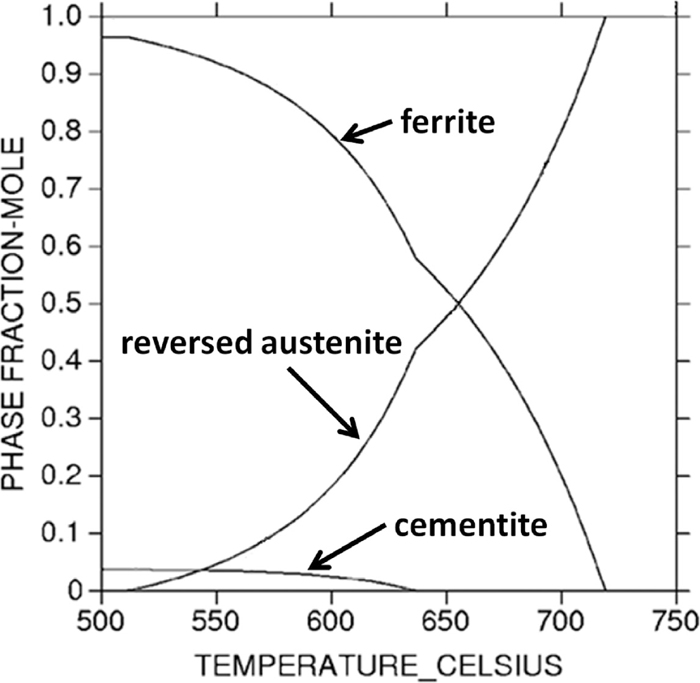
Figure 4 shows the different microstructures (examined by SEM) of 0.2C–5Mn steel annealed 6 h at different temperatures after 850°C austenization with water quenching. It can be found that the carbide precipitated at the low annealing temperatures (Figs. 4(a) and 4(b)). When elevating the annealing temperature, the carbide dissolves and decreases and disappears eventually (Figs. 4(c) and 4(d)). And this agrees well with the cementite curve predicted by thermo-calc as shown in Fig. 7.
It can also be found that, after 6 h annealing at 525°C and water quenching, the whole microstructure consists of large amount of precipitated carbide and martensite-lath structure matrix (as shown in Fig. 4(a)). No austenite can be found. When increasing the annealing temperature, austenite formed and developed primarily along the martensite lath boundaries and remained stable when water-quenched to room temperature,17) and the duplex lath structure formed (as shown in Fig. 4(b)).
When keep on increasing annealing temperature up to around 650°C, the volume fraction of retained austenite increase and the duplex structure becomes clear (as shown in Fig. 4(c)). And this is in a very good agreement with the results as shown in Fig. 2. However, when the annealing temperature high up to 725°C, the duplex lath structure with the retained austenite disappears and becomes single martensite-lath structure again.
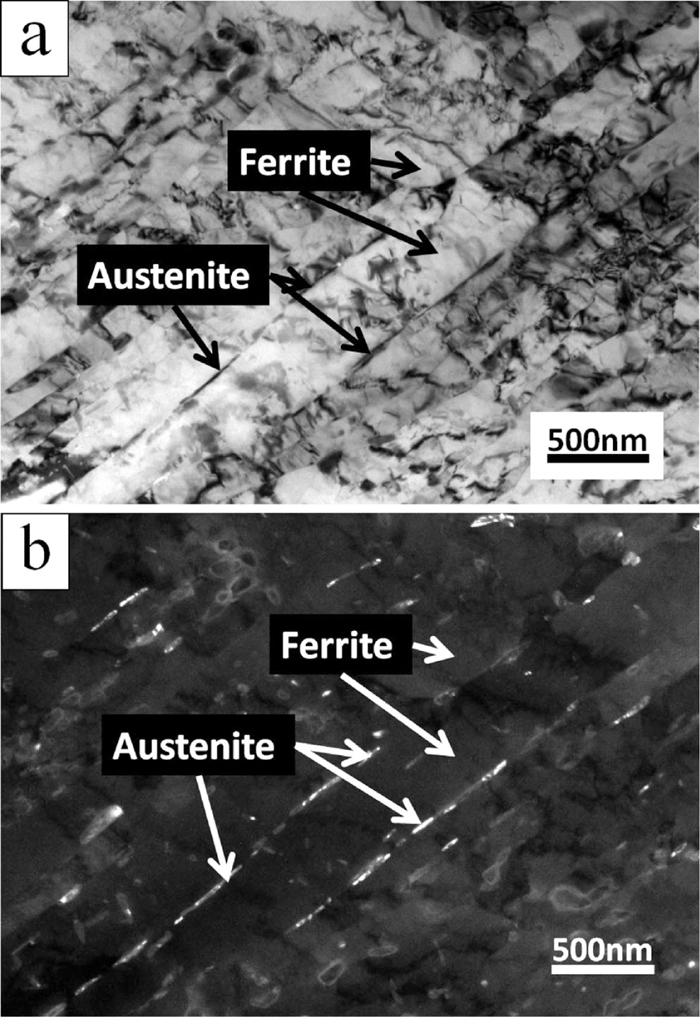
Figure 5 shows the bright field and dark field TEM micrographs of the sample annealed at 525°C for 6 h followed by water quenching. In these TEM images, retained austenite thin film formed along the martensite lath is clearly observed. And the amount of the retained austenite is very small which agrees well with the XRD results shown in Fig. 2.
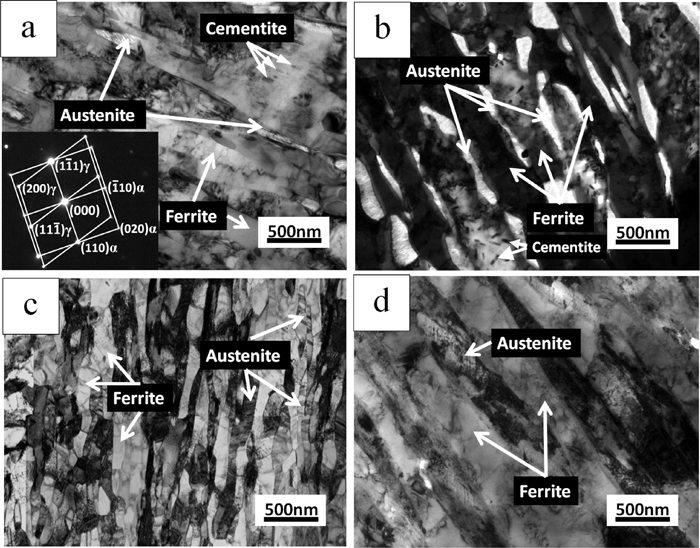
TEM micrographs in Fig. 6 show the microstructure evolution of 0.2C–5Mn steel annealed at different temperatures for 6 h. In the 575°C annealed sample (as shown in Fig. 6(a)), the thickness of retained austenite lath is larger than that of the austenite thin film as shown in Fig. 5. It indicates that the austenite lath grew up as increasing the annealing temperature, which may result in the slight increase of retained austenite volume fraction as shown in Fig. 2. The cementite can be found in the ferrite matrix. At 625°C, it is found (as shown in Fig. 6(b)) that the austenite lath becomes wider and the amount increases a lot. The cementite can also be found here. In the 650°C case (as shown in Fig. 6(c)), a lot of austenite can be found and the thickness of austenite also increases a lot. But the cementite cannot be found here. And when the annealing temperature elevated up to 675°C, the amount of austenite decreases a lot and the duplex structure becomes not very clear.
4. Discussion
Figure 2 shows the retained austenite variation with the change of annealing temperature. The increase of retained austenite before 650°C is generally caused by the reversed transformation from martensite to austenite15) while the decrease has been attributed to the retransformation of the reversed austenite (formed during annealing) into martensite when cooling down.16,17) And the main factor affecting the martensitic transformation was the reversed austenite thermal stability which is heavily related with the annealing temperatures.
Figure 3 shows the hardness variation with the change of annealing temperature. The decrease in hardness between 525 and 625°C is related to the increase of the retained austenite volume fraction, with the maximum at 650°C as shown in Fig. 2.15) And the hardness increase when above 625°C results from the retransformation of reversed austenite which will partly transform to martensite again during cooling.18) And although the retained austenite volume fraction of 650°C is larger than that of 625°C, the hardness increased from 625°C to 650°C due to the increasing of fresh matensite amount.
So here, for understanding the retransformation behaviors, the phase volume fractions in the 0.2C–5Mn steel were calculated by Thermo-Calc as shown in Fig. 7. From Fig. 7, it can be found that the reversed austenite volume fraction increases all the time as increasing the annealing temperature. Before ~630°C, there is a little fraction of cementite in the steel, and with the increase of reversed austenite fraction, the cementite gradually dissolved and disappeared eventually.
Generally, the stability of the reversed austenite (intercritical austenite, formed during the intercritical annealing) can be determined by the martensite start (Ms) temperature. Here, the Ms temperature can be estimated by the formula proposed by Mahieu et al.:19)
|
M
s
=539-423C-30.4Mn-7.5Si+30Al
| (3) |
where the C (wt.%) and Mn (wt.%) are carbon content and manganese content in retained austenite (or reversed austenite, they are the same because of the high cooling rate).
From the formula, we can know that the stability of the reversed austenite is generally determined by its alloy content. When the alloy content in the reversed austenite increases, the Ms temperature decreases, the austenite will become more stable. On the contrary, the stability of reversed austenite will decrease.
In order to evaluate the thermal stability of the reversed austenite, the equilibrium manganese and carbon content in the reversed austenite were calculated and are shown in Fig. 8. In addition, part of the carbon (Fig. 8(a)) and manganese (Fig. 8(b)) content in the retained austenite of the samples (with 6 h annealing) were experimentally measured by XRD and TEM-EDS respectively as also shown in Fig. 8. And it can be seen that the calculation results agree very well with the experimental data.
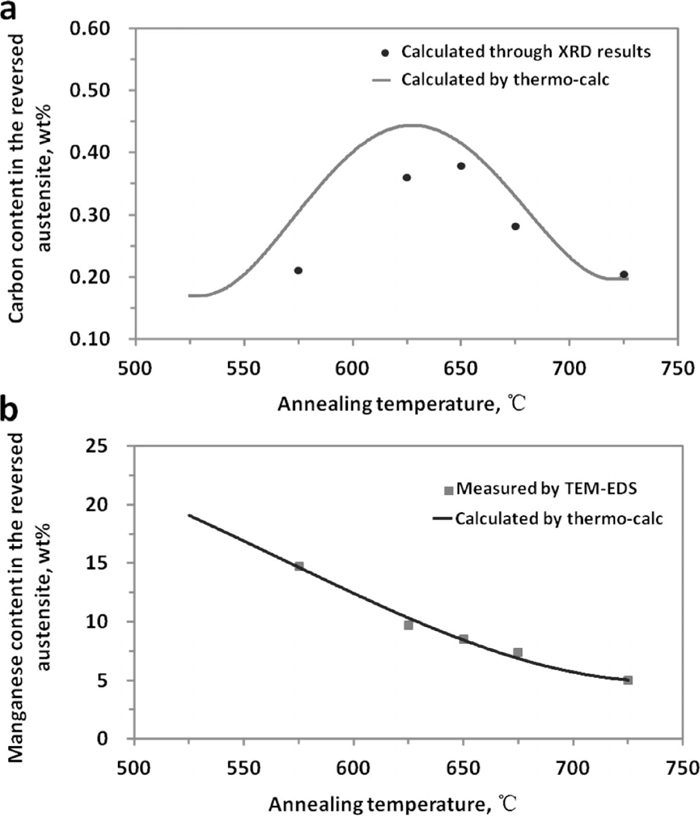
From Fig. 8, it can also be found that both the carbon (Fig. 8(a)) and manganese (Fig. 8(b)) content in reversed austenite of 0.2C–5Mn steel grade as a function of temperature. As the increase of reversed austenite volume fractions (indicated in Fig. 2), the manganese average concentration in reversed austenite continuously decreases with the increase of annealing temperature (shown in Fig. 8(b)). While an obvious peak between 625–650°C was observed in the carbon content curve and this is in a very good agreement with the austenite volume fraction curve which is shown in Fig. 2. The low carbon contents predicted at annealing temperatures lower than 650°C correlate with the presence of cementite as shown in Fig. 7, and the peak temperature generally result from the dissolution of cementite. And the carbon concentration may be considered to be predominant at low annealing temperatures as the manganese diffusion is much slower at those low temperatures.
So when the annealing temperatures are low (less than ~650°C), due to the presence of cementite, the carbon concentrations in reversed austenite are very low, the Ms temperature is high and will lead to the low thermal-stability of the reversed austenite. In addition, at those low annealing temperatures, the reversed austenite volume fractions themselves are also not very high as presented in Fig. 7. As a result, when quenching to room temperature, the volume fraction of retained austenite will not high as shown Fig. 2.
With the increase of annealing temperature, the austenite grows up and the width of austenite lath increases (comparing Fig. 5 with Fig. 6). So the amount retained austenite increased with the increase of annealing temperature (Fig. 2).
When the annealing temperature is around 650°C, due to the enrichment of austenite-stabilized elements (both Mn and C elements as shown in Fig. 8) in reversed austenite, the Ms temperature is low and it is difficult for the grown-up reversed austenite (formed during the annealing process) to retransform to martensite during the quenching. And around this temperature, it is shown in Fig. 4 that the amount of reversed austenite (formed during the annealing process) is relatively high. And thus, the amount of retained austenite (after cooling to room temperature) gets maximum value as shown in Fig. 2.
When above 650°C, with the increase of annealing temperature, the reversed austenite volume fraction arises sharply (as shown in Fig. 7), and thus the concentrations of the manganese and carbon in reversed austenite decrease (as shown in Fig. 8) and result in the increase of Ms temperature which leads to the decrease of thermal-stability of the grown-up reversed austenite. Water quenching hence led to the retransformation of part of the reversed austenite into fresh martensite.17) And the higher the annealing temperature is, the more reversed austenite will transform into the fresh martensite. So while above the 650°C (as shown in Fig. 2), with the increase of annealing temperature, the amount of retained austenite decreases while the amount of fresh martensite increases, which will lead to the increase of hardness (as shown in Fig. 3). At a constant annealing temperature, as the growth of reversed austenite is a dynamic process, with the increase of the annealing time (here are from 10 min to 6 h), the amount of reversed austenite will increase and get close to the equilibrium amount (as shown in Fig. 7) and the average contents of carbon and manganese in the reversed austenite will also decrease, leading to the increase of Ms temperature and the decrease of reversed austenite stability. And that is why the retained austenite amount decreases with the increasing annealing time around the 675°C (shown in Fig. 2).
5. Conclusions
Intercritical annealing treatments were applied on the 0.2C–5Mn steel. The volume fraction of the retained austenite and the microstructure evolution at different temperatures were studied. The results were summarized as follows:
(1) The volume fraction of retained austenite at room temperature for this steel increases as increasing the reversion treatment temperature, and there is a peak at around 650°C, above which the volume fraction decreases with increasing the reversion temperature.
(2) The volume fraction of retained austenite at room temperature after the reversion treatment is determined by both the reversed austenite amount and its stability, and when annealing temperatures are lower than 650°C, the carbon concentrations are considered to be predominant.
(3) Under those different heat treatment conditions, the maximum retained austenite volume fractions were obtained 33.0% at 650°C.
Acknowledgements
This research is supported by National Natural Science Foundation of China (No. 51371057 and No. 51171087) and National Basic Research Program of China (973 program No. 2010CB630803).
References
- 1) A. Arlazarov, M. Gouné, O. Bouaziz, A. Hazotte, G. Petitgand and P. Barges: Mater. Sci. Eng. A, 542 (2012), 31.
- 2) O. Bouaziz, S. Allaina and C. Scotta: Scr. Mater., 58 (2008), No. 6, 484.
- 3) S. Allain, J. P. Chateau and O. Bouaziz: Mater. Sci. Eng. A, 387 (2004), 143.
- 4) J. Zrnik, O. Stejskal, Z. Novy and P. Hornak: J. Mater. Process. Technol., 192–193 (2007), 367.
- 5) R. L. Miller: Metall. Trans. A, 3 (1972), 905.
- 6) M. J. Merwin: Mater. Sci. Forum, 539–543 (2007), 4327.
- 7) H. F. Xu, J. Zhao, W. Q. Cao, J. Shi, C.Y. Wang, C. Wang, J. Li and H. Dong: Mater. Sci. Eng. A, 532 (2012), 435.
- 8) J. Shi, W. Q. Cao and H. Dong: Mater. Sci. Forum, 654–656 (2010), 238.
- 9) C. Y. Wang, J. Shi, W. Q. Cao and H. Dong: Mater. Sci. Eng. A, 527 (2010), 3442.
- 10) J. Shi, X. J. Sun, M. Q. Wang, W. J. Hui, H. Dong and W. Q. Cao: Scr. Mater., 63 (2010), No. 8, 815.
- 11) C. Wang, J. Shi, C. Y. Wang, W. J. Hui, M. Q. Wang, H. Dong and W. Q. Cao: ISIJ Int., 51 (2011), No. 4, 651.
- 12) J. J. Wang and S. van Der Zwaag: Metall. Mater. Trans. A, 32 (2001), 1527.
- 13) S. J. Lee, S. Lee and B. C. De Cooman: Scr. Mater., 64 (2011), 649.
- 14) M. E. Jimenez, N. H. van Dijk, L. Zhao, J. Sietsma, S. E. Offerman, J. P. Wright and S. van der Zwaag: Acta Mater., 57 (2009), No. 2, 533.
- 15) C. G. Lee, S. J. Kim, T. H. Lee and S. H. Lee: Mater. Sci. Eng. A, 371 (2004), 163.
- 16) N. Nakada, T. Tsuchiyama, S. Takaki and N. Miyano: ISIJ Int., 51 (2011), No. 2, 299.
- 17) J. I. Kim, C. K. Syn and J. W. Morris: Metall. Trans. A, 14 (1983), 93.
- 18) E. S. Park, D. K. Yoo, J. H. Sung, C. Y. Kang, J. H. Lee and J. H. SungL: Met. Mater. Int., 10 (2004), No. 6, 521.
- 19) J. Mahieu, J. Maki, B. C. De Cooman and S. Claessens: Metall. Trans. A, 33 (2002), 2573.