Abstract
The coupling between simulations of solidification, microstructure and local mechanical behaviour and simulation of stress-strain behaviour is studied by applying a recently developed simulation strategy to a high pressure die cast aluminium component. In the simulation strategy, named a closed chain of simulations for cast components, the mechanical behaviour throughout the component is determined locally by a casting process simulation. The entire casting process, including mould filling and solidification, is simulated to predict the formation of microstructure and residual stresses throughout the component, and material characterization models are applied to relate microstructural features to local elastic and plastic mechanical material behaviour. The local material behaviour is incorporated into a finite element method (FEM) stress-strain simulation of a realistic load case of the component in service.
In the current contribution the influences of local variations in mechanical behaviour and residual stresses on the component behaviour are investigated. The simulation results for local microstructure and mechanical behaviour are compared to experimental results, and the predicted local mechanical behaviour is incorporated on an element level into the FEM simulation. The numerical effect of the variations in mechanical behaviour is quantified by comparing the results achieved using local behaviour and homogeneous behaviour. The influence of residual stresses predicted by the casting process simulation on the component behaviour is also studied.
The casting process simulation is found to accurately predict the local variations in microstructure throughout the component, and the local variations in mechanical behaviour are well described. The numerical results show that casting process simulation and modelling of microstructure formation, material behaviour and residual stresses are important contributions to correctly predict the behaviour of a cast aluminium component in service. This motivates the use of the proposed simulation strategy, and show the importance of incorporating materials science and casting process simulations into structural analyses of cast components. It is discussed that integration of these areas, e.g. using the closed chain of simulations, is important in order to increase the accuracy of FEM simulations and the product development efficiency in the future.
1. Introduction
In the process of casting aluminium components, it is well known that local variations in component geometry and casting process conditions cause variations in solidification conditions throughout the component. Cast aluminium components thus exhibit local variations in microstructure and mechanical behaviour throughout the component.1,2) The mechanical behaviour of a material is typically characterized by a tensile curve showing the true stress σ (Pa) and the true total strain ε (–). The total strain can be seen as the sum of an elastic and a non-linear plastic contribution, ε = εel + εpl, where the elastic strain εel is commonly described as linearly related to the true stress using Hooke’s law (σ = E*εel, where E (Pa) is the Young’s modulus). Several models are available for describing the non-linear plastic behaviour.3) In the current work the Hollomon equation4) is used, which relates true stress and true plastic strain by the relationship σ = K* (εpl)n, where n (–) is the strain hardening exponent and K (Pa) is called the strength coefficient.
Cast aluminium alloys are typically alloyed with 5–15 wt.% silicon (Si) to enhance castability. Other alloying elements as copper (Cu), magnesium (Mg) and iron (Fe) may also be added to alter the characteristics of the material, e.g. mechanical properties. The local mechanical behaviour is highly related to the microstructural refinement, which is determined by the local cooling rate. A high local cooling rate gives a fine microstructure with a small secondary dendrite arm spacing (SDAS), while a lower cooling rate gives a coarser microstructure and a larger SDAS.5,6) An increased cooling rate also refines the eutectic Si-particles7) and strengthens the dendrites with Si.8) The yield strength of as-cast (not heat-treated) aluminium generally increases with higher cooling rate, i.e. decreasing SDAS.8,9,10) Ultimate tensile strength and elongation to fracture also generally increases with higher cooling rates5,6,7,8,9) but the trends may have variations due to concurrent changes in the morphology of the eutectic Si-particles.11,12) Also the parameters of the Hollomon equation are found to be related to the microstructural refinement and generally decreases as the SDAS increases.13)
Previous research has been performed to model the effect of solidification conditions on the formation of microstructure. In this work the simulations are based on a deterministic modelling approach developed by Wessén et al.14) where the phase transformations are described on the microscopic level by means of kinetic models. The growth velocity of the grains is described as a function of supercooling below the equilibrium temperature. The melt composition is updated at every timestep using Scheil segregeation, and non-linear equations are used to describe the liquidus temperature for each phase as a function of liquid composition.14) By implementing these models into casting process simulation software it is possible to predict the local microstructure formation throughout cast components based on the component geometry and casting process conditions.14) Characterization models have also been developed which relates the parameters of the Hollomon equation to as well microstructural features as chemical composition.1,13,15) For cast aluminium alloys the relationships are based on the local value of SDAS and the iron content of the alloy, and are written on the form13)
|
n=(
a
1
×%Fe+
a
2
)
×ln(
SDAS
)
+(
a
3
×%Fe+
a
4
)
|
|
K=(
b
1
×%Fe+
b
2
)
×ln(
SDAS
)
+(
b
3
×%Fe+
b
4
)
|
where the constants a1 – a4 and b1 – b4 are determined from experimental data. By implementing these relationships into a casting process simulation the local plastic mechanical behaviour throughout the component can be predicted.13) Previous work on the influence of the local variations in mechanical behaviour on the distribution of stress and strain in an aluminium component subjected to a load has however not been found in the literature. Though finite element method (FEM) based stress-strain simulation methods for cast aluminium components have been proposed, they are focused on the influence of other microstructural features, e.g. porosity or silicon particles,16,17,18) rather than the local variations in strength.
A simulation strategy was recently proposed by the current authors,19) which aims to incorporate the local variations in mechanical behaviour predicted by a casting process simulation into stress-strain simulations of the component. The simulation strategy is denoted the closed chain of simulations for cast components,19) and is schematically illustrated in Fig. 1. The simulation strategy is based on previously the previously described solidification and microstructure characterization models implemented into a development version of the commercial casting process simulation software MAGMAsoft20) to predict the local variations in microstructure and mechanical behaviour throughout a component. The predicted mechanical behaviour is incorporated into a FEM stress-strain simulation. The FEM simulations are thus based on the predicted microstructure variation throughout the component. In previous work the simulation strategy has been applied to a ductile iron component.21,22) The strategy has however not been previously applied to a cast aluminium component.

The current work aims to show the extension and application of the closed chain of simulations for cast components to cast aluminium components. The simulation strategy application is investigated using a high pressure die cast (HPDC) aluminium component, and the effects of the local variations in mechanical behaviour in a FEM simulation of the component are evaluated. The effect of these variations affects the design process for cast components, and the results of this study thus directly influences the work of metallurgists as well as CAE engineers, design engineers and foundry engineers.
2. Experimental Setup
2.1. Simulation Setup
The component used in the current study is a flywheel housing for a truck engine. The casting process simulation for the component is performed using a development version of the commercial casting process simulation software MAGMAsoft,20) which is based on the finite difference method (FDM). Previously developed models for solidification, microstructure formation and material characterization1,13,14,15) are implemented into the software, and the entire HPDC process is simulated, including mould filling, solidification, microstructure evolution, characterization of mechanical behaviour and formation of residual stresses. Due to confidentiality restrictions not all details of the simulation model are included in the current work, e.g. a simplified ingot and casting system is used in the simulation compared to in the real casting process. The results are mapped from the FDM mesh to the FEM mesh using the MAGMAlink module of MAGMAsoft.20)
An in-house developed software19) is applied to create the material definitions needed for the FEM simulations. One FEM simulation is performed using element individual material definitions, i.e. one unique material definition is created for every element of the FEM mesh. For the current FEM mesh about 550000 material definitions are thus created to describe the local variations in mechanical behaviour throughout the component. This simulation is in the following denoted LOCAL. To isolate and evaluate the effect of the very variations in mechanical behaviour, one FEM simulations is also performed using a homogenised material description. This material description is based on the average values of the parameters of the Hollomon equation throughout the component, this way a highly representative but homogeneous material description of the material in the component is created. The FEM simulation using the homogeneous material description is denoted HOMOGENISED. The load case is defined by adding surrounding parts using point masses and geometrical boundary conditions, and a gravity load linearly increasing from 0 g up to 25 g (where g = 9.82 m/s2 is the gravitational acceleration) is then applied with an increase of 2.5 g at every timestep. This load level is selected to obtain stresses in the range of the ultimate tensile strength of the material in the component. The FEM simulations are performed using ABAQUS23) implicit FEM-solver.
The results from the FEM simulations are evaluated by studying the difference in the von Mises effective stresses and strains in the component. The maximum values are extracted for every timestep of the simulation together with the values in 10 gauge elements selected in different positions throughout the component. The gauge elements are positioned in areas which exhibit high stresses and strains during the simulation, but are not at any load the elements where the maximum stress or strain is obtained. The relative difference between the value of stress or strain in the HOMOGENISED simulation (H) compared to the corresponding value in the LOCAL simulation (L) is then calculated. This difference can be considered as the error in predicted maximum stress or strain due to the assumption of homogeneous material behaviour in the FEM simulation. Two types of errors are evaluated in the current work:
• Max-Value Error, MVE (%), is the relative difference between the maximum von Mises stress or strain, i.e. MVE = (H–L)/L×100. A positive value of MVE means that the HOMOGENISED simulation predicts a higher value than the LOCAL.
• Average Gauge Error, AGE (%), is the mean value of absolute relative errors in the 10 gauge elements. Since the absolute values are used, the AGE is always positive.
2.2. Material Evaluation
The material used in the component under consideration is an EN AC 46000 alloy. This is a standard alloy for HPDC with a tabulated 0.2% yield strength of 140 MPa, and an ultimate tensile strength of 240 MPa. The chemical composition of the current material was measured using optical emission spectrometry, see Table 1. Though the solidification models used in the casting process simulation14) are able to handle the chemical composition of the current alloy, the material characterization models currently implemented13) have been developed for sand cast aluminium alloys with an iron content of up to 0.65% Fe. As seen in Table 1 the current alloy however contains about 0.8% Fe. HPDC alloys typically have a higher iron content than sand casting alloys in order to avoid die sticking. The higher iron content is expected to reduce the mechanical properties,8,9,10,13) and may thus cause a difference between predicted and measured mechanical properties in the current work.
Table 1. Measured chemical composition of the investigated alloy.
| Element | Si | Fe | Cu | Mn | Mg | Cr | Ni | Zn | Ti |
|---|
Content
(wt.%) | 9.8 | 0.81 | 2.73 | 0.22 | 0.21 | 0.03 | 0.04 | 0.6 | 0.03 |
Microstructure and tensile test samples were taken from 10 different positions on the component, selected to cover the variation in microstructure refinement predicted by the casting process simulation. The microstructure samples were polished and examined using optical microscopy. Secondary dendrite arm spacing is not always easily measured. In this work dendrite stems cut so that several secondary dendrite arms connected on the same stem could be seen were identified. The length of a line from the centre of one dendrite to the centre of another dendrite from the same stem, passing over at least one intermediate dendrite arm and perpendicular to the direction of the dendrites, was measured. The average SDAS for the stem was then determined by dividing this distance with the number of dendrite arm spacing’s covered by the line. No less than 3 measurements were made on each location. Samples for tensile testing were taken from 10 positions on the component. Flat tensile samples were prepared according to ASTM Standard B557M-02a, with a width of 6 mm, a thickness of 4 mm and a reduced section length of 32 mm. Tensile tests were performed using a Zwick/Roell Z100 tensile testing machine with a load cell capacity of 100 kN at room temperature with a crosshead speed of 0.35 mm/min. Strain was measured using a laser extensometer.
3. Results and Discussion
3.1. Microstructure
The variation in secondary dendrite arm spacing (SDAS) predicted by the casting process simulation is shown in Fig. 2. The variation throughout the component is complex and related to the variations in geometry and the heat extraction during the solidification. In general a difference between thinner and thicker regions of the component is noted, which is explained by the differences in solidification times for thin and thick sections, respectively. Different variations in geometry however cause different solidification conditions and microstructures throughout the component. Table 2 shows a comparison between simulated and measured variation in SDAS on different locations throughout the component. Table 2 shows that there is a very good agreement between simulated and measured SDAS in most regions. However a significant difference between simulations and measurement is noted in some regions, e.g. region 1. Further investigation showed that this difference could be explained by the use of a simplified casting model in the simulation, and the conditions assumed in this region in the simulation are not representative of the actual casting conditions. In all areas where the simulation conditions correspond to the actual conditions there is however a very good agreement between simulated and measured data. The results thus show that the microstructure formation models are able to provide an accurate description of the variation of SDAS throughout the component.

Table 2. Comparison between simulated and measured range of SDAS in different regions of the component.
| Region no. | Measured SDAS (μm) | Simulated SDAS (μm) | Difference (μm) |
|---|
| 1 | 6–9 | 12–14 | 3–8 |
| 2 | 5–7 | 10–12 | 3–7 |
| 3 | 6–8 | 6–10 | 0–2 |
| 4 | 6–9 | 7–12 | 0–3 |
| 5 | 5–7 | 8–12 | 1–5 |
| 6 | 7–9 | 8–12 | 0–3 |
| 7 | 7–9 | 8–12 | 0–3 |
| 8 | 19–21 | 17–21 | 0–2 |
| 9 | 19–23 | 18–24 | 0–5 |
| 10 | 7–10 | 8–12 | 0–5 |
The Young’s modulus in cast aluminium alloys is highly related to the chemical composition of the alloy. In the current simulations a constant Young’s modulus is thus predicted throughout the component. This is an important difference from the results reported in in the previous study of a ductile iron component.21,22) The Young’s modulus in cast iron is related to the chemical composition of the alloy and the morphology of the graphite precipitates.24) In ductile iron variations in solidification conditions cause variations in graphite morphology, thus a variation in Young’s modulus is obtained throughout a ductile iron component.
The strain hardening exponent and the strength coefficient in cast aluminium alloys are however, as previously discussed, related to the local microstructure refinement. The predicted values of both the strain hardening exponent and the strength coefficient thus exhibit a variation throughout the component, see Fig. 3.
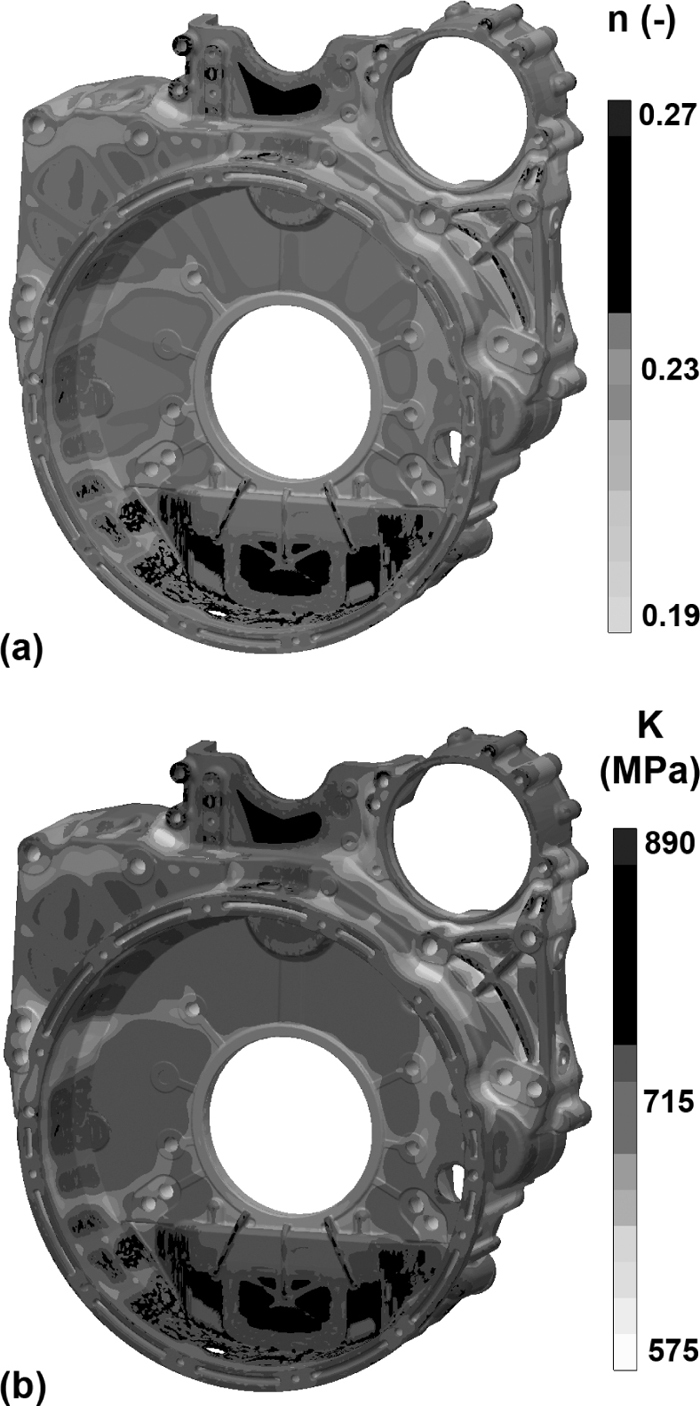
Figure 4 shows a comparison between the simulated and measured tensile curves on two different locations in the component, one with a fine microstructure (SDAS 6–8 μm) and one with a coarser microstructure (SDAS 14–16 μm). It is seen that the material characterization model have rather accurately predicted the tensile curve for the fine microstructure, but the coarser microstructure is somewhat less accurately predicted, especially in the low plastic strain regime. This can be explained by the previously mentioned difference in iron content used in the simulation models as compared to the actual iron content in the component. The model is developed for aluminium alloys containing up to 0.6 wt.% iron. Only 0.6 wt.% can thus be considered in the simulation, while the current alloy contains about 0.8 wt.% iron. An increased iron content is generally known to reduce the mechanical properties of cast aluminium alloys due to an increased amount of iron-rich intermetallic phases, in particular the plate-like β-phase which significantly decrease mechanical properties.8,9,13) As shown by Seifeddine et al.13) this difference is however most significant for coarse microstructures, where an increased iron content reduces as well the strain hardening exponent as the strength coefficient. For a fine microstructure this effect is however not as significant since the short solidification time limits the possibilities for formation and growth of β-phase platelets.13) The current characterization model is thus able to predict the mechanical behaviour of the current alloy accurately in the case of a fine microstructure, but not in the case of a coarse microstructure.

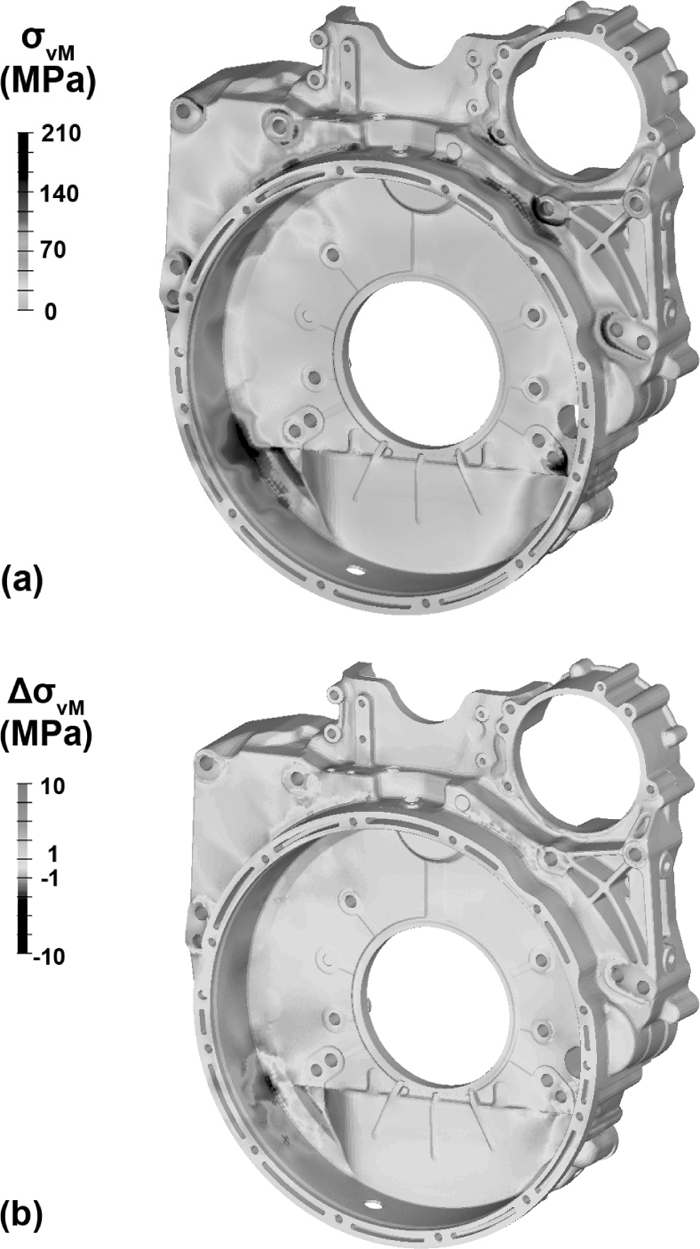
The stress distribution predicted by the LOCAL simulation at a load of 15 g is shown in Fig. 5(a). The HOMOGENISED simulation predicts a slightly different stress distribution at the same load. By subtracting the results from the LOCAL simulation from the HOMOGENISED simulation results a visual comparison of the difference can be displayed, see Fig. 5(b). Comparing Figs. 5(a) and 5(b) it is noted that the results are very similar except for small differences in regions subjected to high load, e.g. geometrical stress concentrations.
The obtained errors in maximum stress and strain values (MVE) are shown in Fig. 6(a), and the errors in the gauge elements (AGE) in Fig. 6(b). Though the two simulations both uses the same constant value of Young’s modulus throughout the component, it is noted that already before the tabulated 0.2% offset yield stress is reached (indicated by the grey dotted line) there is a difference in maximum stresses and strains between the two simulations. This is explained by the non-linear behaviour predicted by the Hollomon equation even at plastic strains less than 0.2%. The material behaviour is thus non-linear already before the 0.2% yield stress is exceeded, and though the difference between the LOCAL and HOMOGENISED material description is small it is large enough to affect the simulation results. As the load increases the variations in plastic behaviour leads to an increased difference in simulation results. It is also noted that the MVE of stress is positive at low load levels, but negative for higher loads. This means that the HOMOGENISED simulation predicts a higher stress than the LOCAL simulation at low loads, but a lower stress at higher loads. The MVE for strain is however negative for all loads, i.e. the HOMOGENISED underestimates the strain level at all loads.

Comparing the level of error obtained in the current work with the results previously obtained for a ductile iron component21) it is noted that the level of error is significantly lower in the case of aluminium compared to the ductile iron case, where up to 20% error was obtained. For the ductile iron component the variations in mechanical behaviour were in addition found to affect not only the value of maximum stress and strain, but also the behaviour of stress concentrations by altering the predicted position of maximum stress and strain.21) This effect is not as significant in the current work. In general the effects of the variations in mechanical behaviour are found to be smaller in the case of a HPDC aluminium component compared to a sand cast ductile iron component.
The HPDC process is known to cause high residual stresses due to fast solidification and rigid moulds which restrains the shrinkage during solidification. For the current component the casting process simulation predicts residual stresses up to about 150 MPa. To compare the effect of the local variations in mechanical behaviour respectively the effect of residual stresses on the FEM simulation results, the MVE and AGE for these simulations are also evaluated. The result using local mechanical behaviour and residual stresses is now used as the reference value to which the value in the simulation with local mechanical behaviour but without residual stresses (LOCAL) and the simulation with homogenised material behaviour and residual stresses (HOM.+RS) are compared, see Fig. 7. It is seen in Fig. 7 that both the MVE, Fig. 7(a), and the AGE, Fig. 7(b), are highly affected by the residual stresses. At low loads this effect is very large, and the local variations in mechanical behaviour give a small contribution which is hardly noticeable. As the applied load increases, the effect of the residual stresses however decreases and the effect of the local variations in mechanical behaviour becomes noticeable. This is similar to the results found for the sand cast ductile iron component.21) In the current case the residual stresses are however higher and thus gives a larger contribution to the predicted levels of stresses and strains.

Though the contribution from the local variations in mechanical behaviour to the predicted distribution of stresses and strains in the current study is found to be numerically relatively small in the case of a static load, they are likely to have a larger impact in the case of dynamic load or fatigue load. The local cooling rate affects not only SDAS but also e.g. the morphology of Si-particles, intermetallic compounds and porosity. The local variations in microstructure thus does not only cause variations in the static behaviour, as studied in the current work, but also cause a variation in fatigue resistance throughout the component, and thus affects the performance of component in service.9,25) It is therefore proposed that the variations in microstructure and mechanical behaviour are highly relevant to consider in structural analyses of cast aluminium components. Since material performance and component geometry are mutually dependent it is important to integrate aspects from materials science, design and manufacturing into a common simulation methodology in order to be able to develop optimized and robust cast components in the industry. This emphasizes the importance of continued development of simulation and modelling tools for cast aluminium components in the future.
4. Conclusions
In the current work the simulation strategy the closed chain of simulations for cast components has been implemented and verified for a high pressure die cast component. It is found that:
• The simulation strategy is able to capture the local variations in microstructure and mechanical behaviour throughout the component. The predicted microstructure variation shows very good agreement with experimental data. The mechanical behaviour shows reasonable agreement with experimental data, but the characterization models should be extended to accurately describe the effect of the higher iron content in HPDC alloys.
• The local variations in mechanical behaviour slightly affect the stress and strain distributions predicted by the FEM simulation. The effect is smaller in HPDC aluminium than in sand cast ductile iron, but noticeable. The effect begins before the 0.2% yield stress is reached, and increases with increasing load.
• Residual stresses significantly affect the stress level at low loads. At higher plastic loads the effect of the local variations in mechanical behaviour however becomes visible.
• Integration of materials science, design and manufacturing, e.g. using the closed chain of simulations for cast components, is important in order to increase the accuracy of FEM simulations and enable efficient development of optimised and robust cast components.
Acknowledgement
The Swedish Knowledge Foundation is gratefully acknowledged for financially supporting the COMPCast research profile at the School of Engineering, Jönköping University, in which the current work has been performed as part of the CCSIM project. Volvo Group Trucks Technology AB and Ljunghäll AB are greatly acknowledged for as well virtual and physical components as cooperation in the project. The authors would also like to thank master student Mohammad Ghorbani and assistant professor Salem Seifeddine for assistance with sample preparation and material testing.
References
- 1) S. Seifeddine, M. Wessén and I. L. Svensson: Metall. Sci. Technol., 24 (2006), 26.
- 2) L. Ceschini, A. Morri, A. Morri and G. Pivetti: Mater. Des., 32 (2011), 1367.
- 3) Z. Gronostajski: J. Mater. Process. Technol., 106 (2000), 40.
- 4) J. H. Hollomon: Trans. AIME, 162 (1945), 268.
- 5) P. Kumar and J. L. Gaindhar: AFS Trans., 104 (1997), 635.
- 6) P. R. Goulart, J. E. Spinelli, W. R. Osório and A. Garcia: Mater. Sci. Eng. A, 421 (2006), 245.
- 7) Q. G. Wang: Metall. Mater. Trans. A, 34 (2003), 2887.
- 8) S. Seifeddine, S. Johansson and I. L. Svensson: Mater. Sci. Eng. A, 490 (2008), 385.
- 9) L. Ceschini, I. Boromei, A. Morri, S. Seifeddine and I. L. Svensson: J. Mater. Process. Technol., 209 (2009), 669.
- 10) S. Seifeddine and I. L. Svensson: Metall. Sci. Technol., 27 (2009), 11.
- 11) C. H. Cáceres, C. J. Davidson, J. R. Griffiths and Q. G. Wang: Metall. Mater. Trans. A, 30A (1999), 2611.
- 12) C. H. Cáceres, C. J. Davidson and J. R. Griffiths: Mater. Sci. Eng. A, 197 (1995), 171.
- 13) S. Seifeddine and I. L. Svensson: Mater. Des., 31 (2010), 6.
- 14) M. Wessén, I. L. Svensson, S. Seifeddine, J. Olsson and W. Schäfer: Modeling of Casting, Welding and Advanced Solidification Processes (MCWASP) XI, TMS, Warrendale, PA, (2006), 693.
- 15) I. L. Svensson, S. Seifeddine, J. Hattel, P. Kotas and J. Thorborg: Modeling of Casting, Welding and Advanced Solidification Processes (MCWASP) XII, eds. by S. L. Cockcroft and D. M. Maijer, TMS, Warrendale, PA, (2009), 129.
- 16) M. F. Horstemeyer and P. Wang: J. Comput. Aided Mater. Des., 10 (2003), 13.
- 17) C. Dørum, H. I. Laukli and O. S. Hopperstad: Comput. Mater. Sci., 46 (2009), 100.
- 18) P. Li, D. M. Maijer, T. C. Lindley and P. D. Lee: Mater. Sci. Eng. A, 460–461 (2007), 20.
- 19) J. Olofsson and I. L. Svensson: Mater. Des., 34 (2012), 494.
- 20) MAGMAsoft, MAGMA Gmbh.: Aachen, Germany, (2011).
- 21) J. Olofsson and I. L. Svensson: Modeling of Casting, Welding and Advanced Solidification Processes XIII, IOP Science, Bristol, (2012).
- 22) J. Olofsson and I. L. Svensson: Mater. Design, 43 (2013), 264.
- 23) ABAQUS Manual, Dassault Systèmes Simulia Corp., Providence, (2009).
- 24) T. Sjögren and I. L. Svensson: 8th Int. Symp. on Science and Processing of Cast Iron (SPCI8), Tsinghua University Press, Beijing, (2006).
- 25) Q. G. Wang, D. Apelian and D. A. Lados: J. Light Met., 1 (2001), 85.