Abstract
Development of dendritic grain structure and meso‑segregation leading to localized intergranular eutectic is simulated during directional solidification of an Al ‑ 3.5 wt% Ni alloy with two pulling velocities (4 μm s–1 and 8 μm s–1) using a two‑dimensional (2D) Cellular Automaton – Finite Element (CAFE) model. 2D CAFE simulations are compared with in situ and real-time experiments characterized by means of X-ray radiography at the European Synchrotron Radiation Facility (Grenoble, France). Two nucleation models are used. The first model is established by listing all measured positions and orientations of experimentally-observed nucleation events. The undetermined value of the nucleation undercooling is then set to 0°C for all nucleation sites. The other model considers a stochastic model with a Gaussian distribution of the nucleation site as a function of the undercooling. It is derived from series of experiments. The influences of the nucleation models and liquid convection on the grain structure characteristics are numerically investigated. A good agreement with experimental observations is achieved concerning the evolutions of both the dendritic and the eutectic growth fronts (i.e., the size of the mushy zone). The predicted grain size and elongation are compared with measurements for the two nucleation laws. Simulations using the list of nucleation events reach better agreement with the longitudinal profiles of the grain equivalent diameter and elongation factor compared to the stochastic nucleation model. Direct tracking of the eutectic growth front as well as three‑dimensional analyses are found to be required for improvement of the predictions.
1. Introduction
Understanding and predicting primary and secondary solidification microstructures are important to improve mechanical properties of metallic engineering objects. While a columnar structure without high-angle grain boundaries is required to enhance high-temperature strength and fatigue behavior for the casting of turbine blades,1) an equiaxed structure is preferred in automotive industry as it provides uniform and isotropic mechanical properties.2) Meso-segregation, i.e. intergranular segregation, forms due to a strong accumulation of solute at grain boundaries. It is the most potent origin of classical casting defects such as hot tearing and intergranular crack. Therefore, there is a strong industrial and academic motivation for a deeper understanding of the effects of applied processing conditions on grain structure and on segregation in order to precisely tailor products with adequate properties. This can be satisfied thanks to achievements gained in modeling and in experimental techniques.2,3)
As one of the numerical methods to elucidate complex solidification phenomena, the Cellular Automaton-Finite Element (CAFE) approach has emerged as a powerful tool to simulate realistic grain structure at the casting scale and to predict features such as meso-segregation for both columnar and equiaxed grain structures.4,5,6,7,8,9,10,11,12,13,14,15,16) To validate the reliability of models, thorough comparisons with carefully designed experiments are critical. Since classical metallographic characterization of microstructures from post-mortem analysis of samples gives no direct information on dynamical aspects of solidification, X-ray imaging of metal solidification is a unique tool to study alloy solidification. In situ and real-time observation of structural features can be obtained, such as the evolution of solidification fronts, the formation of segregation, the nucleation and growth of grains as well as their sedimentation.17,18,19,20,21,22,23,24,25,26,27) Based on those in situ experimental data, the capabilities and limitations of the CAFE model can be examined under different processing conditions.
In previous papers,9,10) CAFE simulations have been performed to describe the dendritic grain structure and eutectic distribution in the presence of fluid flow for a sample of refined Al - 3.5 wt% Ni alloy solidified in a Bridgman‑type furnace at a pulling velocity of 4 μm s–1. A fair agreement with in situ experiment was achieved. The key feature of this work was that the nucleation of equiaxed grains was simulated using a list of nucleation events deduced from observations, i.e. measured coordinates and growth orientation.22)
The present work aims to extend the analyses to higher pulling rates, as well as to investigate two different nucleation models. The influences of pulling velocities (4 μm s–1 and 8 μm s–1) on fluid flow as well as on grain structure and meso-segregation during directional solidification of refined Al - 3.5 wt% Ni alloy are numerically studied. The nucleation of equiaxed grains is simulated by means of two nucleation models.9,10,22,23) Convection and nucleation are the main parameters considered for discussion.
2. Experiment
Synchrotron X-ray radiography was used to monitor the in situ evolution of the grain structure during directional solidification in a Bridgman-type furnace at the ID19 beamline of the European Synchrotron Radiation Facility (ESRF) in Grenoble, France. The composition of studied sample was 96.5 wt% Al - 3.5 wt% Ni alloy with addition of 0.5 wt% Al - 5 wt% Ti - 1 wt% Bi to generate particles acting as preferred nucleation sites for new grains. The samples were 40 mm in length, 6 mm in width and 0.15–0.2 mm in thickness. Such a small thickness guarantees sufficient transmission of X-ray beam and does not prevent the establishment of convective flow.10,28) Successive radiographic images were recorded with a ESRF FReLoN camera to display the time evolution of the grain structure. A spatial resolution corresponding to a pixel size of 7.46 μm was selected. To obtain a good compromise between satisfactory contrast and high acquisition rate, the X-ray beam energy was set to 13.5 keV and the acquisition frequency was around 0.3 Hz. In all radiographic images, primary Al-rich dendritic grains appear in light grey, and Ni-rich liquid appears in dark grey. Tracking the growth of eutectic front was also possible in the field of view.
Solidification was started by pulling the sample from the upper hot part of the furnace to bottom cold part. The temperature gradient was adjusted to a value of 3°C mm–1 and held constant during solidification. The initial pulling velocity was about 1.5 μm s–1, leading to the formation of a dendritic columnar structure. After about 4250 s, a sudden increase in the pulling speed was applied to induce the nucleation of equiaxed grains. Two final pulling velocities VP (4 μm s–1 and 8 μm s–1) are studied. A detailed description of the experimental procedure has been given in Refs. 9),10),20).
3. Modeling
3.1. CAFE Simulation
In the present work, the 2D CAFE model is used. 4,5,6,7,8,9,10,13,14) It is only briefly outlined for the completeness of the paper. A detailed description of this model are given in Refs. 6),7),14).
The simulations are performed in Cartesian coordinates. The calculation domain is divided into FE mesh using large-sized triangles (at the scale of several primary dendrite arm spacings) defined by three nodes. Conservation equations written for mass, liquid momentum, energy and average composition are solved over the FE mesh. The average momentum conservation writes as:29)
|
ρ
o
∂⟨ v ⟩
∂t
+
ρ
o
g
l
(
⟨ v ⟩⟨ v ⟩
)
=∇⋅(
μ∇⟨ v ⟩
)
-
g
l
∇p+
g
l
ρ
o
[
1-
β
T
(
T-
T
L
)
-
β
W
(
⟨
w
l
⟩
l
-
w
o
)
]g-
μ
K
g
l
⟨ v ⟩
| (1) |
where
v is the average macroscopic flow velocity,
ρo is the density of the alloy,
μ is the dynamic viscosity,
p is the pressure in the liquid,
gl is the volume fraction of liquid phase,
g is the gravity vector,
K is the permeability given by the Carman‑Kozeny relationship
K=(
g
l3
⋅
λ
2
2
)
/[
180
(
1-
g
l
)
2
]
,
t is the time,
⟨
w
l
⟩
l
is the local solute composition in the liquid phase,
wo is the initial concentration,
T is the temperature,
TL is the liquidus temperature of the alloy,
βT and
βW are the thermal and solutal expansion coefficients, respectively.
The average heat flow equation writes as:14)
|
ρ
o
(
∂ ⟨ H ⟩
∂t
+⟨ v ⟩⋅∇
⟨
H
l
⟩
l
)
-∇⋅(
⟨ κ ⟩∇T
)
=0
| (2) |
where
⟨ H ⟩
is the average enthalpy per unit mass,
⟨
H
l
⟩
l
is the average enthalpy of liquid phase per unit mass,
⟨ κ ⟩
is the average thermal conductivity.
⟨ H ⟩
is a function of temperature, liquid fraction, a constant specific heat and latent heat of fusion per unit mass.
The average conservation of the solute mass for a binary alloy writes as:14)
|
∂ ⟨ w ⟩
∂t
+⟨ v ⟩⋅∇
⟨
w
l
⟩
l
-∇⋅(
D
l
g
l
∇
⟨
w
l
⟩
l
)
=0
| (3) |
where
⟨ w ⟩
is the average composition of solute and
Dl is the diffusion coefficient of solute element in the liquid phase.
A CA grid, made of a regular network of fine squares named CA cells, is superimposed onto the FE mesh. The development of the primary dendritic grain envelopes and the formation of microsegregation due to phase transformation are simulated on CA cells. For that purpose, a dendrite tip growth model6) is used to compute the kinetics of the grain envelops, i.e. the boundary between the mushy zone and the free liquid. The lever rule microsegregation model is used to determine the fraction of phases inside each CA cell of the mushy zone. Two microstructural length scales are yet necessary for the model: the primary dendrite arm spacing, λ1, and secondary dendrite arm spacing, λ2. The primary dendrite arm spacing defines the interaction between the mushy zone and the liquid for solute mass exchange13) and the secondary dendrite arm spacing enters the Carman‑Kozeny relationship for permeability. The values for these quantities are given in Table 1. Direct tracking of eutectic structure is presently not included in this work. A simple isothermal transformation is thus assumed to change the remaining liquid into a fraction of eutectic as soon as the eutectic temperature is reached.
Table 1. Alloy properties, numerical parameters and initial and boundary conditions for simulation of the ESRF experiments in a refined Al - 3.5 wt% Ni alloy.
| Alloy composition (wt%) | 3.5 |
| Liquidus temperature (°C) | 650.0 |
| Eutectic temperature (°C) | 641.6 |
| Segregation coefficient | 0.08 |
| Liquidus slope (°C wt% –1) | –3.1 |
| Eutectic composition (wt% ) | 6.21 |
| Diffusion of Ni in liquid Al (m2 s–1) | 2.2·10–9 |
| Gibbs-Thomson coefficient (°C m) | 2.41·10–7 |
| Density (kg m–3) | 2450 |
| Enthalpy of fusion per unit mass (J kg–1) | 4·105 |
| Heat capacity (J kg–1 °C–1) | 1163 |
| Thermal conductivity (W m–1 °C–1) || Temperature (°C) | 200 || 20 |
| 200 || 641.6 |
| 100 || 650 |
| 100 || 715 |
| Dynamic viscosity (Pa s) | 10–3 |
| Thermal expansion coefficient (°C–1) | 0.11·10–3 |
| Solutal expansion coefficient (wt% –1) | –8.4·10–3 |
| Primary dendrite arm spacing (m) | 800·10–6 |
| Secondary dendrite arm spacing (m) | |
| E1 (Vp = 4·10–6 m s–1) | 150·10–6 |
| E2 (Vp = 8·10–6 m s–1) | 119·10–6 |
| Gaussian nucleation law | |
| Mean nucleation undercooling (°C) | 2.5 |
| Standard deviation (°C) | 0.8 |
| Maximum nucleation density (m–3) | 1.3·1011 |
| FE mesh size (m) | 150·10–6 |
| Cell size (m) | 10·10–6 |
| Initial temperature (°C) | 717.5 |
| Boundary conditions | |
| Sample holder/heating elements | Perfect contact |
| Sample/heating elements | Perfect contact |
| Sample/sample holder | Perfect contact |
| Heat transfer at interface sample/air (W m–2 °C–1) | 2000 |
| Air temperature in contact with sample (°C) | 600 |
| Heat transfer at interface alloy holder/air (W m–2 °C–1) | 3000 |
| Air temperature in contact with holder (°C) | 500 |
| Heating elements/air | Adiabatic |
The position of nucleation sites on which new dendritic grains can form is randomly chosen among the cells of the CA grid. A Gaussian distribution of the undercooling ΔTnucl of the nucleation sites is used:5)
|
dn
d(
Δ
T
nucl
)
=
N
max
Δ
T
σ
2π
exp[
-
1
2
(
Δ
T
nucl
-Δ
T
m
Δ
T
σ
)
2
]
| (4) |
where
n is the density of the nucleation sites, Δ
Tm is the mean nucleation undercooling, Δ
Tσ is the standard deviation and
Nmax is the maximum nucleation density. When a cell
ν containing a nucleation site becomes sufficiently undercooled to nucleate a new grain,
i.e. its undercooling becomes larger than the nucleation site undercooling (Δ
Tν > Δ
Tnucl), a random number is generated to define the grain orientation. This method is stochastic in nature with the given parameters Δ
Tm, Δ
Tσ and
Nmax. Usually, the three parameters are adjusted individually through multiple trial runs to retrieve as close as possible the experimentally characterized grain structure.
5,11) Once this is done, the alloy nucleation parameters are characterized and the model can be used to predict solidification grain structures in various casting conditions. However, in the present study, the parameters of the Gaussian distribution were determined from a series of X-ray radiography experiments conducted at various cooling rates with the same alloy.
23) Besides the stochastic nucleation model, another nucleation model can also be implemented to model the seed distribution. It is later referred to as “measured nucleation model”. Such nucleation model requires specifying three parameters for each nucleation event: the growth orientation, the position and the undercooling. In the present numerical study, for the case of the pulling velocity at 4
μm s
–1, both the position after possible sedimentation and the growth orientation given by the smaller angle between the <100> dendrite trunks and the vertical direction are provided by measurement using X-ray radiography.
10) For the case of the pulling velocity at 8
μm s
–1, only the nucleation positions after sedimentation are measured to be used as input. Since a large number of equiaxed grains (281 grains) come into being at this pulling velocity, growth orientation for each grain is not measured but randomly assigned. This simplification is justified by the fact that stochastically varying growth orientation with nucleation position unchanged has a marginal influence on the principal features of the predicted grain structures. In fact, this is what happens during experiments when applying the same processing conditions: although the exact nucleation position and growth orientation of grains are not identical across different experimental samples, the obtained grain structure is comparable. For both pulling velocities, the nucleation undercooling cannot be measured and is set to 0°C.
9)
3.2. Modeling Configuration
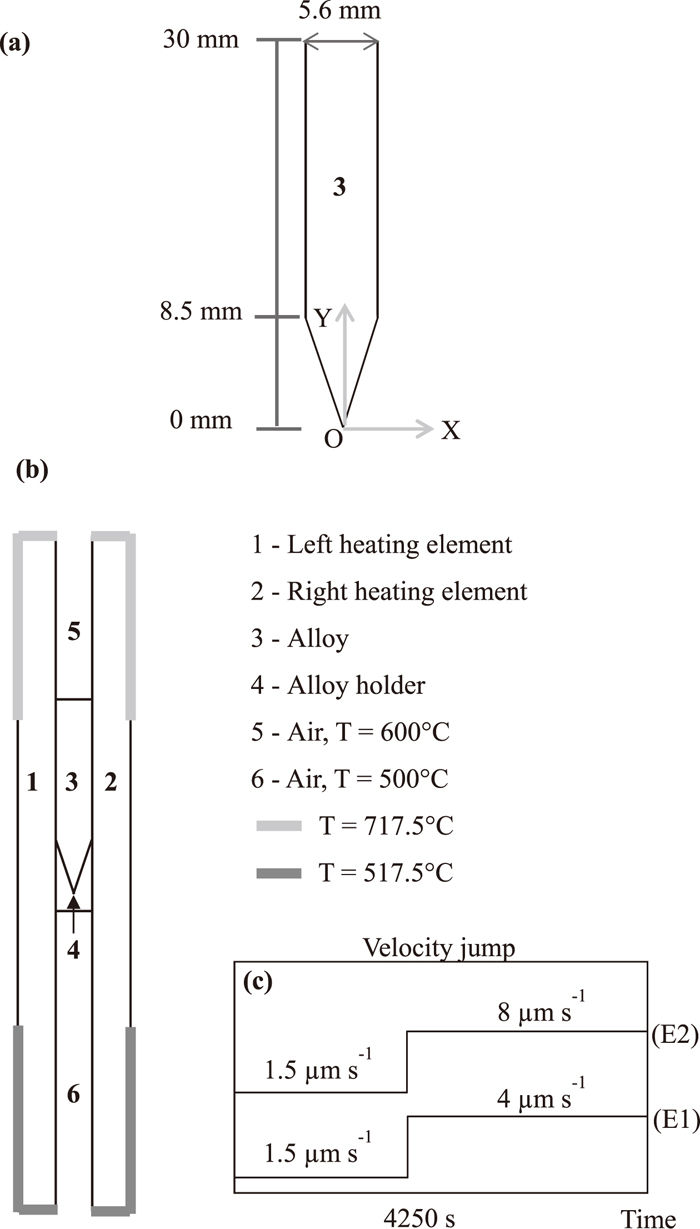
Figure 1(a) shows a schematic representation of the experimental alloy sample with dimensions. Figure 1(b) illustrates the corresponding simulation geometry: domain 3 represents the alloy sample and is inserted between the heating elements (simulation domains 1 and 2) and the alloy holder (simulation domain 4). The thermo-physical properties of the alloy and other parameters used in the simulation are listed in Table 1. The sample is assumed immobile. The thermal boundary conditions associated with the furnace, i.e. imposed temperatures on top and bottom boundaries of the heating elements (Fig. 1(b)), move axially at the pulling rate given in Fig. 1(c) for experiments (E1) and (E2). This change of frame is of no significance with regards to the simulated results. A critical part is to reproduce thermal boundary conditions by imposing proper initial temperatures for the hot and cold heating elements as well as for the top and bottom air (Fig. 1(b)). The temperatures and exchange coefficients are adjusted to reach an agreement between the predicted and measured positions of dendritic tip and eutectic front all along the solidification sequence.9,10)
4. Results and Discussions
4.1. Temperature Field Simulation
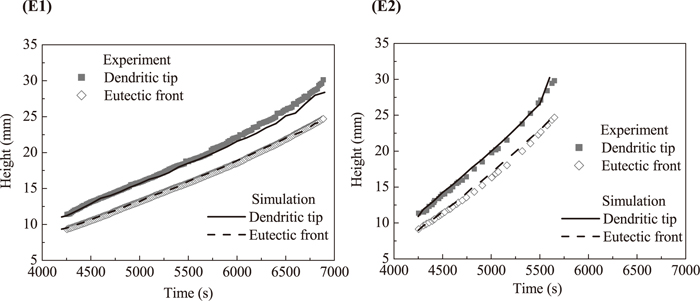
From the X-ray radiographs, the positions of the highest dendritic tip and of the eutectic front can be detected and measured. In the simulation, the former is characterized by the solid fraction gs equal to 10–3 and the latter is determined by the eutectic temperature (641.6°C). The measured and predicted time evolutions of front positions are compared in Fig. 2. A good agreement is reached. The overall kinetics of the growth front in experiment is well reproduced by the CAFE model. This indicates a reasonable selection of the thermal boundary condition for this 2D approximation.
4.2. Convection and Meso-segregation
Since the thermal conductivities of solid, liquid, and crucible are different from each other, a transverse thermal gradient exists at the level of the solid-liquid interface and is at the origin of convection ahead of the solid-liquid interface.30,31) This flow is responsible for the formation of a eutectic border (rejected solute segregates at the periphery) and steepling phenomena (dendrite tips protrude markedly into the liquid phase with eutectic at the base) as observed in the present experiments (Figs. 3(E1) and 3(E2) at 4250 s). As expected,32) with a low pulling velocity (Fig. 3(E1) at 4820 s), the convective flow induces large-sized eutectic borders compared to the case with a high pulling velocity (Fig. 3(E2) at 4820 s).

In CAFE simulations, the two cases present similar flow patterns. As shown in Fig. 4, two relatively strong co-rotating convective rolls (up along the sample walls) are formed in the bulk liquid (gs = 0). Two weak rolls are confined in the mush (gs > 10–3) and below the undercooled front, which do not take part into the main convective recirculation of the bulk liquid. This is coherent with the denser solute stabilization effect expected during solidification of the Al ‑ 3.5 wt% Ni alloy. Since the thermal conductivity of the solid phase is higher than that of the liquid phase, the transverse temperature profile at the solid-liquid interface has a convex shape in line with the experimentally observed interface. The lateral temperature gradient (about 0.3°C mm–1) drives the flow from the relatively cold center towards the hot side walls. So, the rejected heavier solute is transferred to the sides during solidification, and accumulates there. Finally, the meso-segregation is such that the composition near the edge is higher than that in the center as observed in the experiments.

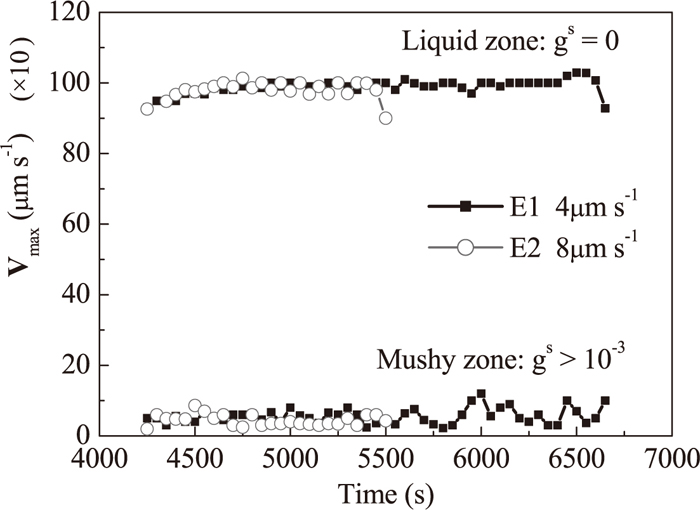
Figure 5 examines the time evolution of the flow velocity amplitude
V
max
=
v
x
2
+
v
y
2
in the bulk liquid and in the mush above the height 8.5 mm indicated in Fig. 1(a). The results show that the flow intensity is comparable for both pulling velocities. The only significant difference is the time period during which the convection interacts with the solidification front. It is related to the ratio between the growth rate and the convection amplitude. In experiment (E2), the solidification front moves upward faster compared to (E1). As a consequence, there is less time in (E2) for the flow close to the dendritic growth front to interact with the fast solidifying dendritic network, even though the flow intensity does not change significantly.
Since the composition field in the experiments cannot be directly measured, the eutectic fraction is used to evaluate the degree of meso-segregation. Figure 6 shows the predicted eutectic distribution. The darkest regions correspond to the location of enriched solute where almost 100% eutectic is predicted. The steepling phenomenon is reproduced, with a high fraction of eutectic at the sides, corresponding to the experimentally-observed eutectic channels. However, the simulated eutectic border deduced from Fig. 6 has a larger size compared to experimental observations. Comparison between Figs. 3 and 6 implies that the predicted flow is stronger than the experimental one, because the decrease of the eutectic border when increasing the pulling velocity during the experimental process cannot be well reproduced. This overestimated flow is able to enhance the periphery segregation that was shown in the simulation without melt convection.10)
4.3. Characteristics of Grain Structure
Figure 7 is constructed for comparison of the experimental and simulated grain structures for experiments E1 and E2. Segmentation of the images in Fig. 3 at 7370 s for E1 and 5930 s for E2 was manually performed by drawing the grain envelopes. The output of such analyses gives the experimental grain structure displayed in Figs. 7(E1‑EXP) and 7(E2‑EXP), respectively. The simulated grain structures using the stochastic nucleation model are available with/without convection, i.e. Figs. 7(E1‑STO‑W)/7(E1‑STO‑WO) and 7(E2‑STO‑W)/7(E2‑STO‑WO) for experiments E1 and E2, respectively. The simulated structures using the measured nucleation law with/without convection for experiments E1 and E2 are given in Figs. 7(E1‑MEA‑W)/7(E1‑MEA‑WO) and 7(E2‑MEA‑W)/7(E2‑MEA‑WO), respectively.
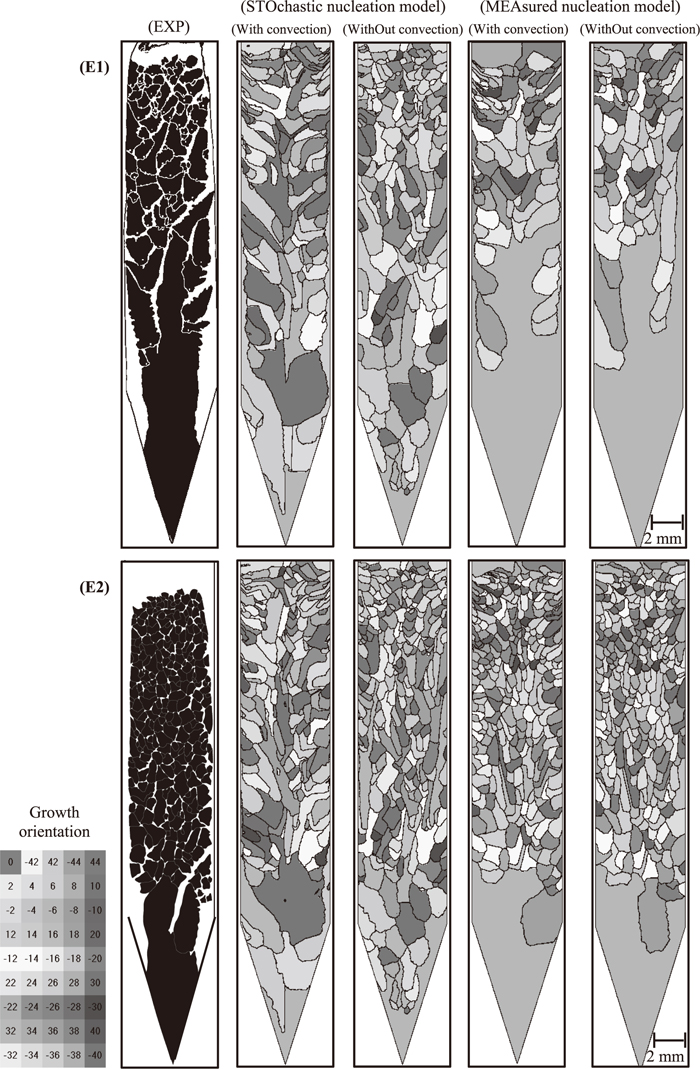
From a qualitative point of view, the columnar‑to‑equiaxed transitions (CET) observed after the increase of the pulling velocities are reproduced in the simulations with both nucleation models (Figs. 7(E1‑STO‑W) and 7(E1‑MEA‑W), Figs. 7(E2‑STO‑W) and 7(E2‑MEA‑W)). The finer grain size or equivalently the higher grain density observed for the highest pulling velocity (Fig. 7(E2‑EXP)) is also retrieved in the simulations for both nucleation models (Figs. 7(E2‑STO‑W) and 7(E2‑MEA‑W)). From a general viewpoint, when compared to the experiments, simulations of the CET using the measured nucleation model give a better representation (Figs. 7(E1‑MEA‑W) and 7(E2‑MEA‑W)). This was expected since the measured nucleation model imposes the position of each nucleation event seen during the experiments.
One/two grains are identified to form during the period of low pulling velocity (1.5 μm s–1) as noted in Figs. 7(E1‑MEA‑W)/7(E2‑MEA‑W). Thus, it/they can propagate for a long distance prior to the formation of the next grains after the velocity jumps. In the case of the stochastic nucleation model, several grains are nucleating in the bottom region despite the constant low velocity, as seen in Figs. 7(E1‑STO‑W) and 7(E2‑STO‑W). This could be due to the adjusted parameters of the Gaussian distribution for bulk nucleation.23) But one could also mention the approximations of the initial conditions. The preparation of the experiment requires a period of incomplete melting and stabilization of the solid-liquid growth front. This corresponds to the very bottom part of the images in Fig. 3 where a fully solid region is observed. This period is not presently simulated, resulting in different initial conditions since simulation starts with fully liquid alloy at nominal composition with no liquid flow. This difference in terms of solute field and convection field would affect the integration of the stochastic nucleation model.
Figures 8 and 9 compare the longitudinal distributions (i.e., along the pulling direction or the OY‑axis in Fig. 1) of the equivalent diameter and the averaged elongation factor deduced from the experimental and simulated grain structures, respectively. For each grain, the elongation factor is computed as the ratio between Lmax/Lmin, i.e. the ratio of the length of the major axis Lmax to the length of the minor axis Lmin, the two axes intersecting orthogonally at the centroid of the grain.33) The equivalent diameter of the grain is calculated assuming its equivalent circular envelope. At a fixed Y position along the main axis of the sample, a scan in the transverse direction (i.e., OX‑axis in Fig. 1) is performed to identify all grains. Then, the elongation factor and the equivalent diameter are averaged over all grains encountered during the scan in the transverse direction. Finally, these mean values are averaged over every 2 mm consecutive lengths along the longitudinal direction, giving the 15 data points drawn in Figs. 8 and 9.
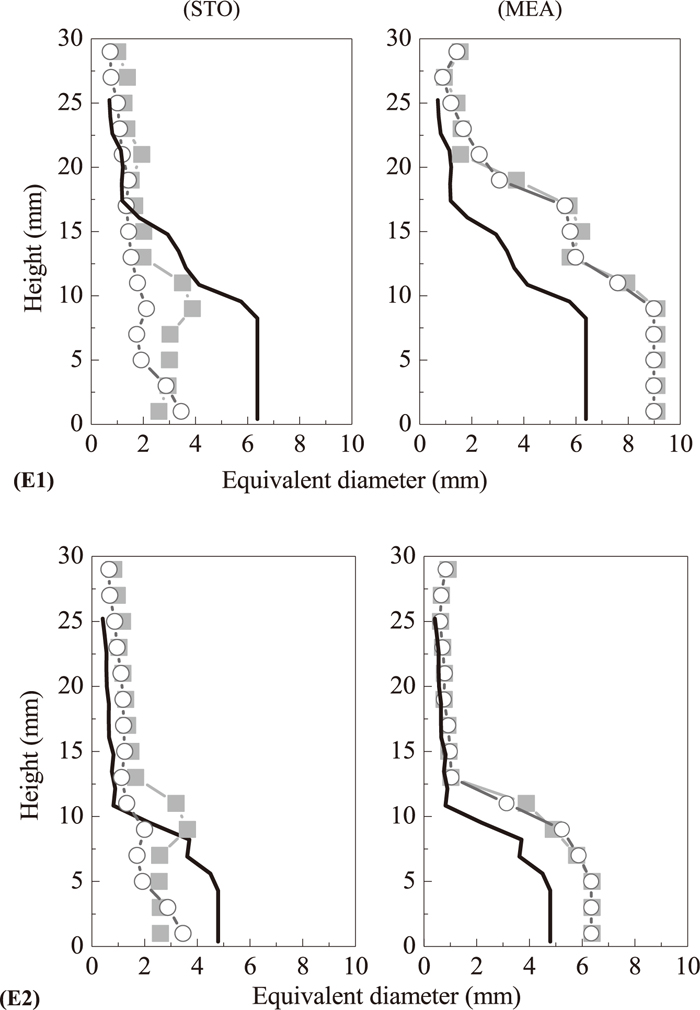
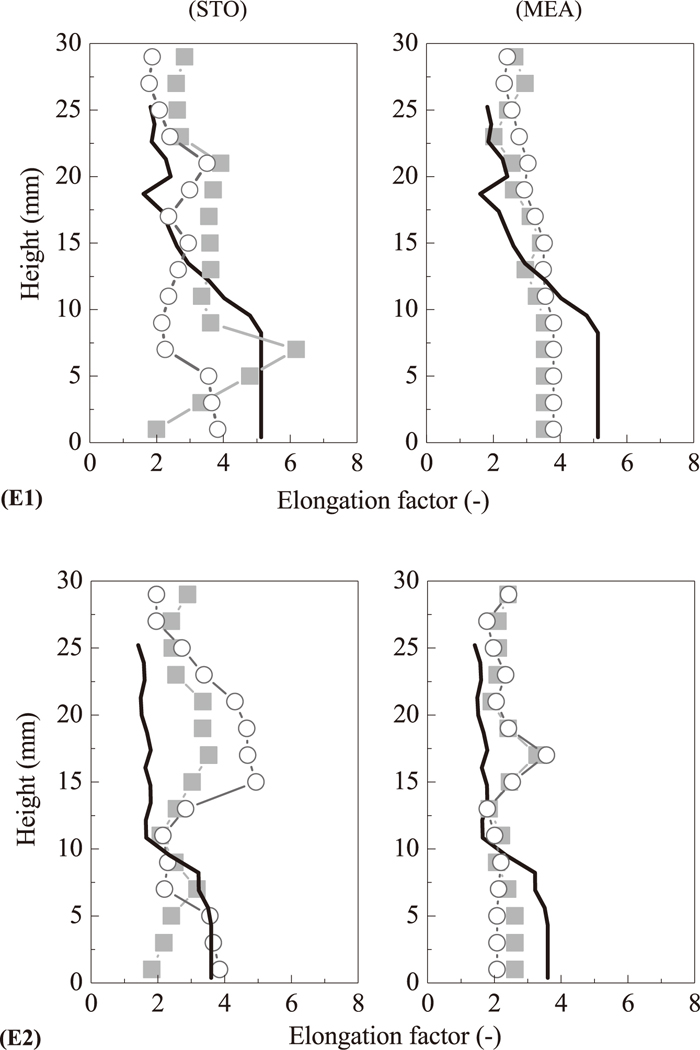
Decrease for both the equivalent grain diameter and the elongation factor is observed in the experiments with increasing pulling velocity. This is the morphological consequence of the CETs induced by the velocity jumps. For simulations using the measured nucleation model (Figs. 8(E1‑MEA) and 8(E2‑MEA)), the evolutions of the longitudinal profiles of equivalent grain diameter are very well reproduced despite an overestimation in the bottom part of the samples. The evolutions of elongation factor are not as good: for E1 (Fig. 9(E1‑MEA)) it does only slightly decrease while the trend is even not found for E2 (Fig. 9(E2‑MEA)). Also worth noticing is the little dependence of the results on the fluid flow. Given the assumption used in the measured nucleation model that nucleation undercooling is 0°C, it is reasonable to expect that the growth undercooling is less influenced by the fluid flow intensity.6) Therefore, the convection does not appear to have a great effect on the simulated grain structure.
The predicted evolutions when using the stochastic nucleation model are shown in Figs. 8(E1‑STO) and 8(E2‑STO) and 9(E1‑STO) and 9(E2‑STO). The longitudinal profiles do retrieve a decrease of the equivalent diameter with the sample height. The evolution for the elongation factor is generally not good and strongly depends on the fluid flow since the profiles with/without convections now differ from each other. As mentioned in the model description, the formation of the eutectic structure is not directly described by the present CAFE model. That is to say, the grain envelopes are enlarged and stretched to enclose the intergranular regions, i.e. the intergranular eutectic as well as the eutectic channels on the sides of the samples (Fig. 3). The over-prediction of elongation becomes more serious for the case where more equiaxed grains nucleate leading to smaller grain size, as the elongation is defined as the ratio of the major axis to the minor axis and very sensitive to any variation in the minor axis.
Another explanation for the overestimation of the elongation factor of the grains, in particular in the central and top regions for simulations reported in Figs. 9(E1‑STO) and 9(E2‑STO), is the 2D approximation of the convective flow. To test this approximation, simulations in the absence of convection are considered. The effect of convection on the grain elongation factor is opposed for E1 and E2 (Figs. 9(E1‑STO) and 9(E2‑STO)). For E1, the grain structure becomes more elongated with convection (Fig. 9(E1‑STO)). This can be explained by examining the formation of the two extremely elongated grains close to the sample borders in Fig. 7(E1‑STO‑W), i.e. forming in the eutectic channels, with elongation factor (–)/length (mm) reaching 7.9/16.9 mm and 10.3/14.4 mm, respectively. In fact, solute enriched liquid moves toward the outer regions, accelerating the horizontal development of the grains that can grow along the sample periphery. Because the nucleation of equiaxed grains ahead of the advancing front is not sufficient to stop their growth at an early stage, these grains can continue their longitudinal development on the periphery of the sample, where the eutectic structure is experimentally observed. The presence of such grains up to the two third of the sample significantly lifts the average value of elongation factor, and could be avoided by including the formation of eutectic grains in the model. For E2, the grain structure is less elongated for the simulation considering convection (Fig. 9(E2‑STO)). Since the grains grow perpendicular to the solidification front, the convex distortion obtained in the convective regimes results in the development of grains towards the sample periphery with the horizontal component being more pronounced as shown in Fig. 7(E2‑STO‑W).10) This in some degree reduces grain elongation.
5. Conclusions
Two Bridgman experiments in a refined Al ‑ 3.5 wt% Ni alloy with pulling velocity jumps 4 μm s–1 and 8 μm s–1 have been characterized using X-ray radiography. Direct simulations of dendritic grain structure and eutectic distribution have been performed using a 2D CAFE model. The influences of two nucleation models as well as the presence of fluid flow on the computed grain structure have been investigated quantitatively.
The predicted evolutions with time of the positions of the dendritic tip and eutectic growth fronts show a good agreement with experiments so that the thermal model is believed to be realistic enough to serve as a basis for the simulation of the grain structure and for sound comparison with experiments. In simulation, increasing pulling velocity does not affect the flow pattern and flow intensity, but reduces the interaction time between the interdendritic fluid flow and dendritic growth. This contributes to lower meso-segregation, which is in line with the experimental observations.
The differences between experiments and simulations are due to that the model still needs improvements. The nucleation and growth of eutectic grains should be included in the model. Extension to 3D is also required in order to improve the simulation of the convection field and to investigate its influence on meso-segregation and dendrite growth kinetics. Finally, although sedimentation is identified in the experiments, it has no significant consequence on the present analyses of the experiments.
Acknowledgements
This research work is supported by the European Space Agency within the ESA MAP CETSOL. The technical support of the ESRF ID19 staff members is greatly acknowledged. Software XR2Sol-CAFE is developed at MINES ParisTech CEMEF.
References
- 1) R. C. Reed: Superalloys, Fundamentals and Applications, Cambridge University Press, Cambridge, (2006), 2.
- 2) J. A. Spittle: Int. Mater. Rev., 51 (2006), 247.
- 3) C. Beckermann: Int. Mater. Rev., 47 (2002), 243.
- 4) M. Rappaz and Ch.-A. Gandin: Acta Metall. Mater., 41 (1993), 345.
- 5) Ch.-A. Gandin and M. Rappaz: Acta Metall. Mater., 42 (1994), 2233.
- 6) Ch.-A. Gandin, G. Guillemot, B. Appolaire and N. T. Niane: Mater. Sci. Eng. A, 342 (2003), 44.
- 7) G. Guillemot, Ch.-A. Gandin and H. Combeau: ISIJ Int., 46 (2006), 880.
- 8) G. Guillemot, Ch.-A. Gandin and M. Bellet: J. Cryst. Growth, 303 (2007), 58.
- 9) G. Reinhart, Ch.-A. Gandin, N. Mangelinck-Noël, H. Nguyen-Thi, B. Billia and J. Baruchel: IOP Conf. Ser., Mater. Sci. Eng., 33 (2012), 012077.
- 10) G. Reinhart, Ch.-A. Gandin, N. Mangelinck-Noël, H. Nguyen-Thi, J. E. Spinelli, J. Baruchel and B. Billia: Acta Mater., 61 (2013), 4765.
- 11) M. Vandyoussefi and A. L. Greer: Acta Mater., 50 (2002), 1693.
- 12) V. B. Biscuola and M. A. Martorano: Metall. Mater. Trans. A, 39 (2008), 2885.
- 13) S. Mosbah, M. Bellet and Ch.-A. Gandin: Metall. Mater. Trans. A, 41 (2010), 651.
- 14) Ch.-A. Gandin: C. R. Phys., 11 (2010), 216.
- 15) T. Carozzani, H. Digonnet and Ch.-A. Gandin: Mod. Simul. Mater. Sci. Eng., 20 (2012), 015010.
- 16) T. Carozzani, Ch.-A. Gandin, H. Digonnet, M. Bellet, K. Zaidat and Y. Fautrelle: Metall. Mater. Trans. A, 44 (2013), 873.
- 17) Y. Chen, A. A. Bogno, N. M. Xiao, B. Billia, X. H. Kang, H. Nguyen-Thi, X. H. Luo and D. Z. Li: Acta Mater., 60 (2012), 199.
- 18) H. Yasuda, Y. Yamamoto, N. Nakatsuka, M. Yoshiya, T. Nagira, A. Sugiyama, I. Ohnaka, K. Uesugi and K. Umetani: Int. J. Cast Met., 21 (2008), 125.
- 19) H. Yasuda, I. Ohnaka, K. Kawasaki, A. Sugiyama, T. Ohmichi, J. Iwane and K. Umetani: J. Cryst. Growth, 262 (2004), 645.
- 20) A. A. Bogno, H. Nguyen-Thi, G. Reinhart, B. Billia and J. Baruchel: Acta Mater., 61 (2013), 1303.
- 21) G. Reinhart, N. Mangelinck-Noël, H. Nguyen Thi, T. Schenk, J. Gastaldi, B. Billia, P. Pino, J. Hartwig and J. Baruchel: Mater. Sci. Eng. A, 413 (2005), 384.
- 22) G. Reinhart, H. Nguyen-Thi, N. Mangelinck-Noël, B. Billia, T. Schenk and J. Baruchel: IOP Conf. Ser., Mater. Sci. Eng., 27 (2011), 012011.
- 23) N. Mangelinck-Noël, J. E. Spinelli, Ch.-A. Gandin, G. Reinhart, H. Nguyen-Thi and B. Billia: IOP Conf. Ser., Mater. Sci. Eng., 27 (2011), 012090.
- 24) H. Jung, N. Mangelinck-Noël, H. Nguyen-Thi, N. Bergeon, B. Billia, A. Buffet, G. Reinhart, T. Schenk and J. Baruchel: Int. J. Cast Met. Res., 22 (2009), 208.
- 25) Q. Dong, J. Zhang, J. F. Dong, H. L. Xie, Z. J. Li, Y. B. Dai, Y. Liu and B. D. Sun: Mater. Sci. Eng. A, 530 (2011), 271.
- 26) D. Ruvalcaba, R. H. Mathiesen, D. G. Eskin, L. Arnberg and L. Katgerman: Acta Mater., 55 (2007), 4287.
- 27) R. H. Mathiesen, L. Arnberg, P. Bleuet and A. Somogyi: Metall. Mater. Trans. A, 37 (2006), 2515.
- 28) H. Nguyen-Thi, Y. Dabo, B. Drevet, M. D. Dupouy, D. Camel, B. Billia, J. D. Hunt and A. Chilton: J. Cryst. Growth, 281 (2005), 654.
- 29) J. A. Dantzig and M. Rappaz: Solidification, EPFL Press, Lausanne, (2009), 484.
- 30) K. Zaïdat, N. Mangelinck-Noël and R. Moreau: C. R. Mecanique, 335 (2007), 330.
- 31) B. H. Zhou, H. Jung, N. Mangelinck-Noël, H. Nguyen-Thi, B. Billia, Q. S. Liu and C. W. Lan: Adv. Space Res., 41 (2008), 2112.
- 32) M. D. Dupouy and D. Camel: J. Cryst. Growth, 183 (1998), 469.
- 33) M. Q. Yang, K. Kpalma and J. Ronsin: Pattern Recogn, ed. by P-Y. Yin, InTech, Shanghai, (2008), 43.