Abstract
The solution behaviors of Fe–Si–C system are characterized by the formation of SiC, and the properties are defined by the value of the standard Gibbs free energy of formation of SiC,
 . However, a review shows that reported values of
do not agree among the investigators and are shown a significant discrepancy among them as high as 16 kJ/molSiC. In order to resolve this uncertainty, new value of
is assessed by reproducing experimentally determined two-fold saturation data with the UIP modeling Fe–Si–C melt. The proposed value of
is given by following equation.
. However, a review shows that reported values of
do not agree among the investigators and are shown a significant discrepancy among them as high as 16 kJ/molSiC. In order to resolve this uncertainty, new value of
is assessed by reproducing experimentally determined two-fold saturation data with the UIP modeling Fe–Si–C melt. The proposed value of
is given by following equation.
With the proposed
, the UIP model for Fe–Si–C system was developed from the experimentally determined solubility of C and two-fold saturations of C and SiC taken from the literature reported. The resulting activity coefficients are expressed as follows:
where

=–2.004+2718/
T,

=2.107–15803/
T,
εCC=9.052+4064/
T,
εCSi=5.101–9647/
T,
εSiSi=9.254+3380/
T,
εCCSi=–7.482+67622/
T,
εCSiSi=–39.72+185440/
T,
εSiSiSi=–35.966+98468/
T,
εCSiSiSi=34.05–160482/
T, and
εSiSiSiSi=20.921–74752/
T.
The model reproduces well the experimentally determined C solubility as well as the two-fold saturation of C and SiC. It also describes well the solution behaviors in a wide range of compositions and temperatures, permitting its use for various applications such as ironmaking, steelmaking, cast-iron, Si-based ferroalloys, and the low temperature liquid phase growth of electronic grade silicon carbide.
1. Introduction
Iron, silicon, and carbon serve as common ingredients for processes of ironmaking, steelmaking, cast-iron, Si-based ferroalloys, and the low temperature liquid phase growth of electronic grade silicon carbide (SiC). The information of solution properties of Fe–Si–C system is essential in development and improvement of these processes. Many investigators examined the solution properties of Fe–Si–C melt.1,2,3,4,5,6,7) Because of their specific processing interests, their results are limited in compositions and temperatures and not sufficient enough to describe the solution properties for the entire composition range of Fe–Si–C system.
The solution behaviors of Fe–Si–C system are characterized by decreasing carbon solubility as the silicon content increases, and the degree of its solubility is determined by the formation of SiC. Therefore, the accurate information of the standard Gibbs free energy of formation of SiC,
Δ
G
SiC
o
, is necessary to correctly describe the solution behaviors of Fe–Si–C system. However, the values reported by Chipman et al.,1) Turkdogan,8) Barin,9) Pankratz,10) Lacaze et al.11) and JANAF12) do not agree among themselves, and, more importantly, do not reproduce the experimentally determined two-fold saturations of C and SiC.1,2,5,6)
This study is to determine the correct value for the
Δ
G
SiC
o
and to develop a solution model in Unified Interaction Parameter formalism,13,14) which reproduces confidently the experimental results of Fe–Si–C melt.
2. Unified Interaction Parameter (UIP) Formalism
The present study adopts the Unified Interaction Parameter (UIP) formalism proposed by Bale and Pelton13,14) as it is thermodynamically consistent at all composition ranges and satisfies Gibbs-Duhem relationship. According to the convention by UIP formalism, one of the elements is chosen as solvent and the others as solutes. The activity coefficients of solvent and solutes are expressed in terms of compositions as follows,
|
ln
γ
solvent
=-
1
2
∑
j,k=1
N
ε
jk
x
j
x
k
-
2
3
∑
j,k,l=1
N
ε
jkl
x
j
x
k
x
l
-
3
4
∑
j,k,l,m=1
N
ε
jklm
x
j
x
k
x
l
x
m
+
| (1) |
|
ln
γ
i(solute)
=ln
γ
i
o
+ln
γ
solvent
+
∑
j=1
N
ε
ij
x
j
+
∑
j,k=1
N
ε
ijk
x
j
x
k
+
∑
j,k,l=1
N
ε
ijkl
x
j
x
k
x
l
+
| (2) |
where
εjk,
εjkl,
εjklm,
εij,
εijk,
εijkl are interaction parameters. In this study, Fe is taken as solvent, and Si and C as solutes. Their activity coefficients are presented in expanded forms as the
Eqs. (3),
(4), and
(5).
|
ln
γ
Fe
=
ε
CC
(-
1
/
2
x
C
2
)+
ε
CSi
(-
x
C
x
Si
)+
ε
SiSi
(-
1
/
2
x
Si
2
)
+
ε
CCC
(-
2
/
3
x
C
3
)+
ε
CCSi
(-2
x
C
2
x
Si
)+
ε
CSiSi
(-2
x
C
x
Si
2
)
+
ε
SiSiSi
(-
2
/
3
x
Si
3
)+
ε
CCCC
(-
3
/
4
x
C
4
)+
ε
CCCSi
(-3
x
C
3
x
Si
)
+
ε
CCSiSi
(-
9
/
2
x
C
2
x
Si
2
)+
ε
CSiSiSi
(-3
x
C
x
Si
3
)
+
ε
SiSiSiSi
(-
3
/
4
x
Si
4
)+
| (3) |
|
ln
γ
Si
=ln
γ
Si
o
+
ε
CC
(-
1
/
2
x
C
2
)+
ε
CSi
(
x
C
-
x
C
x
Si
)
+
ε
SiSi
(
x
Si
-
1
/
2
x
Si
2
)+
ε
CCC
(-
2
/
3
x
C
3
)+
ε
CCSi
(
x
C
2
-2
x
C
2
x
Si
)
+
ε
CSiSi
(2
x
C
x
Si
-2
x
C
x
Si
2
)+
ε
SiSiSi
(
x
Si
2
-
2
/
3
x
Si
3
)
+
ε
CCCC
(-
3
/
4
x
C
4
)+
ε
CCCSi
(
x
C
3
-3
x
C
3
x
Si
)
+
ε
CCSiSi
(3
x
C
2
x
Si
-
9
/
2
x
C
2
x
Si
2
)+
ε
CSiSiSi
(3
x
C
x
Si
2
-3
x
C
x
Si
3
)
+
ε
SiSiSiSi
(
x
Si
3
-
3
/
4
x
Si
4
)+
| (4) |
|
ln
γ
C
=ln
γ
C
o
+
ε
CC
(
x
C
-
1
/
2
x
C
2
)+
ε
CSi
(
x
Si
-
x
C
x
Si
)
+
ε
SiSi
(-
1
/
2
x
Si
2
)+
ε
CCC
(
x
C
2
-
2
/
3
x
C
3
)
+
ε
CCSi
(2
x
C
x
Si
-2
x
C
2
x
Si
)+
ε
CSiSi
(
x
Si
2
-2
x
C
x
Si
2
)
+
ε
SiSiSi
(-
2
/
3
x
Si
3
)+
ε
CCCC
(
x
C
3
-
3
/
4
x
C
4
)
+
ε
CCCSi
(3
x
C
2
x
Si
-3
x
C
3
x
Si
)+
ε
CCSiSi
(3
x
C
x
Si
2
-
9
/
2
x
C
2
x
Si
2
)
+
ε
CSiSiSi
(
x
Si
3
-3
x
C
x
Si
3
)+
ε
SiSiSiSi
(-
3
/
4
x
Si
4
)+
| (5) |
where the standard states for Fe, Si and C are taken as pure liquid Fe and Si and graphite, respectively. The temperature dependency of interaction parameters is expressed as
εijk=a+b/T.
The interaction parameters were determined by the multiple linear regression analysis using available experimental data. They were obtained first for the binary systems and, subsequently, for the higher order systems.
3. Interaction Parameters for the Fe–C Binary System
As shown in the Eq. (5), the value of the activity coefficient of C at infinite dilute solution,
ln
γ
C
o
, is necessary to be determined first. In the present study, it is taken as assessed by Sigworth et al.15) as shown by the Eq. (6).
|
ln
γ
C
o
=-2.004+2 718/T
| (6) |
The C solubility in Fe melt was studied by many investigators.3,16,17,18,19) As the recent assessment by Japan Society for the Promotion of Science (Steelmaking Data Sourcebook)19) represents their results well, this study adopts this assessment as given by the following Eq. (7).
|
log
x
C
=-12.728/T+0.727logT-3.049
| (7) |
This Eq. (7) is used to calculate the solubility of C at 50 K increment of temperature in the range of 1423 to 1973 K.
The activity coefficients at C saturation and at infinite dilution become the set of data for the present analysis. For the multiple regression analysis, the Eq. (5), which is the representation of the activity coefficient of C in UIP formalism, is rearranged by transposing
ln
γ
C
o
to the left-hand side of the equation in order to relate the experimentally determined terms in compositions and interaction parameters. The result is given by the Eq. (8).
|
ln
γ
C
-ln
γ
C
o
=
ε
CC
(
x
C
-
1
/
2
x
C
2
)+
ε
CCC
(
x
C
2
-
2
/
3
x
C
3
)+
| (8) |
Multiple regression analysis is operated on the rearranged Eq. (8) in order to determine the interaction parameters, which reproduce best the experimental data. The result shows that the C solubility of Fe–C system is described reasonably well by one interaction parameter, εCC, which is given by Eq. (9).
|
ε
CC
=9.052+4 064/T (1 423-1 973 K)
| (9) |
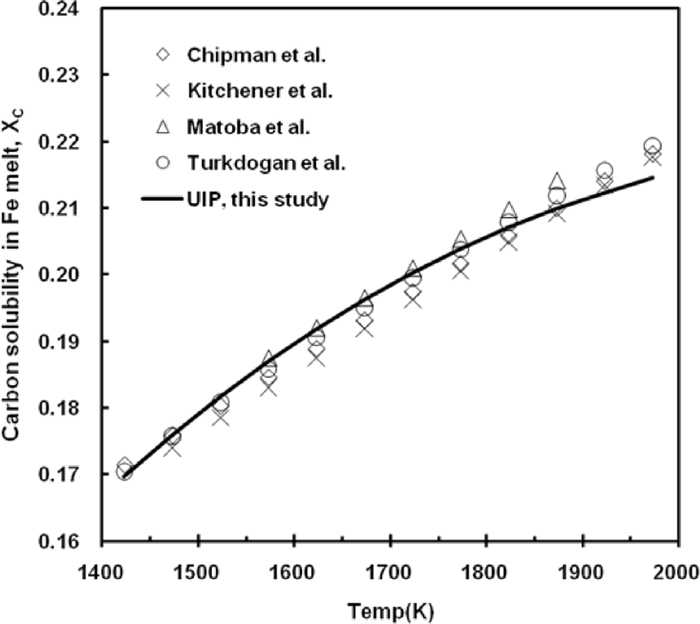
The calculated C solubility by the UIP model is compared with the work by Chipman et al.,3) Kitchener et al.,16) Matoba et al.17) and Turkdogan et al.18) in Fig. 1. The present assessment reproduces well the experimental data.
4. Interaction Parameters for the Fe–Si Binary System
The solution properties of Fe–Si binary system were assessed by Lacaze et al.,11) Chart,20) and Schmid.21) Agreement among them is excellent, but the assessment by Chart20) is shown to approach median values of activity coefficients of Si by the other two. Therefore, this study adopts the assessment of Chart20) to produce a set of activity coefficients of Fe and Si at various compositions and temperatures. Chart20) organized the solution properties of Fe–Si melt in terms of enthalpies and excess entropies, and this study calculates the activity coefficients from his assessed excess properties as shown by the following Eqs. (10) and (11).
|
G
¯
i
XS
=Δ
H
¯
i
-TΔ
S
¯
i
XS
=RTln
γ
i
| (10) |
|
ln
γ
i
=
G
¯
i
XS
/
RT
| (11) |
The activity coefficients of Fe and Si are calculated in the entire composition range at 0.05 moles increment and in temperature range from 1523 to 1973 K at 50 K increment. From this set of data, the activity coefficient of Si at infinite dilution,
ln
γ
Si
o
, is determined by its values at xSi=0. As the isomorphic nature of the set of data assures the consistency in the behavior of solution properties in Fe–Si system, this study adopts the values for
ln
γ
Si
o
developed from Chart.20) It is approximated by Eq. (12) and shown in Fig. 2.
|
ln
γ
Si
o
=2.107-15 803/T (1 523-1 973 K)
| (12) |
Such developed set of data for activity coefficients of Fe and Si is used to determine interaction parameters by performing multiple regression analysis on the Eqs. (3a) and (14).
|
ln
γ
Fe
=
ε
SiSi
(-
1
/
2
x
Si
2
)+
ε
SiSiSi
(-
2
/
3
x
Si
3
)+
ε
SiSiSiSi
(-
3
/
4
x
Si
4
)+
| (3a) |
|
ln
γ
Si
-ln
γ
Si
o
=
ε
SiSi
(
x
Si
-
1
/
2
x
Si
2
)+
ε
SiSiSi
(
x
Si
2
-
2
/
3
x
Si
3
)
+
ε
SiSiSiSi
(
x
Si
3
-
3
/
4
x
Si
4
)+
| (14) |
The results show that the solution properties of Fe–Si system are described best by three interaction parameters as given by the Eqs. (15), (16), and (17).
|
ε
SiSi
=9.254+3 380/T (1 523-1 973 K)
| (15) |
|
ε
SiSiSi
=-35.966+98 468/T (1 523-1 973 K)
| (16) |
|
ε
SiSiSiSi
=20.921-74 752/T (1 523-1 973 K)
| (17) |
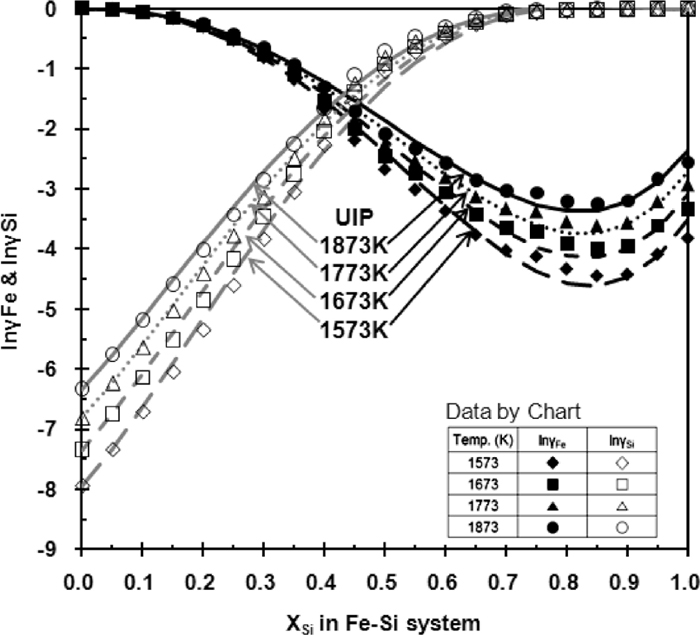
Figure 3 shows that the assessed UIP model reproduces well the work of Chart.20)
5. Experimental Data for the Fe–Si–C System
The available experimental data for this study are the solubility of C in Si–C and Fe–Si–C systems.
5.1. The C Solubility of Si–C Binary System
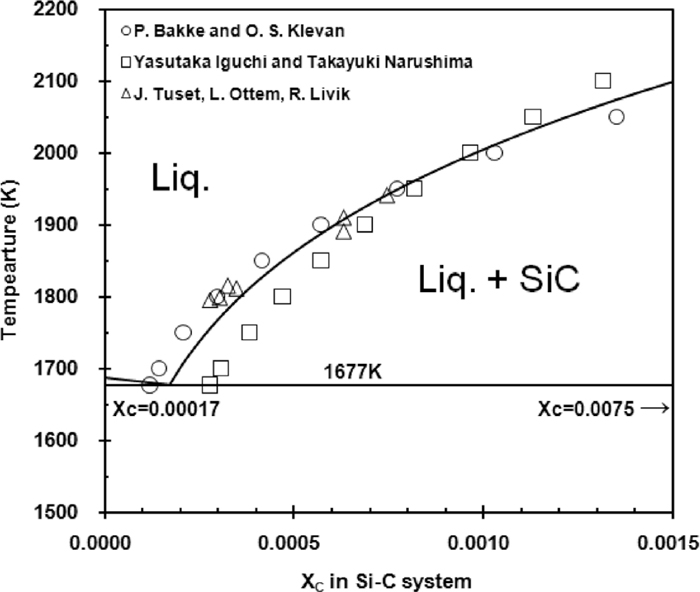
The phase diagram for Si–C system by Massalski22) shows that Si melt is in saturation with SiC. However, its C solubility is reported to be in the range of xc=0.009 to 0.02 for temperatures from 1667 to 1788 K, which is substantially higher than the recent investigation by Bakke et al.,23) Iguchi et al.24) and Tuset et al.25) (xc=0.00012 to 0.00027). These recent measurements are consistent with the operation parameters for the refining process of high purity Si metal, and this study adopts their results. Figure 4 compares their works. The best fitting curve for the solubility of C was developed from their data, and it is approximated by the Eq. (18).
|
ln
x
C
=2.134-18 126/T (K)
| (18) |
Figure 4 shows the liquidus in equilibrium with SiC developed by the Eq. (18). The eutectic composition is determined to be xc=0.00017 by extrapolation. This is far less than that by Massalski22) at xc=0.0075. This places the assessed solubility of C at C composition lower than that reported by Massalski.22)
As the Si melt along the C solubility curve is in equilibrium with SiC, the activities of Si and C were calculated with the use of Eq. (19) in the temperature range of 1677 to 2100 K.
|
Si(ℓ)+
C
_
=SiC(β)
,
Δ
G
SiC
o
=-RTln
a
SiC
a
Si
⋅
a
C
| (19) |
As the mol fraction of C is less than about xc=0.001 in this temperature range, the activity of Si is considered to be the same as the mol fraction of Si, aSi=xSi, and the activity of C is determined from the value of
Δ
G
SiC
o
with the use of Eq. (19). A set of data for activity coefficients of Si and C is calculated from the above assessed solubility of C and used in the multiple regression analysis for ternary interaction parameters of UIP model.
5.2. The C Solubility of Fe–Si–C Ternary System
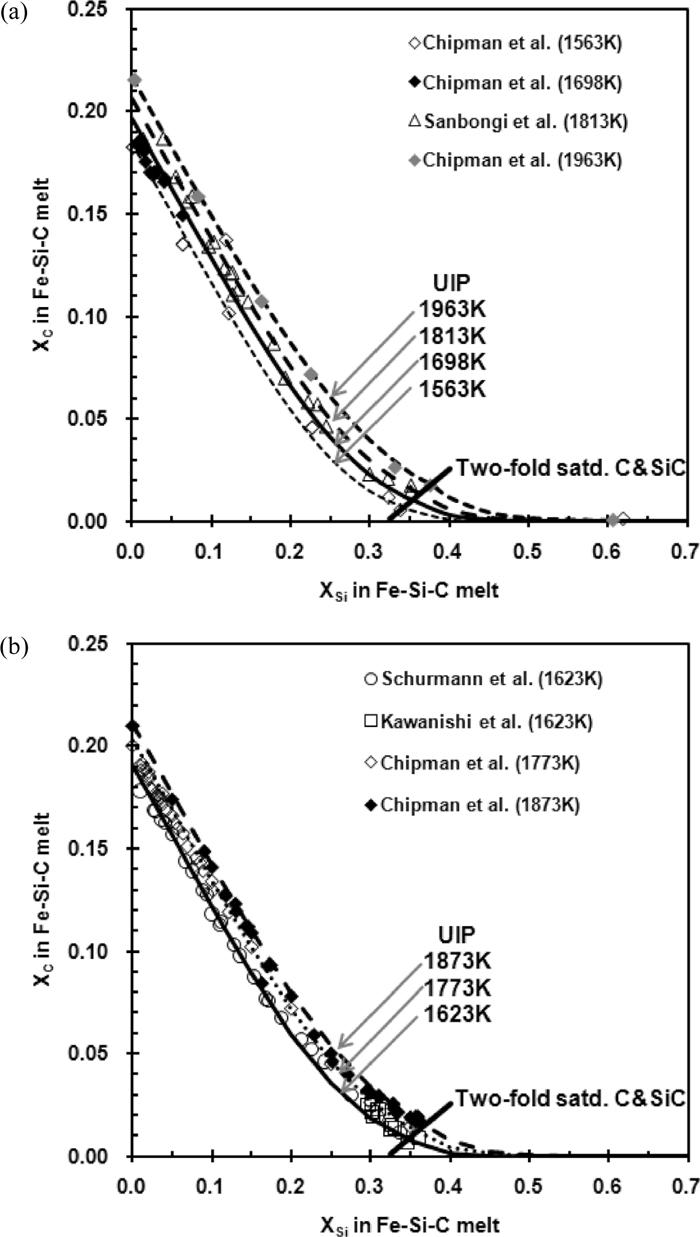
The solubility of C in the Fe–Si–C melt was determined experimentally by Chipman et al.,1,2,3) Schurmann et al.,4) Kawanishi et al.,6) and Sanbongi et al.7) Their results are presented in Fig. 5. The Fe–Si melt is in equilibrium with graphite when Si content is low. The solubility of C in Fe–Si melt decreases as the Si content increases. When the Si content is sufficiently high, the Fe–Si melt is in equilibrium with SiC. In-between, the Fe–Si melt exists together with graphite and SiC. These two-fold saturations are uni-variant compositions and vary with temperature. At the compositions of two-fold saturation, the activities of C and SiC are unity, i.e., aC=aSiC=1.
Activity coefficients of C are determined at various compositions and temperatures up to two-fold saturations from the experimentally determined C solubility. At two-fold saturations, the activity coefficients of Si are determined from the value of
Δ
G
SiC
o
. Such developed sets of data for activity coefficients of C and Si are served to determine ternary interaction parameters of the UIP model.
As mentioned above, the two-fold saturation is the manifestation of uni-variant reaction in Fe–Si–C system. Its behavior is characterized by
Δ
G
SiC
o
, and the correct value of
Δ
G
SiC
o
defines uniquely the temperature dependency of composition for two-fold saturation.
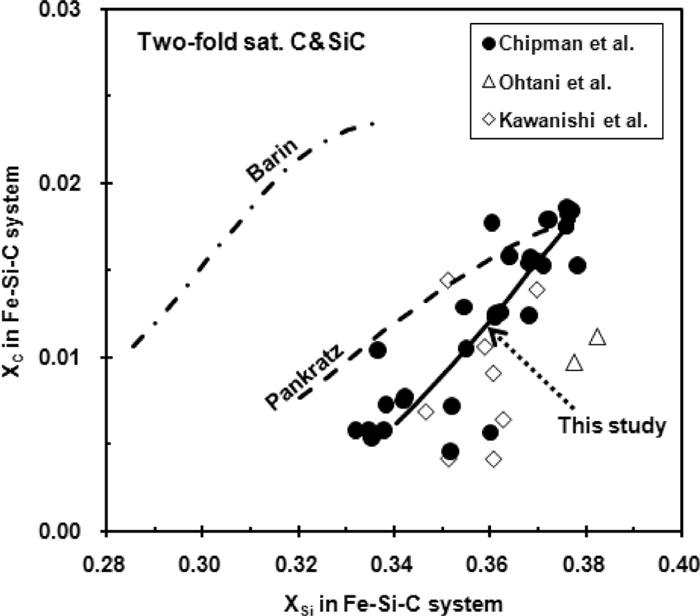
Chipman et al.1,2) investigated extensively the two-fold saturations in Fe–Si–C system, and Fig. 6 reproduces their experimental results. The composition of C for two-fold saturation is shown to increase with increasing composition of Si, and they increase with increasing temperature. This relationship is also supported by Ohtani et al.5) and Kawanishi et al.6) As they are the manifestation of uni-variant reaction in the Fe–Si–C system, the information of these two-fold saturations is used to validate the value of
Δ
G
SiC
o
in this study.
5.3. Appraisal of the Standard Gibbs Free Energy of Formation of SiC,
Δ
G
SiC
o
Many investigators1,8,9,10,11,12) studied the standard Gibbs free energy of formation of SiC,
Δ
G
SiC
o
. Figure 7 reproduces them as they reported. It shows that their values do not agree among themselves. The values of
Δ
G
SiC
o
quoted by Chipman et al.1,2) are most positive among them. Those by Pankratz10) are negative than those by Chipman et al. Those by Barin,9) JANAF,12) Lacaze et al.,11) and Turkdogan8) are practically identical but most negative. The discrepancy among them is as high as about 16 kJ/molSiC. Obviously, their validity needs to be examined. The validity of a given
Δ
G
SiC
o
is examined by developing a UIP model with the use of it. The developed model is used to reproduce the experimental data for two-fold saturations. If two sets of information are in agreement, the given
Δ
G
SiC
o
is taken to be correct. (The operation of UIP model is discussed in detail in the next section.)
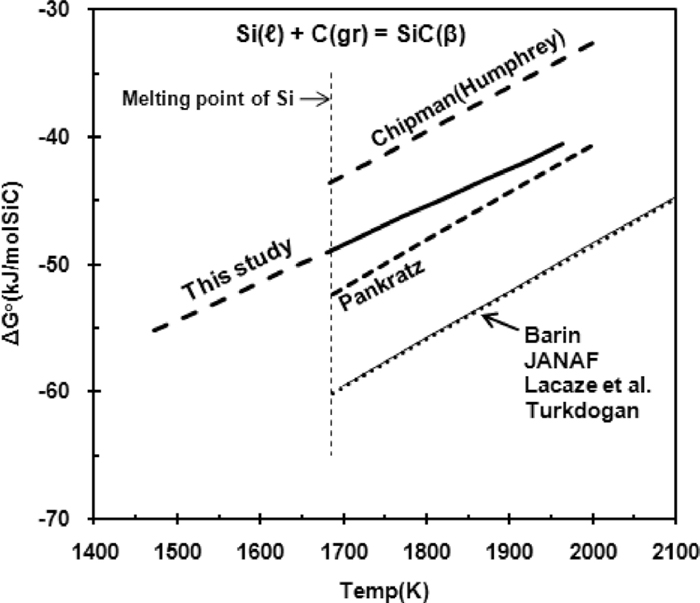
The values of
Δ
G
SiC
o
by Barin9) are more negative than those by Pankratz,10) and their effects are discussed on the reproduction of two-fold saturations of C and SiC in the followings.
The UIP model with
Δ
G
SiC
o
by Barin9) reproduces poorly the experimental data for two-fold saturations of C and SiC. As shown in Fig. 6, the two-fold saturations calculated by the UIP model deviate significantly from the experimental data for two-fold saturations of C and SiC toward lower content of Si. A similar exercise with
Δ
G
SiC
o
by Pankratz10) shows that the two-fold saturations by the UIP model approach closer to the experimental data for two-fold saturations of C and SiC, but the reproduction by the UIP model is not satisfactory yet. Figure 6 illustrates this effect well. It appears that
Δ
G
SiC
o
by Pankratz10) are closer to the correct
Δ
G
SiC
o
. The poor reproduction with
Δ
G
SiC
o
of Barin9) is due to the fact that the excessively negative values of
Δ
G
SiC
o
lower the activity coefficient of Si at the experimental composition of Si for two-fold saturations and that the UIP model can produce such low activity coefficient of Si only at lower composition of Si than the experimental one.
The assessment for the correct value of
Δ
G
SiC
o
was made by trial and error until a conformity is reached in the compositions of two-fold saturations between UIP model and experimental data. The resulted
Δ
G
SiC
o
is proposed by the Eq. (20).
|
Si(ℓ)+C(gr)=SiC(β)
Δ
G
SiC
o
=-99 098+29.798T(
J/mol
)
,
1 473-1 963 K (
error±2 100J
)
| (20) |
The ranges of error and effective temperature are based on experimental temperatures by Chipman et al.1,2) The proposed
Δ
G
SiC
o
compares with the previously reported values in Fig. 7. It is a little positive than that by Pankratz.10)
The compositions of two-fold saturations were reproduced by the UIP model with the proposed
Δ
G
SiC
o
. Figure 6 shows that they reproduce very well the experimental compositions of two-fold saturations. The observed good agreement lends a credence to the proposed value of
Δ
G
SiC
o
.
6. Interaction Parameters for the Fe–Si–C System
The developed set of data for activity coefficients of Si and C in Fe–Si–C system are used to determine ternary interaction parameters. After a necessary rearrangement, a multiple regression analysis was performed on the Eqs. (21) and (22).
|
ln
γ
Si
-ln
γ
Si
o
-
ε
CC
(-
1
/
2
x
C
2
)-
ε
SiSi
(
x
Si
-
1
/
2
x
Si
2
)
+
ε
SiSiSi
(
x
Si
2
-
2
/
3
x
Si
3
)+
ε
SiSiSiSi
(
x
Si
3
-
3
/
4
x
Si
4
)
=
ε
CSi
(
x
C
-
x
C
x
Si
)+
ε
CCSi
(
x
C
2
-2
x
C
2
x
Si
)
+
ε
CSiSi
(2
x
C
x
Si
-2
x
C
x
Si
2
)
+
ε
CSiSiSi
(3
x
C
x
Si
2
-3
x
C
x
Si
3
)+
| (21) |
|
ln
γ
C
-ln
γ
C
o
-
ε
CC
(
x
C
-
1
/
2
x
C
2
)-
ε
SiSi
(-
1
/
2
x
Si
2
)
+
ε
SiSiSi
(-
2
/
3
x
Si
3
)+
ε
SiSiSiSi
(-
3
/
4
x
Si
4
)
=
ε
CSi
(
x
Si
-
x
C
x
Si
)+
ε
CCSi
(2
x
C
x
Si
-2
x
C
2
x
Si
)
+
ε
CSiSi
(-2
x
C
x
Si
2
)+
ε
CSiSiSi
(
x
Si
3
-3
x
C
x
Si
3
)+
| (22) |
It was found that four ternary interaction parameters are sufficient to reproduce the experimentally observed solution behaviors. They are given by the Eqs. (23), (24), (25), and (26) and Table 1 as well.
|
ε
CSi
=5.101-9 647/T (1 523-1 973 K)
| (23) |
|
ε
CCSi
=-7.482+67 622/T (1 523-1 973 K)
| (24) |
|
ε
CSiSi
=-39.72+185 440/T (1 523-1 973 K)
| (25) |
|
ε
CSiSiSi
=34.05-160 482/T (1 523-1 973 K)
| (26) |
Table 1. Interaction parameters of UIP model for the Fe–Si–C system.
| Systems | Interaction parameters | Temperatures, K |
|---|
| * Fe (solvent) | | |
| Fe–C |
ln
γ
C
o
= –2.004+2718/T | 1423–1973 |
| εCC = 9.052+4064/T |
| Fe–Si |
ln
γ
Si
o
= 2.107–15803/T | 1523–1973 |
| εSiSi = 9.254+3380/T |
| εSiSiSi = –35.966+98468/T |
| εSiSiSiSi = 20.921–74752/T |
| Fe–Si–C | εCSi = 5.101–9647/T | 1523–1973 |
| εCCSi = –7.482+67622/T |
| εCSiSi = –39.72+185440/T |
| εCSiSiSi = 34.05–160482/T |
The solubility of C in Fe–Si–C melt was reproduced by the present UIP model and compared with experimental data in Fig. 5. The model is shown to reproduce well the experimental data. Two-fold saturations of C and SiC by the present UIP model are compared with the experimental data in Fig. 6. A good agreement between them is observed.
7. Conclusion
The thermodynamic property of SiC plays an important role in defining solution behaviors of Fe–Si–C system, but reported values for
Δ
G
SiC
o
are found to be incorrect. The correct value of
Δ
G
SiC
o
was determined by reproducing experimental two-fold saturations with the use of UIP model as follows:
|
Si(ℓ)+C(gr)=SiC(β)
Δ
G
SiC
o
=-99 098+29.798T(
J/mol
)
,
1 473-1 963 K (
error±2 100J
)
|
With the proposed
Δ
G
SiC
o
on hand, a UIP model was assessed for the Fe–Si–C system. The UIP model was found to describe well the solution behaviors of Fe–Si–C melt in a wide range of compositions and temperatures. It ensures a wide application in the processes of ironmaking, steelmaking, cast-iron, Si-based ferroalloys, and the low temperature liquid phase growth of electronic grade silicon carbide.
References
- 1) J. Chipman, J. C. Fulton, N. Gokcen and G. R. Caskey: Acta Metall., 2 (1954), 439.
- 2) J. C. Fulton and J. Chipman: J. Met., 6 (1954), 356.
- 3) J. Chipman, R. M. Alfred, L. W. Gott, R. B. Small, D. M. Wilson, N. Thomson, D. L. Guernsey and J. C. Fulton: Trans. Am. Soc. Met., 44 (1952), 1215.
- 4) E. Schurmann and D. Kramer: Giessereiforschung, 21 (1969), 29.
- 5) M. Ohtani: Sci. Rep. RITU, A7 (1955), 487.
- 6) S. Kawanishi, T. Yoshikawa and T. Tanaka: Mater. Trans., 50 (2009), 806.
- 7) K. Sanbongi, M. Ohtani and K. Toita: Sci. Rep. RITU, A9 (1957), 147.
- 8) E. T. Turkdogan: Physical Chemistry of High Temperature Technology, Academic Press, New York, (1980), 20.
- 9) I. Barin: Thermochemical Data of Pure Substance, 3rd ed., VCH, Germany, (1995).
- 10) L. B. Pankratz: Thermodynamic Properties of Carbides, Nitrides, and Other Selected Substances, US Bureau of Mines Bulletin 696, US Dept. of the Interior, Washington DC, (1994).
- 11) J. Lacaze and B. Sundman: Metall. Trans., A22 (1991), 2211.
- 12) M. W. Chase, Jr.: NIST-JANAF Thermochemical Tables, 4th ed., Am. Chem. Soc. & Am. Inst. Phys., Woodbury, New york, (1998).
- 13) A. D. Pelton and C. W. Bale: Metall. Mater. Trans., A17 (1886), 1211.
- 14) C. W. Bale and A. D. Pelton: Metall. Mater. Trans., A21 (1990), 1997.
- 15) G. K. Sigworth and J. F. Elliott: Met. Sci., 8 (1974), 298.
- 16) J. A. Kitchener, J. O. Bockris and D. A. Sparat: Trans. Faraday Soc., 48 (1952), 608.
- 17) S. Matoba and S. Banya: Technol. Rep. Tohoku Univ., 20 (1955), 131.
- 18) E. T. Turkdogan and L. E. Leake: J. Iron Steel Inst., 180 (1955), 269.
- 19) Steelmaking Data Sourcebook, ed. by Japan Society for the Promotion of Science, the 19th Committee on Steelmaking, Gordon and Breach Science Publishers S. A., Montreux, Switzerland, (1988), 275.
- 20) T. G. Chart: High Temperature - High Pressures, 2 (1970), 461.
- 21) R. Schmid: Calphad, 4 (1980), 101.
- 22) T. B. Massalski, J. L. Murray, L. H. Bennett and H. Baker: Binary Alloy Phase Diagrams, Vol. 1, American Society for Metals, Materials Park, OH, (1986), 589.
- 23) P. Bakke and O. S. Klevan: Process Technology Conf. Proc., Vol. 14, ISS, Warrendale, PA, (1995), 155.
- 24) Y. Iguchi and T. Narushima: Proc. of 1st Int. Conf. on Processing Materials for Properties, TMS, Warrendale, PA, (1993), 437.
- 25) J. Tuset, L. Ottem, R. Livik: Silicon for Chemical Industry, Proc., ed. by H. A. Oye, H. Rong, Institute of Inorganic Chemistry, NTH, Geiranger, Norway, (1992).