Regular Article
Creep Deformation of Type 2205 Duplex Stainless Steel and its Constituent Phases
2014 Volume 54 Issue 4 Pages 945-954
Details
2014 Volume 54 Issue 4 Pages 945-954
The creep deformation of type 2205 duplex stainless steel in industrial continuous annealing conditions was analyzed and compared with the creep behavior of its constituent phases, ferrite and austenite. The bulk ferrite phase deformed by viscous glide. The deformation of the bulk austenite phase was by lattice diffusional creep at low applied stress and by dislocation climb at higher applied stress. Grain boundary sliding was the rate controlling mechanism of creep deformation of duplex stainless steel. The value of the stress exponent and the grain size exponent of the creep rate equation both strongly support the possibility that cold rolled type 2205 duplex stainless steel deforms superplastically during recrystallization annealing in industrial continuous annealing furnaces.
The mechanical properties and the resistance to corrosion of duplex stainless steel (DSS), with a microstructure consisting of approximately 50% ferrite and 50% austenite, are superior to the properties of conventional ferritic and austenitic stainless steels. This makes DSS ideal for applications in severe environments such as the chemical industry, the off-shore industry, and the pulp and paper industry.1)
The fine grained, dual-phase microstructure effectively suppresses grain growth and enables DSS to display a superplastic behavior at high temperature.2,3,4,5,6,7) The reports about superplasticity of DSS suggest that superplastic creep could also be a common occurrence during the recrystallization annealing of cold rolled DSS in industrial continuous annealing furnaces. The stress applied to pull the strip through the continuous annealing line could cause superplastic deformation and result in an unwanted strip elongation.
In this study, type 2205 DSS was creep deformed at a temperature in the range of 1273 K (1000°C) to 1373 K (1100°C), which is the standard industrial recrystalization annealing temperature range. The constituent phases of DSS, ferrite and austenite, were prepared as bulk alloys and creep deformed in the same conditions. Different creep models were then used to analyze the creep deformation data obtained experimentally for DSS and its constituent phases in order to identify the influence of the creep properties of the constituent phases and grain boundary sliding on the creep mechanism of DSS.
Figure 1 shows deformation maps for pure iron and austenitic stainless steel 3168) with the range of experimental conditions used in the present study indicated by the dark grey area. The experimental stress range was between 5 MPa and 50 MPa. As the stress range used in the present study was very low, large scale deformation plasticity could be neglected in the analysis of the creep deformation mechanisms. The temperature range was between 1273 K (1000°C) and 1373 K (1100°C). In Fig. 1(a), the austenite stability range is indicated by the light grey area. The dotted line in Fig. 1(a) is the extrapolation from α-ferrite to δ-ferrite of the boundary between diffusional creep and power-law creep. In the case of ferrite, the prevailing creep mechanism was expected to be power law creep. In the case of austenite, the creep mechanism was expected to be power law creep at high stress and diffusion-controlled creep at low stress.

Schematic deformation map for (a) pure iron and (b) austenitic stainless steel AISI 316.8) The experimental conditions used in the present work are indicated by the dark grey area. The light grey area in (a) indicates the austenite phase stability range for pure Fe. The dotted line in (a) is the extrapolation from α-ferrite to δ-ferrite of the transition from diffusional creep to power-law creep.
Three well-known creep mechanisms, diffusional creep, power-law creep and grain boundary sliding were tested in the present study by means of the Mukherjee-Bird-Dorn equation for the strain rate observed during steady state creep:
| (1) |
| Mechanism | D | n | p |
|---|---|---|---|
| Lattice diffusion creep | DL* | 1 | 2 |
| Grain boundary diffusion creep | DGB | 1 | 3 |
| Grain Boundary Sliding (Superplasticity) | DL/ DGB | 2 | 1 / 2 |
| Viscous glide | DL | 3 | 0 |
| Dislocation climb | DL | 5 | 0 |

Schematic showing the vacancy flow and atomic flow (a) by lattice diffusion through the grain matrix and (b) by grain boundary diffusion along the grain boundary during diffusional creep. (c) Schematic of the strain mechanism for diffusional creep deformation by lattice diffusion (solid line) and by grain boundary diffusion (dashed line).

Schematic showing the mechanism of power law creep, where the creep strain rate is controlled by dislocation climb. Dislocation glide is responsible for the strain.

Schematic for viscous glide creep where the dislocation glide velocity glide is controlled by solute/dislocation interactions.

Schematic for creep by grain boundary sliding. (a) Stress concentrations at triple junctions and grain boundary ledges are developed due to grain boundary sliding. The grain boundary stress concentration can be reduced by (b) diffusional flow and (c) dislocation glide through the grain.
At high temperature, the number of vacancies increases and the thermal energy allows diffusion to occur more readily than at lower temperatures. A tensile stress normal to a boundary will promote vacancy formation because the work necessary to form a vacancy is reduced by the amount σΩ, where σ is the applied stress and Ω is the volume of vacancy. The opposite occurs at boundaries on which a compressive normal stress is acting. This provides a difference in the concentration of vacancies causing a vacancy flow as shown schematically in Figs. 2(a) and 2(b). Simultaneously, there is diffusional flow of atoms in the opposite direction to the flow of vacancies. This flow of atoms and vacancies leads to a creep elongation of the grains in the direction parallel to the tensile stress and a contraction in the direction perpendicular to the tensile stress. The diffusional paths for the vacancies and atoms during the diffusional creep can be divided into two types: lattice diffusion and grain boundary diffusion as shown schematically in Fig. 2(c). Typically, at high temperatures, lattice diffusion is the controlling diffusion process and at lower temperatures, grain boundary diffusion is more important. The following combined rate equation for lattice diffusion and grain boundary diffusion was used to analyze the experimentally observed creep deformation:8)
| (2) |
| (3) |
| (4) |
| Parameter | Value | ||
|---|---|---|---|
| Ferrite | Austenite | Duplex | |
| Lattice diffusion coefficient D0L, m2/s | 1.9×10⁻⁴ 8) | 1.8×10⁻⁵ 8) | 3.5×10⁻⁵ * |
| Grain boundary diffusion coefficient δD0GB, m3/s | 1.1×10⁻¹² 8) | 7.5×10⁻¹⁴ 8) | 1.7×10⁻¹³ * |
| Activation energy for lattice diffusion QL, kJ/mol | 2398) | 2708) | 270* |
| Activation energy for grain boundary diffusion QGB, kJ/mol | 1748) | 1598) | 163* |
| Grain size D, μm | 27.400** | 1.050** | 0.836** |
| Atomic volume Ω, m3 | 1.18×10⁻²⁹ 8) | 1.21×10⁻²⁹ 8) | 1.20×10⁻²⁹**** |
| Burger’s vector b, m | 2.48×10⁻¹⁰ 8) | 2.58×10⁻¹⁰ 8) | 2.53×10⁻¹⁰**** |
| Shear modulus** G, GPa |
|
|
|
| Elastic modulus** E, GPa | 250.480 – 0.103T | 197.398 – 0.063T | +209.7115 – 0.072T |
| Poisson ratio ν | 0.4625** | 0.310** | 0.40425 |
| Melting temperature*** TM, K | 1769 | 1723 | 1733 |
At high temperature, dislocations can climb out of their glide plane by absorption or emission of vacancies. Power law creep typically involves dislocation climb activated by diffusion. When a gliding dislocation is blocked by a discrete obstacle, it can climb to circumvent it, enabling it to continue to glide as shown in Fig. 3. Vacancies diffusion into or out of the dislocation core, determines whether the dislocation climb upward or downward. In this situation, dislocation glide is responsible for most of the strain, but the average dislocation velocity is determined by the climb process. As a consequence, the strain rate is essentially controlled by the dislocation climb process, and the steady state creep rate is determined by lattice diffusion. The steady state creep rate can be approximated by the following equation:9)
| (5) |
During grain boundary sliding adjacent grains slide along their common grain boundary. Grain boundary sliding occurs more readily during a high temperature deformation than during deformations at lower temperatures. Grain boundary sliding is known to be the dominant mechanism responsible for superplastic deformation. Dislocation pile ups at grain boundary ledges or triple junctions lead to stress concentrations during grain boundary sliding as shown in Fig. 5(a). Grain boundary sliding must therefore be accommodated by diffusional flow or dislocation movement to release this stress concentration. The schematic in Fig. 5 shows a stress concentration initiated by grain boundary sliding being relieved by diffusional flow or the movement of dislocation. Due to the compressive or tensile stress acting on the boundary during grain boundary sliding a difference in vacancy concentration is established in the same manner as explained for diffusional creep. Vacancy flow at the boundary allows for relief of the stress concentration as shown Fig. 5(b). The stress concentration can also be relieved by the generation and movement of dislocations within the grains as shown in Fig. 5(c). Many models have been proposed for grain boundary sliding accommodated by dislocation movement. In these models the steady state creep rate equation has a stress exponent n equal to 2:10,11,12,13)
| (6) |
The material used in the present study was type 2205 DSS. The composition of the DSS is listed in Table 1. Industrially cast, hot rolled and annealed strip was laboratory cold rolled from 6 mm to 1 mm. The composition of the constituent phases was determined by equilibrium calculation using ThermoCalc at 1323 K (1050°C). The phase composition was also measured by means of Energy Dispersive Spectrometry (EDS) analysis of the ferrite and the austenite phases in DSS. Bulk samples of the separate ferrite and austenite phases were prepared by laboratory casting and rolling for the purpose of comparing the properties of the phases separately and combined in the two-phase DSS.
| Composition | C | Si | Mn | Cr | Ni | Mo | N |
|---|---|---|---|---|---|---|---|
| DSS 2205 | 0.020 | 0.590 | 1.45 | 21.80 | 5.95 | 3.10 | 0.190 |
| Ferrite | 0.007 | 0.681 | 1.14 | 24.58 | 3.97 | 4.09 | 0.028 |
| Austenite | 0.026 | 0.549 | 1.50 | 20.15 | 6.97 | 2.60 | 0.231 |
Tensile specimens, 2.45 mm wide and 14.7 mm long, were used for the creep deformations which were carried out in a Gleeble 3500 thermo-mechanical simulator. The tests were conducted for stresses ranging from 5 MPa to 50 MPa, in the 1273 K–1373 K (1000°C–1100°C) temperature range. Strain rate jump tests were also carried out with strain rate jumps from 10–4s–1 to 10–3s–1 at a strain of 0.03, from 10–3s–1 to 10–2s–1 at a strain of 0.05, and from 10–2s–1 to 10–1s–1 at a strain of 0.1. The results were then used to determine the strain rate sensitivity.
The elastic modulus, E and shear modulus, G, of specimens used in the calculations were obtained by resonant frequency measurements from room temperature to 873 K (600°C). The high temperature values of E and G were obtained by extrapolating to temperatures higher than 873 K (600°C). The Poisson ratio was measured at room temperature. The Poisson ratio was assumed to be temperature independent.
The DSS specimens were also heated to 1273 K (1000°C) in an automated continuous annealing simulator for 1 minute and a stress of 10 MPa was applied. The specimen was then water quenched to observe the microstructure during continuous annealing. Thin foils for Transmission Electron Microscopy (TEM) were mechanical polished to 100 μm, twin jet-polished in a solution of 5% perchloric acid in 95% acetic acid using a voltage of 45 V and a current density of 8.5 mA/mm2. TEM was used to investigate the dislocation microstructure in continuous annealing conditions by using a JEOL JEM-2100 operated at 200 keV.
Figure 6 compares the calculated and experimental strain rate data for ferrite. The data was fitted to a power law using the strain rate Eq. (5) with a stress exponent, n, equal to 3. The rate controlling mechanism for creep deformation of the ferrite phase is clearly viscous glide creep i.e. the dislocation/solute interactions control the creep process. The calculated value of the constant A obtained by fitting Eq. (5) to the experimental data was 0.73. As this value is close to 1, this is also a strong support for a creep mechanism controlled by viscous glide.

Comparison between model calculation (full lines) and experimental data for the creep rate in the bulk ferrite alloy, assuming power law creep with a stress exponent n equal to 3.
The creep mechanism is different from the mechanism reported type AISI 441 ferritic stainless steel creep deformed at 1123 K (850°C). In this case a stress exponent of 5 was reported.14) The difference may be due to the Ti and Nb additions to the ferritic stainless steel AISI 441, which leads to the formation of carbides and nitrides. In the present study, the absence of carbides or nitrides allows for a higher content of solutes which impede the dislocation glide, and their reduced velocity results in the observed viscous glide creep.
4.2. AusteniteFigure 7 compares the calculated and experimental data for the austenite phase. Both lattice diffusional creep and power law creep, i.e. the creep Eqs. (2) and (5), respectively, were considered by means of the following combined creep equation:
| (7) |

Comparison between model calculations (full lines) and experimental data points for the creep rate of the bulk austenite alloy, assuming that there is a stress-dependent transition from diffusional creep, with n equal to 1, at low stress, to a power law creep, with n equal to 5, at higher stress.
Figure 8 shows the comparison of the calculated and experimental creep data for DSS. Both lattice diffusional creep and grain boundary sliding, i.e. Eqs. (2) and (6), respectively, were combined in the following model equation:
| (8) |

Comparison between the model calculations (full lines) and the experimental data points for the creep rate of DSS, assuming that creep is by grain boundary sliding (n=2).
The creep deformation mechanism of DSS is grain boundary sliding, whereas this deformation mechanism does not contribute to the creep deformation of the constituent ferrite and austenite phases when these are creep-tested as separate bulk alloys. The difference between DSS and its constituent phases is the presence of the ferrite-austenite phase boundaries in DSS which are absent in the single phase alloys. The ferrite-austenite phase boundaries rather than the ferrite-ferrite or austenite-austenite grain boundaries were clearly responsible for the boundary sliding process in DSS. This phenomenon was not studied in detail in the present study and it is speculated that the preferred phase boundary sliding effect may be due to strain partitioning between the two phases. The strain partitioning is due to the differences in the mechanical properties of ferrite and austenite, and the resulting strain gradients at the phase boundaries are believed to enhance phase boundary diffusion and phase boundary sliding.
It is clear that the phase fraction of ferrite and austenite will have an influence on the creep by phase boundary sliding, as it determines the surface area of the phase boundaries on which the process of boundary sliding can take place. The phase fraction of ferrite and austenite in DSS during the creep deformation remained unchanged at 0.50, ensuring that phase boundary sliding remained the main creep mechanism by providing the highest possible phase boundary surface area.
4.4. Grain Size EffectFigure 9 shows effect of the grain size on the steady creep rate of the DSS. DSS was pre-heated at 1050°C for different times to obtain different grain sizes, and subsequently creep deformed at 1050°C using an applied stress of 10 MPa. The following equation was used to describe the relationship between the strain rate and the grain size:
| (9) |

Graphs showing the relationship between the steady state creep rate of DSS 2205 at 1050°C and (a) the ferrite and (b) the austenite grain size. The applied stress was 10 MPa.
Having said this it is important to stress that the use of Eq. (9) to analyze the grain size dependence of the strain rate in DSS implies that the two phase nature of the microstructure can be ignored. This assumption was not verified. The grain size dependence should in principle be tested by changing the grain size of one constituent without changing the grain size of the other constituent. The independent control of the grain size of the two phases in DSS is however challenging from an experimental point of view and there are currently no studies reporting on how this could be achieved.
4.5. Strain Rate Sensitivity, mThe strain rate sensitivity, m was determined by strain rate jump tests and the following equation:
| (10) |

Temperature dependence of the strain rate sensitivity determined by strain rate jump tests (a) from 10–3s–1 to 10–2s–1, and (b) from 10–2s–1 to 10–1s–1. The arrow indicates the data point tested in conditions corresponding to continuous recrystallization annealing.
The bulk ferrite and austenite phases were found to have a much lower strain rate sensitivity, m~0.25, for strain rate jump tests from a strain rate of 10–3s–1 to a strain rate of 10–2s–1. The strain rate sensitivity decreased to about 0.1 for strain rate jumps from a strain rate of 10–2s–1 to a strain rate of 10–1s–1.
4.6. Transmission Electron Microscopy (TEM)Figure 11(a) shows a TEM micrograph of DSS annealed at 1273 K (1000°C) for 1 minute with applied stress of 10 MPa, and water quenched to room temperature at the rate of 950 K/s. The annealing time, temperature and applied stress corresponds to conditions experienced typically by DSS strip material in an industrial continuous recrystallization annealing line. Ferrite is labeled α and austenite is labeled γ in the micrograph. A high dislocation density was observed in the ferrite grains. As ferrite is the softer phase at the annealing temperature, the ferrite grains will strain more than the austenite grains. In addition, the ferrite grains are subjected to viscous glide whereas austenite undergoes diffusional creep. Hence, more dislocations are generated in ferrite grains during the recrystallization annealing.

(a) TEM micrographs of DSS 2205 annealed at 1273 K (1000°C) for 1 minute with an applied stress of 10 MPa, then water-quenched. (b) Low dislocation density austenite grain. (c) High dislocation density ferrite grain.
Figure 11(b) shows an austenite grain in the recrystallization annealed DSS. A higher dislocation density is observed at the grain boundary and the interior of the grain is almost free of dislocations. The observation of a high dislocation density close to the austenite grain boundaries is consistent with the grain boundary stress relaxation associated with grain boundary sliding. As the austenite grain interior deforms by lattice diffusional creep, i.e. a process that does not involve dislocation generation, a low dislocation density should normally be observed in the austenite grain interiors.
The ferrite grain in the deformed DSS shown in Fig. 11(c) has a high dislocation density both along the grain boundaries and in the grain interior. The dislocations along the grain boundaries are due to stress concentration relaxation occurring during grain boundary sliding. A high dislocation density is also expected in the grain interior as the analysis of the creep deformation of the bulk ferrite phase has shown that it deforms by viscous glide.
In the temperature range of 1273 K–1373 K (1000°C–1100°C) and for an applied stress in the range of 5 MPa–50 MPa, the bulk ferrite phase experiences a power law creep (n=3) and the bulk austenite phase experiences lattice diffusional creep (n=1) and power law creep (n=5). The boundary between lattice diffusional creep and power law creep was calculated by combining the Eqs. (2) and (5):
| (11) |

Deformation map of (a) the bulk ferrite alloy, (b) the bulk austenite alloy and (c) DSS. The experimental conditions of the present work are indicated by the squares. The solid line represents the transition from lattice diffusional creep, with n=1, to power law creep, with n=3–5, or grain boundary sliding, with n=2. The dotted lines indicate the transition from diffusional creep to power law creep for (a) ferrite in pure Fe and (b) the austenitic stainless steel AISI 316.8)
In the case of DSS, Eqs. (2) and (6) were used to determine the value of the stress for the transition from lattice diffusional creep to grain boundary sliding:
| (12) |
Table 4 lists the value of the parameters in the Mukherjee-Bird-Dorn equation and the creep mechanisms identified for DSS and its constituent phases in the course of the present study. In the continuous recrystallization annealing conditions for cold rolled DSS (1323 K, 10 MPa), the creep mechanism is mainly grain boundary sliding with viscous glide in ferrite grains and dislocation climb in austenite grains.
| D | n | p | A | Mechanism | Stress range at 1323 K | |
|---|---|---|---|---|---|---|
| Ferrite | DL | 1 | 2 | 32.49 | Lattice diffusion creep | <2.37 MPa |
| DL | 3 | 0 | 0.73 | Viscous glide | >2.37 MPa | |
| Austenite | DL | 1 | 2 | 29.59 | Lattice diffusion creep | <26.4 MPa |
| DL | 5 | 0 | 5×10⁵ | Dislocation climb | >26.4 MPa | |
| DSS | DL | 1 | 2 | 31.12 | Lattice diffusion creep | <2.86 MPa |
| DL | 2 | 1 | 1.17×10¹⁰T/E | Grain Boundary Sliding (Superplasticity) | >2.86 MPa |
Figure 13 shows a schematic for phase boundary sliding in a two phase microstructure corresponding to the creep deformation of DSS. As the stress is applied, grain boundary sliding occurs at the phase boundary between the ferrite and austenite grains as shown in Fig. 13(a). Regions with a local excess of atoms and regions with a local excess of vacancies are generated by the process of grain boundary sliding as shown in Fig. 13(b). In the case of ferrite, which deforms by viscous glide with n=3, the excess vacancies formed at the boundaries can be represented by the vacancy dislocation loops shown in Fig. 13(b). Dislocations formed during the deformation of the ferrite grains by dislocation glide are annihilated as they interact with dislocations formed at the boundaries by the excess vacancies. The ferrite grains can therefore slide without a change in the shape of the grains. The stress concentration at the boundaries is also released. In the case of the austenite, which deforms by lattice diffusional creep with n=1, regions with excess vacancies and regions with excess atoms are formed at the boundaries. The concentration gradients for vacancies and atoms result in an atomic flux along these gradients, which releases the stress concentration, and allow the austenite grains to slide along the boundary.

Schematic of the phase boundary sliding mechanism in DSS. The ferrite relieves stress concentrations by dislocation glide, and the austenite relieves stress concentrations by lattice diffusion.
The grain boundary sliding phenomenon is also supported by the value of the grain size exponent for the effect of grain size on the creep rate of DSS. The grain size exponent, p of ferrite at 1050°C is 1.11 for an applied stress of 10 MPa. Ferrite in DSS undergoes dislocation glide by power law creep (p=0) and boundary sliding (p=1). Power law creep is not affected by the grain size whereas boundary sliding is. The grain size exponent of ferrite is therefore close to 1. The grain size exponent of austenite at 1050°C is 1.56 for an applied stress of 10 MPa. Austenite in DSS undergoes lattice diffusional creep and boundary sliding. The grain size exponent for lattice diffusional creep is 2 and for phase boundary sliding it is 1. Austenite should therefore have a grain size exponent between 1 and 2.
The TEM analysis of the DSS microstructure also reveals clear evidence for superplastic behavior. A high dislocation density was observed in the ferrite, whereas a much lower dislocation density was observed in the austenite. Since ferrite undergoes viscous glide, i.e. with dislocation glide-mediated deformation, a high dislocation density was observed in the ferrite grains. In the case of austenite, lattice diffusional creep is responsible for the creep deformation and no dislocations are involved in the deformation. Dislocations were therefore concentrated at the grain boundaries rather than in the austenite grain interior.
The deformation map of DSS in conditions where the strain rate sensitivity, m, is larger than 0.5 is indicated in Fig. 14 as a light grey area. Literature data5,6) was used in Fig. 14. Lee et al.5) reported a stress exponent value of 1.41 in conditions indicated by the dark grey area. This value is between 1 and 2, suggesting that diffusional creep and grain boundary sliding occurred. The data of Jimenez et al.6) for the transition from grain boundary sliding to dislocation climb at higher stress is shown in Fig. 6 as the dashed line. The difference with the results of the present work is small and there is good agreement over the fact that grain boundary sliding must be the rate controlling deformation process in continuous recrystallization annealing conditions. The stress range during the strain rate jump tests showed that a strain rate sensitivity higher than 0.5 was obtained in the region where the grain boundary sliding was the dominant creep process. At higher strain rates, the jump tests were carried out in a higher stress range where grain boundary sliding was no longer the rate controlling creep mechanism and where dislocation climb became dominant.6) As a consequence, the strain rate sensitivity decreased to a value less than 0.25. Langdon has indicated that the strain rate sensitivities in superplasticity should be close to 0.5.15) This is because the grain boundary sliding, which is the dominant process of superplastic behavior, is rate controlling process when strain rate sensitivity is about 0.5. The stress-temperature conditions in which grain boundary sliding and superplastic behavior occur, i.e. the conditions for which the strain rate sensitivity is larger than 0.5, are also indicated in Fig. 14.
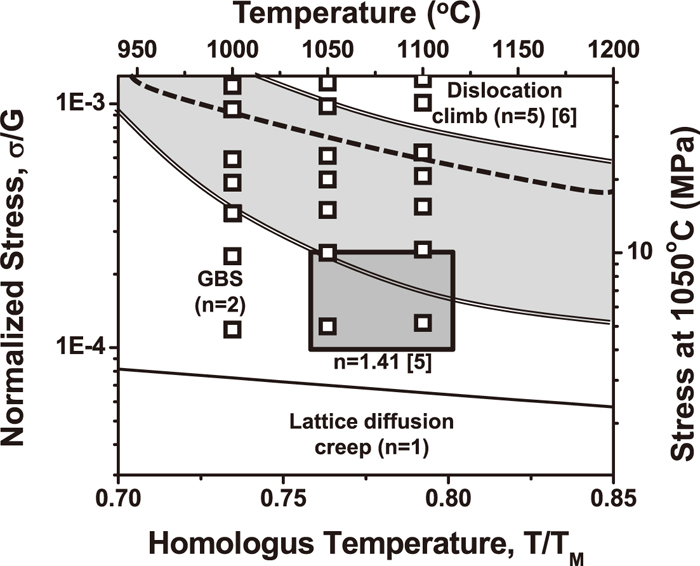
Deformation map of duplex stainless steel based on the experimental data obtained in the present work showing the transition stress from lattice diffusional creep to grain boundary sliding (solid line). The experimental conditions are indicated as squares. Literature data showing the region where the stress exponent was reported to be 1.41 is indicated by the dark grey area.5) The transition stress from grain boundary sliding to dislocation climb is shown with a dashed line.6) The range of deformation conditions characterized by a high strain rate sensitivity, i.e. close to 0.5, is represented by the light grey area.
In conclusion, it was shown that during the steady state creep deformation in conditions corresponding to continuous recrystallization annealing of cold rolled DSS, bulk ferrite and bulk austenite undergo viscous glide and lattice diffusion creep, respectively. The grain shape did not change due to the release of the stress concentration at the boundaries during the process of phase boundary sliding. Phase boundary sliding was identified as the dominant mechanism for superplastic creep deformation of DSS during continuous annealing.
The rate controlling mechanisms during creep deformation of type 2205 DSS and its constituent phases, ferrite and austenite, were investigated for standard temperature and stress conditions in continuous recrystallization annealing furnaces. The main conclusions are as follows:
In the bulk ferrite alloy, the rate controlling mechanism for creep in recrystallization annealing conditions is the glide of dislocations impeded by solutes. The main mechanism of creep deformation for the bulk ferrite phase is therefore viscous glide.
The dominant creep mechanism in the bulk austenite alloy in recrystallization annealing conditions is diffusional creep at low stress. Dislocation climb is the dominant creep mechanism at high stress.
The creep deformation mechanism in DSS in recrystallization annealing conditions is phase boundary sliding, accommodated by dislocation movement in the ferrite phase and lattice diffusional flow in the austenite phase.