Abstract
Chrome-Manganese steel is relatively new steel as compared to its counterpart 304 series stainless steels. There are relatively few studies on the welding behaviour of low nickel Cr–Mn stainless steel (in particular, on the effect of heat input on the microstructural developments). In the present investigation, a low nickel chrome-manganese stainless steel was welded (shielded metal arc welding process) to see the effect of heat input on the microstructural evolution and mechanical properties. At higher heat inputs (404.2 J/mm and 528.1 J/mm), tensile strength and hardness are lower compared to low heat input (316.6 J/mm). Fractographic investigation of the tensile tested specimen revealed dimple-like ductile fracture. An attempt was also made to evaluate the phases incorporated in the investigated steel using Schaeffler diagram.
1. Introduction
Nickel (Ni) prices have been relatively high worldwide over the last couple of years. This has led to a situation in which, the cost of Ni plays a significant role in the total cost of stainless steel (SS) production. As a result, there has been increased interest in low-nickel or no-nickel grades of stainless steel having properties similar to 18Cr–8Ni (18% Chromium and 8% Nickel) stainless steel.1,2) The AISI-200 series SS is a well-known example of low-Ni stainless steel alloyed with manganese (Mn) and the other alloying elements like nitrogen (N) and copper (Cu). In order to stabilize austenite phase, manganese acts as a substitute of nickel.3,4) These low-nickel stainless steels are economical than 300-series and are popularly known as chrome-manganese stainless steel (Cr–Mn SS).5,6) Its current contribution in total stainless steel production is more than 10%.7,8) Low nickel Cr–Mn SSs are used in various applications like home accessories, home appliances, light poles, construction, outdoor installation etc. (where high corrosion resistance is not required).3,9,10)
Generally the Schaeffler diagrams are used as an important tool for predicting the constitution of stainless steels by evaluating Cr and Ni equivalents.11) These diagrams are used to represent the effect of proportion of elements on the structure obtained after solution annealing.
According to latest information the 200-series SSs are the fastest growing steels and the future will place greater demand on low-Ni alloys in replacement of 300-series SSs with respect to mechanical properties. The shielded metal arc welding (SMAW) is one of the most frequently used fabrication technique for joining stainless steels like AISI 301, AISI 304 and AISI 316 SSs etc. As new economical engineering materials like Cr–Mn SS are developed freshly, it is important to cultivate the method of fabrication and filler materials for them.12,13) It is a well-defined fact that among all welding parameters in SMAW process, welding current (I) is the most influential parameter because it affects the current density and hence the rate of filler and base material.14,15) This welding current influences on mechanical and microstructural properties by altering its weld pool and heat affected zone (HAZ) width. There are numerous studies on the effect of welding and its parameters on 300-series stainless steels.6,16) Subodh Kumar et al.16) worked on multipass welding of 304 SS. They used gas tungsten arc welding (GTAW) process with three different heat inputs (2.563 kJ/mm, 2.78 kJ/mm and 3.017 kJ/mm respectively) and studied microstructural evolution and mechanical properties (like tensile strength and hardness). Their results indicated that lower heat input (2.563 kJ/mm) was superior to others for joining (but it should be sufficient for fusion of filler material and base material). R. V. Taiwade et al.17) made a systematic comparison of welding performance between AISI 304 and Cr–Mn SS using electrochemical studies. The effect of single, double and triple pass of welding on HAZ, sensitized zone (SZ-chromium carbides precipitated at grain boundaries) and tensile strength was investigated. The degree of sensitization (DOS) increased with increase in number of passes and highest DOS was obtained for triple pass welding of Cr–Mn SS. But a systematic characterization of low nickel Cr–Mn SS before and after welding is until an untouched area. Therefore the present work is focused on the effect of heat input (single pass welding by SMAW process) on microstructural evolution and mechanical properties of low Ni Cr–Mn SS.
2. Experimental Procedure
A low nickel Cr–Mn stainless steel was procured from local market in the form of a rolled sheet. The chemical composition of the steel is determined by optical emission spectrometer which is given in Table 1.
Table 1 Chemical composition (wt.%) of low nickel Cr–Mn stainless steel.
| Element | C | Si | Mn | P | S | Cr | Mo | Ni | Al | Cu | Co |
|---|
| (Wt.%) | 0.073 | 0.531 | 4.412 | 0.086 | 0.005 | 14.060 | 0.252 | 2.701 | 0.004 | 1.233 | 0.114 |
Three identical samples of dimension 150 mm × 50 mm × 6 mm (length × width × thickness) were obtained from the given sheet with the help of wire-cut electrical discharge machine (EDM). These samples were then solution annealed in silicon carbide (SiC) muffle furnace (Lenton, UK) at a temperature of 1050°C for 90 minutes followed by water quenching. Before submitting to welding, the oxide layer (which was formed due to rapid quenching) of samples was removed by polishing with the help of coarser emery papers (180 and 320 grit).
Bead-on-plate shielded metal arc welding (SMAW) was performed along the centre line of polished solution annealed samples using “AWS E - 308 - 16” electrode having diameter 3.15 mm.18) Usually after welding there are different zones formed in welded plates. The schematic representation of welded zones is given in Fig. 1.
BM- Base metal
HAZ- Heat affected zone
PMZ- Partially melted zone
FZ- Fusion zone
WZ- Welded zone
In order to study microstructural and mechanical properties, three different heat inputs were selected. First plate was welded at low heat input (85 A and 30 V), second at medium heat input (100 A and 35 V) and third at high heat input (115 A and 40 V) by a skilled welder. These heat inputs were evaluated using Eq. (1) (considering arc efficiency, η = 0.7)19) and are given in Table 2.
Where, “V” is arc voltage in volts (V),
“I” is welding current in amperes (A),
“v” is welding speed in mm/s.
Table 2. Welding parameters and heat input values.
| Specimen | Current (A) | Voltage (V) | Welding speed
(mm/s) | Heat input per unit length (J/mm) |
|---|
| Sample 1 | 85 | 30 | 5.637 | 316.6 |
| Sample 2 | 100 | 35 | 6.060 | 404.2 |
| Sample 3 | 115 | 40 | 6.097 | 528.1 |
After bead-on-plate welding the samples change their chemistry and formed different zones in SS plate. The welded samples with low, medium and high heat input is shown in Fig. 2.
From these welded plates, samples for microstructural examination, tensile tests and micro hardness were carefully obtained with the help of wire cut EDM. The schematic representation of obtained samples is shown in Fig. 3. In order to avoid the starting and end effects of welding heat, 5 mm part was discarded with the help of wire cut EDM from both side of welded plates. In order to find out the strength of welded joint the tensile specimen of dimension 150 mm × 5 mm × 6 mm was taken out from the welded plates (low, medium and high heat input) in crossways direction. All flat tensile specimens were prepared according to ASTM E 8M standards.21) Specimen was then fractured on tensile testing machine “INSTRON 4467”. The maximum capacity of tensile testing machine was 30 KN.

For metallographic examination, a sample of facet 50 mm × 10 mm × 6 mm was obtained from the centre of the weld in transverse route of weld direction from low, medium and high heat input plates. The open surface (50 mm × 6 mm) was polished on series of emery paper (180, 320, 600, 800 grit) and finally cloth polished with alumina slurry (0.75 μm). Subsequently the sample was ultrasonicated in distilled water prior to etching. A Potentiostat (Solartron-1285) was used galvanostatically as per ASTM standard A-262 Practice A test. In Practice A test, the sample was electrolytically etched in 10 wt.% oxalic acid solution with 1 A/cm2 current density for 90 seconds over the surface area of 10 mm × 6 mm and the remaining area was insulated using teflon tape.22)
3. Results and Discussion
3.1. Phase Identification
In order to find out the phases present in low nickel Cr–Mn SS before submitting to welding, Schaeffler diagram23) was used in this investigation as shown in Fig. 4. Nickel equivalent (Niequi) and chromium equivalent (Crequi) were calculated using given equations.23)
|
Cr equi=(
Cr
)
+2(
Si
)
+1.5(
Mo
)
+5(
V
)
+5.5(
Al
)
+1.75(
Nb
)
+1.5(
Ti
)
+0.75(
W
)
| (2) |
|
Ni equi=(
Ni
)
+(
Co
)
+0.5(
Mn
)
+0.3(
Cu
)
+25(
N
)
+30(
C
)
| (3) |

In Schaeffler diagram the graph is plotted between Ni equivalent and Cr equivalent (Crequi as abscissa and Niequi as ordinate). Calculated Niequi (7.58) and Crequi (15.52) were then located in Schaeffler diagram. The point in blue is positioned inside the red rectangle of graph in Fig. 4, which shows the actual phase composition of the investigated steel. According to this diagram it is evident that the studied low nickel Cr–Mn stainless steel contains an austenitic phase in a very small amount (as blue point situated at the transition line of A+M+F region and M+F region). Phases identified by Schaeffler diagram were then cross checked by optical micrograph of solution annealed sample (10 mm × 10 mm × 6 mm) which is shown in Fig. 5. The open surface (100 mm2) of sample was polished on series of emery paper (180, 320, 600, 800 grit) and finally cloth polished with alumina slurry (0.75 μm). Subsequently the sample was ultrasonicated in distilled water prior to etching. Then the sample was marble etched for 10 seconds and observed under optical microscope (Zeiss Axiolab). It is evident from obtained micrograph that the steel under investigation is consisting of phases like austenite; ferrite and martensite are in good agreement with Schaeffler diagram.

In welding operation, current (I) is one of the most influential parameter, because it affects the current density and hence the rate of filler and base material. The welding current is responsible to the formation of various zones including weld zone, fusion zone, partially melted zone, area near to the partially melted zone (i.e. HAZ) and unaffected base metal (see Fig. 1). The effect of heat input on HAZ was evaluated in terms of width and measured using image analyser (Zeiss Axiolab) was obtained as 118.79 μm, 131.52 μm and 138.08 μm for low, medium and high heat inputs respectively. It was observed that as the heat input (especially welding current, I) increases the width of HAZ also increases which is shown in Fig. 6.

When heat input value increased, the cooling rate decreased significantly and a sufficient time is available for grain growth. This grain coarsening leads to a great increment in sensitized zone (SZ) and HAZ and hence the true HAZ (sensitized zone + heat affected zone) increased subsequently for higher heat inputs and quantitatively given in Table 3.
Table 3. Measurement of HAZ, SZ and true HAZ for different heat inputs.
| Heat input | HAZ (μm) | SZ (μm) | True HAZ (μm) |
|---|
| Low | 62.10 | 56.69 | 118.79 |
| Medium | 67.45 | 64.07 | 131.52 |
| High | 70.91 | 67.17 | 138.08 |
The increase in width may be attributed to the formation of chromium carbides at the grain boundaries. Sensitized zone was further verified by using “SEM JEOL 6380” as shown in Fig. 7 (image a, b and c). Few traces of chromium carbides were observed for low heat input and the density increase for higher heat inputs subsequently. R. V. Taiwade et al.17) also worked on welding behaviour of low nickel Cr–Mn austenitic stainless steel and found that the width of true HAZ is about 5 mm for single pass SMAW with 766 J/mm heat input (75A, 35V and 2.57 mm/s). The width of true HAZ of studied steel is very small and found to be 138.08 μm for high heat input because the austenitic phase (evident from Figs. 4 and 5) presents in a small quantity and therefore only few sites of austenite is available for chromium carbide precipitation.
3.3. Effect of Heat Input on Welded Zone
Typically the dendrites decided the mechanical properties of welded joint. In the area of weld zone, only dendrites structure is present. We know that as the heat input value increases, the cooling rate decreases respectively.16,19) It has been observed that higher the cooling rate, shorter the solidification time and finer the dendrites structure. Dendrites arm spacing is the function of cooling rate or solidification time can be expressed by Eq. (4).24)
|
d=a
t
f
n
=b
(
ε
)
-n
| (4) |
Where,
‘d’ is the dendrites arm spacing,
‘tf’ is the local solidification time,
‘ε’ is the cooling rate and,
‘a’ and ‘b’ are proportional constant.
In the above equation dendrites arm spacing is directly proportional to solidification time, and inversely proportional to cooling rate. This dendrites growth phenomena during solidification is given microstructurally in Fig. 8.25)
The effect of low, medium and high heat input on dendrites structure of investigated steel is shown in Figs. 9(a), 9(b) and 9(c) respectively.
Micrographs in these images show that, as the heat input increases, sufficient dendrites growth was observed because of slow cooling rate. During solidification large dendrites arms grow at the expense of smaller ones. The slower the cooling rate during solidification, the longer is the time available for coarsening and larger the dendrites size and dendrites arm spacing. For confirmation of dendrites growth, weld zone was further characterized using “SEM JEOL 6380” and shown in Figs. 10(a), 10(b) and 10(c) respectively.

From SEM results it was also found that, the dendrite spacing is less at the top surface of the weld pool and increases towards the base metal. This is because the cooling rate is higher at the top surface (welding line) and decreases towards the base metal. The dendrite length and dendrite spacing was measured using image analyser (Zeiss Axiolab) is given in Table 4. The relationship between different heat inputs and dendrites size and spacing is presented in Fig. 11. The graph of the figure clearly indicates that the dendrite size and their spacing increases continuously with increasing heat input. Also it is known that alteration in dendritic size and spacing directly affects the mechanical properties of welded joint. This is the motivation to study the tensile strength and the hardness of welded joint in this investigation.
Table 4. Dendrite measurement for different heat inputs.
| Properties | Low heat input | Medium heat input | High heat input |
|---|
| Dendrite length (μm) | 126 | 198 | 325 |
| Dendrite spacing (μm) | 23 | 28 | 38 |
Tensile strength for low, medium and high heat input samples was evaluated with the help of tensile testing machine. Samples were loaded one by one at tensile test machine and force was applied, elongation takes place inside the sample and after some time it failed with a noisy sound. The maximum tensile strength was obtained for low heat input (650.81 MPa) and further it was prominently decreases with increase in heat input values (622.54 MPa and 569.32 MPa for medium and high heat input respectively). Small dendrite size and spacing attributed to high tensile strength and ductility for low heat input sample than others. Fractured samples were further analysed using SEM and fractograpghy results shows that all samples were failed within true HAZ region. Figures 12(a), 12(b) and 12(c) shows SEM fractographs of low, medium and high heat input respectively. Most of the failure took place in ductile manner and evident from dimple-like structures of fractured tensile samples.

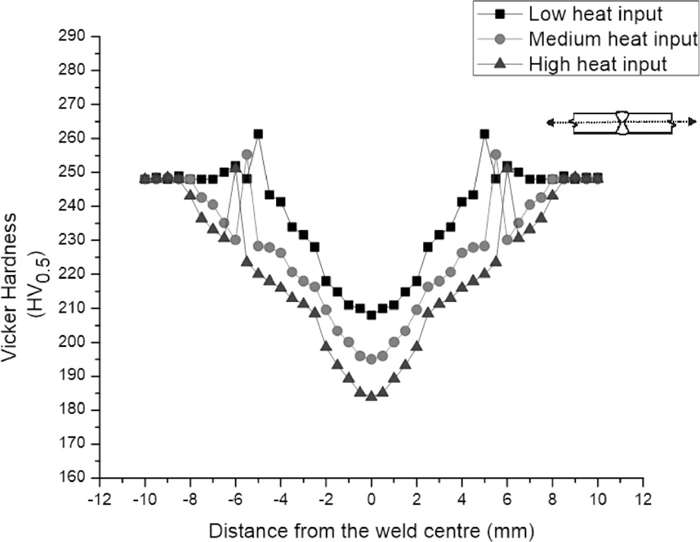
Microhardness measurement was carried out in transverse direction (i.e. perpendicular to weld centre line). Figure 13 shows the hardness curve for low, medium and high heat input for the indenter movement from weld zone toward base metal via. fusion zone, partially melted zone and heat affected zone. The microhardness graph is plotted on bilateral symmetry because most of the times hardness value is same on both side of the centre line at same distances. Hardness varies from 183.9 to 223.5 VHN for high heat input, 195 to 228.3 VHN for medium heat input and 208 to 243.4 VHN for low heat input. Highest hardness values for low, medium and high heat inputs were found 261, 255 and 251 VHN which can be attributed to the partially unmelted grains in PMZ (which are partially adopted as nuclei during solidification of welded joint). Afterwards samples shows decreasing trend of hardness in HAZ region due to grain coarsening. In HAZ, region near to PMZ subjected to slower cooling rate and resulted in coarse grains whereas area towards the base metal having faster cooling resulted in fine grain structure.
4. Conclusion
(1) Optical micrograph of solution annealed sample was cross checked by schaeffler diagram and it was concluded that steel consist of phases like austenite (in small amount), ferrite and martensite.
(2) Width of heat affected zone increases with increase in heat inputs. Accordingly considerable alterations in grain size (grain coarsening) were found and cause HAZ growth.
(3) Maximum tensile strength possessed by low heat input welded joint due to smaller dendrites and low spacing.
(4) Most of the fracture takes place in a ductile manner for low, medium and high heat inputs.
(5) Microhardness varies from centre of the weld to the base metal in an increasing manner, some different trends were also found in hardness profile because of PMZ formation (hardness is very high at partially un-melted region).
(6) Failure takes place inside the true HAZ, this means that tensile strength of weld joint is good enough and for welding of 6 mm thick plate, SMAW offers a wide range of parameters to the fabricator for low nickel Cr–Mn SS.
Acknowledgment
The authors would like to thank Director Dr. N. S. Chaudhari, VNIT Nagpur for providing the necessary facilities for carrying out this investigation and for his constant encouragement to publish this work. The authors are also grateful to Miss Adeeba Khan (Research Scholar, Corrosion Engineering Laboratory, Department of Metallurgical and Materials Engineering) for her help in conducting electrochemical tests, Mr. Shreedhar Gadge (Senior Technician, Chemical Analysis Laboratory Department of Metallurgical and Materials Engineering) for performing solution annealing treatment. The authors would also like to thanks Mrs. Varsha Patankar (Technical staff, Testing of Materials Laboratory, Department of Metallurgical and Materials Engineering) for her help in conducting mechanical testing.
References
- 1) M. Coetzee and P. G. H. Pistorious: J. S. Afr. I. Min. Metal., 96 (1996), No. 3, 99.
- 2) S. S. M. Tavares, J. M. Pardal, M. J. Gomes da silva, H. F. G. Abreu and M. R. da silva: Mater. Charact., 60 (2009), No. 8, 907.
- 3) “New 200-series” Steels: An Opportunity or A Threat to the Image of Stainless Steel?, ISSF, Brussels, Belgium, (2005).
- 4) R. Franks, W. O. Binder and J. Thompson: Tans. ASM, 47 (1955), 231.
- 5) J. C. Lippold and D. J. Kotecki: Welding Metallurgy and Weldability of Stainless Steels, John Wiley & Sons Inc. UK, (2005).
- 6) T. Oshima, A. Kimura and Y. Habara: CAMP-ISIJ, 18 (2005), 607.
- 7) T. Oshima, Y. Habara and K. Kuroda: ISIJ Int., 47 (2007), No. 3, 359.
- 8) V. Shankar Rao and L. K. Singhal: ISIJ Int., 49 (2009), No. 12, 1902.
- 9) 200-Series Stainless Steel Cr–Mn Grades, ASSDA Technical Bulletin, 1st ed., ASSDA, Australia, (2006).
- 10) R. S. Parmar: Welding Engineering and Technology, 1st ed., Khanna Publication, New Delhi, India, (2004).
- 11) D. L. Olson: Prediction of Austenitic Weld Metal Microstructure and Propertie, presented at AWS 65th Annual Meeting, held April 9-13, (1984), in Dallas Tex.
- 12) American Iron and Steel Institute: Welding of Stainless Steel and Other Joining Method, Washington, D.C., (1979).
- 13) A. M. S. Hamouda, S. Sulaiman, T. R. Vijayaram, M. Sayuti and M. H. M. Ahmad: J. Achiev. Mater. Manuf. Eng., 25 (2007), No. 1, 63.
- 14) Y.-Q. Zhang, H.-Q. Zhang, I.-F. LIU and R. Wei: J. Iron Steel Res., 16 (2009), No. 5, 73.
- 15) Y. D. Han, H. Y. Jing and L. Y. Xu: Mater. Chem. Phys., 132 (2012), No. 1, 216.
- 16) S. Kumar and A. S. Shahi: Mater. Design, 32 (2011), No. 6, 3617.
- 17) R. V. Taiwade, A. P. Patil, R. D. Ghughal, S. J. Patre and R. K. Dayal: ISIJ Int., 53 (2013), No. 1, 102.
- 18) R. V. Taiwade, S. J. Patre and A. P. Patil: TIIM, 64 (2011), No. 6, 513.
- 19) L. M. Gourd: Principles of Welding Metallurgy, 1st South Asian ed., A Butterworth-Heinemann, Oxford, (1998).
- 20) K. Weman: Welding Processes Handbook, Woodhead publishing Ltd, New York, (2003).
- 21) Standard Tests Methods for Tension Testing of Metallic Materials (Metric), ASTM E 8M, ASTM, Philadelphia, PA, (1989).
- 22) R. V. Taiwade, A. P. Patil, S. J. Patre and R. K. Dayal: J. Mater. Eng. Perform., 22 (2012), No. 6, 1716.
- 23) F. B. Pickering: The Metallurgical Evolution of Stainless Steel, ASM Internationals, Metals Park, OH, (1979).
- 24) S. Kou: Welding Metallurgy, 2nd ed., Wiley, New York, (2003).
- 25) J. Campbell: Castings, Butterworth-Heinemann Ltd., Oxford, (1991).


