Abstract
The elastic limit (maximum elastic strain) of Fe–Pd alloys exhibiting a second-order-like martensitic transformation from the face centered cubic structure to the face centered tetragonal structure was investigated by varying the test conditions. The elastic limit decreased from 7.3% to 4.6% as temperature was increased from 240 K to 300 K, a phenomenon that can probably be attributed to the strong temperature dependence of the elastic constant C′. The elastic limit also significantly decreased upon changing the compression direction from [001] to [011] because of the large elastic anisotropy. However, the critical resolved shear stress was only slightly influenced by temperature and the compression direction. The elastic limit of a polycrystalline specimen of the alloy was one order in magnitude smaller than that of its corresponding single crystal.
1. Introduction
Superelasticity in shape memory alloys (SMAs) has attracted considerable attention owing to its large recoverable strain.1) This behavior is mainly studied in alloys exhibiting typical first-order thermoelastic martensitic transformations (MTs). In these alloys, the lattice parameters change discontinuously at the transformation temperature and vary only slightly in the martensite phase. The reversible strain in this kind of SMAs primarily arises from changes in the lattice parameter at the transformation temperature.2,3) Compared with the transformation strain (1–10%), elastic strains in the parent and the martensite phases are usually 1% or smaller.3,4)
The MT from the face centered cubic (FCC) structure to the so-called face centered tetragonal (FCT) structure in Fe–Pd alloys is a weak first-order (second-order-like) transformation in the sense that the lattice parameters show a small discontinuity at the transformation temperature and then change gradually with decreasing temperature.5,6,7) A characteristic feature of Fe–Pd alloys is the lattice softening of the parent phase. Such softening has been reported in an Fe-30.0Pd (at.%) alloy in that its elastic constant C′ [= (C11–C12)/2] decreases during the cooling process upon approaching the transformation temperature, and the value near the transformation temperature is below 5 GPa approximately.8) The softening in C′ is possibly caused by the band Jahn–Teller effect.9)
Because of the lattice softening, a large elastic-like strain with a low Young’s modulus in the [001] direction is expected in this alloy. The anticipated large elastic-like strain (more than 6%) has been confirmed for Fe-31.2Pd (at.%) single crystals.10) Considering the fact that elastic constants strongly depend on temperature and direction,8) we may expect that the limit of elastic strain in Fe–Pd alloys also significantly depends on these factors. However, this has not been reported as yet. Therefore, in this paper, we examine the influence of the test temperature, the compressive direction, and the grain boundary on the limit of the elastic strain in Fe–Pd alloys.
2. Experimental Procedure
Ingots of Fe-30.8 and 31.2 Pd (at.%) alloys were prepared by an arc melting method using a high purity Fe rod (99.998%) and a Pd sheet (99.9%) as starting materials. Single crystals of these alloys for compressive tests were grown by a floating zone method at a growth rate of 3 mm/h. The orientation of the single crystals was determined with a back-reflection Laue method. Parallelepiped specimens were cut from the single crystals. Details of the specimens and compressive directions are listed in Table 1. In this paper, the index of orientation is stated on the basis of the parent phase. After heat-treatment for homogenization at 1375 K for 24 h, the specimens were quenched in ice water to retain the disordered parent phase. The FCC-FCT MT temperature of the Fe-30.8Pd (at.%) alloy was Ms = 255 K and that of the Fe-31.2Pd (at.%) alloy was Ms = 230 K. These values are in agreement with those reported previously.11) Compressive tests were performed using a SHIMADZU Autograph AG-I 50 kN MODEL M1 equipment, at a strain rate of 5×10⁻⁵ s–1. The strain rate was selected to ensure an isothermal condition. The strain was measured by using strain gages (KYOWA, KFL-02-120-C1-11). Owing to the limitations of the strain gage, strains of over 4% were obtained by calibrating the displacement of the crosshead of the testing machine. This procedure has been reported in detail elsewhere.10)
Table 1. Composition and dimensions of the specimens used for compression tests.
Composition
(at.%) | Size of the specimen | Compression direction |
|---|
| Fe-31.2Pd | 3.4 [100] × 3.4 [010] × 11.4 [001] mm3 | [001] |
| Fe-31.2Pd | 2.4 [100] × 2.3 [010] × 6.6 [001] mm3 | [001] |
| Fe-31.2Pd | 2.7 × 2.7 × 13.9 mm3 (Polycrystal) | – |
| Fe-30.8Pd | 3.3 [100] × 3.4 [010] × 11.0 [001] mm3 | [001] |
| Fe-30.8Pd | 2.7 [100] × 2.7 [010] × 7.0 [001] mm3 | [011] |
3. Results
3.1. Influence of Temperature on the Elastic Strain Limit
Figure 1 shows the stress-strain curves of the Fe-31.2Pd (at.%) alloy single crystals compressed in the [001] direction at 240 K and 300 K. The result at 240 K, which is 10 K above Ms, is reproduced from the result reported previously.10) The dashed lines in (a) and (b) are obtained by applying the maximum stress of 250 MPa and 300 MPa, respectively. These stresses are below the yield point, and the strain completely recovers during the stress removing process. The solid lines in (a) and (b) are obtained by applying the maximum stress of 300 MPa and 400 MPa, respectively. The yield stress at 240 K is 285 MPa and that at 300 K is 310 MPa, and is almost independent of temperature. However, the maximum elastic strain depends strongly on temperature. It is about 7.3% at 240 K and about 4.6% at 300 K. The difference comes from the temperature dependence of Young’s modulus, which is essentially due to the temperature dependence of C′.

The strain induced after the elastic limit does not recover during the stress removal process. In order to understand the defects induced by plastic deformation, we made observations with a transmission electron microscope. Figure 2(a) is a representative bright field micrograph observed after plastic deformation at 300 K. Figures 2(b) and 2(c) are diffraction patterns taken from the regions B and C in (a), respectively, and Fig. 2(d) is the dark field image taken from the encircled reflection in (c). From the diffraction patterns, it is evident that the banded region is twinned to the matrix with the twinning plane {111}.12) Consequently, we may conclude that {111}/
1
6
<112> type mechanical twinning is introduced by plastic deformation at 300 K. The same result was obtained for the specimen deformed at 240 K.10)
3.2. Influence of Alloy Composition on the Elastic Strain Limit
The large elastic strain observed in Fig. 1(a) is not limited to the Fe-31.2Pd (at.%) alloy. We may expect the same large strain in the Fe–Pd alloys with different compositions when a compressive stress is applied in the [001] direction near its Ms. Figure 3 shows the stress-strain curve of the Fe-30.8Pd (at.%) alloy obtained at 255 K (= Ms). The dashed curve is obtained by applying a maximum stress of 250 MPa in the [001] direction. The strain completely recovers during the stress relieving process. The solid curve in Fig. 3(a) is obtained by applying a maximum stress of 300 MPa. We notice that the yield point appears at 270 MPa, and the strain induced after the yield point does not recover during the stress relieving process. The maximum elastic strain is about 7.5%. These results are essentially the same as those of the Fe-31.2Pd (at.%) alloy tested at 240 K (Fig. 1(a)).
3.3. Influence of Orientation on the Elastic Strain Limit
Figure 3(b) shows the elastic strain limit of the Fe-30.8Pd (at.%) single crystals compressed in the [011] direction at Ms = 255 K. A clear yield point appears at 295 MPa; the corresponding elastic strain is 1.6%. The limit of the elastic strain in the [011] direction is much smaller than that in the [001] direction (7.5% in Fig. 3(a)). This means that the limit of the elastic strain of the Fe-30.8Pd (at.%) single crystal depends significantly on the direction of compression. This behavior can be attributed to the large elastic anisotropy in Fe–Pd alloys, which will be further discussed in section 4.
3.4. Influence of Grain Boundary on the Elastic Strain Limit
The significant elastic anisotropy observed in Fig. 3 implies that we may not expect a large elastic strain in polycrystalline specimens. A compressive test of a polycrystalline Fe-31.2Pd (at.%) alloy at 240 K was carried out and the results are shown in Fig. 4, in which the origin is shifted such that the residual strain can be clearly noticed. The strain induced by the stress almost completely recovers when the maximum stress is 150 MPa and lower. However, when the stress exceeds 150 MPa, an obvious residual strain appears. Therefore, we consider that the yield stress of a polycrystalline specimen is approximately 150 MPa, which is consistent with the values previously reported for a polycrystalline specimen of the Fe-30.5Pd (at.%) alloy.13) We notice that the yield stress of the polycrystalline specimen is about half of the yield stress of single crystals. Presumably, stress concentration occurs in grains that have a Young’s modulus higher than those of the surrounding grains because of the large elastic anisotropy, which is discussed in section 4.

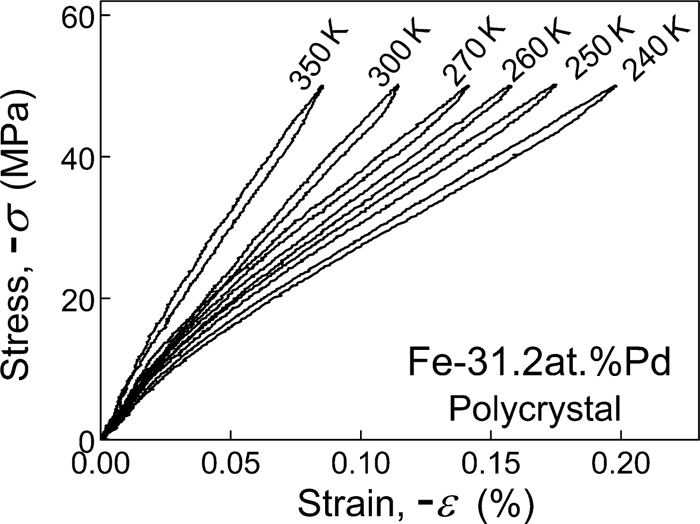
In the preceding subsections, we described the effect of various conditions on the elastic limit. In this subsection, we describe the impact of these conditions on the elastic behavior within the elastic limit. Figures 5(a) and 5(b) show the stress-strain curves of the Fe-30.8Pd (at.%) single crystals compressed in the (a) [001] and (b) [011] directions at various temperatures (above the transformation temperature). It is found that the elastic strain increases with decreasing temperature under the same stress in both directions. However, the elastic strain in the [011] direction is much smaller than the strain in the [001] direction at the same temperature and stress. Similar experiments were conducted in a polycrystalline specimen using the Fe-31.2Pd (at.%) alloy. Figure 6 shows the stress-strain curves of a Fe-31.2Pd (at.%) polycrystal compressed up to 50 MPa at various temperatures as indicated in the figure. It is found that the elastic strain increases with decreasing temperature, which is consistent with the behavior of single crystals.

The Young’s modulus obtained from the initial slope of Figs. 5 and 6 is shown in Fig. 7. In the figure, its value for the Fe-31.2Pd (at.%) alloy in the [001] direction, which is obtained from the stress-strain curve reported previously,14) is also shown for comparison. We know from Fig. 7 that the Young’s modulus in the [011] direction is about eight times as large as that in the [001] direction. We also know that the Young’s modulus of the polycrystalline specimen is much higher than that in the [001] direction.
4. Discussion
The plastic deformation of an Fe-31.2Pd (at.%) single crystal compressed in the [001] direction at 240 K and 300 K is mainly caused by the mechanical twinning {111}/
1
6
<112>, which is confirmed by TEM observations. The critical resolved shear stress, τCRSS, is given by Schmid’s law as follows:
|
τ
CRSS
=
σ
Y
cosφcosλ,
| (1) |
where
σY is the yield stress and cos
φ cos
λ is the Schmid factor. The value of
τCRSS for the mechanical twinning is calculated to be approximately 139 MPa at 240 K and 149 MPa at 300 K. We notice that
τCRSS is not sensitive to the testing temperature.
We may assume that the plastic deformation of the Fe-30.8Pd (at.%) single crystal also occurs by the same mechanical twinning as that seen in the Fe-31.2Pd (at.%) alloy. Then τCRSS of the Fe-30.8Pd (at.%) alloy is calculated to be 131 MPa when compressed in the [001] direction and 140 MPa when compressed in the [011] direction. We notice that the value of τCRSS is almost independent of the composition of the alloy and compression direction.
In polycrystalline specimens, the Schmid factor depends on the orientation of each grain. If we assume that the Schmid factor takes the largest value (0.5) in the plastically deformed grain, τCRSS of the grain comes out to be 75 MPa. This value is approximately half of the τCRSS obtained for single crystals. Presumably, the value of τCRSS is not correctly evaluated because of the stress concentration in the grains. Such stress concentration is expected to occur because of the large elastic anisotropy in the Fe-31.2Pd (at.%) alloy.
Using the following equation, we roughly estimated the elastic constants C′ and C44 of the Fe-31.2Pd (at.%) alloy. The elastic constant C′ is given as:15)
|
1/C′=3/
E
[
001
]
- 1/(3K),
| (2) |
where
K is the bulk modulus and
E[001] is Young’s modulus in the [001] direction. Concerning
K, in this case for the Fe-31.2Pd (at.%) alloy, we assume that its value is the same as its corresponding value for the Fe-30.0Pd (at.%) alloy (120 GPa in the examined temperature range).
8) Then, using
E[001] shown in
Fig. 7, we obtain
C′ as shown in
Fig. 8. The elastic constant
C44 can be expressed by the Young’s modulus of polycrystalline specimens,
EPOLY, and the elastic constant,
C′, as:
16,17)
|
C
44
=(5
E
POLY
K+
E
POLY
C′/3-3KC′)/(9K-
E
POLY
)
| (3) |
Using the value of
EPOLY shown in
Fig. 7 and
C′ shown in
Fig. 8, we obtain the elastic constant
C44 as shown in
Fig. 8. At 240 K,
C44/
C′ for the Fe-31.2Pd (at.%) alloy is approximately 28 at 240 K.
Owing to the large elastic anisotropy, the elastic strain in a polycrystalline specimen depends strongly on the orientation of each grain. The difference in elastic strains of the grains results in a stress concentration in the grains with a high Young’s modulus. Therefore, τCRSS appears to be of small value in a polycrystalline specimen.
The low yield stress of polycrystalline specimens due to a large elastic anisotropy is also reported in Cu-based SMAs (C44/C′ ≈ 13 for Cu–Al–Ni alloy18) and C44/C′ ≈ 15 for Cu–Zn–Al alloy19)). In the case of polycrystalline Ti–Ni SMAs with a high yield stress, the elastic anisotropy is small (C44/C′ ≈ 2), and it shows an excellent superelastic behavior.20,21)
5. Conclusions
The influence of various conditions on the limit of the elastic strain in Fe–Pd alloys is investigated. It is observed that the elastic strain limit depends significantly on temperature, which can probably be attributed to the strong temperature dependence of the elastic constant C′. The limit of elastic strain is also significantly influenced by the compression direction because of the large elastic anisotropy in Fe–Pd alloys. Conversely, the critical resolved shear stress is not significantly influenced by temperature and compressive direction. The existence of grain boundaries is largely responsible for the decrease in the critical resolved shear stress.
Acknowledgements
This work was supported by the 21st ISIJ Research Promotion Grant from The Iron and Steel Institute of Japan, and partly by Grant-in-Aid for scientific study by JSPS (Kiban B 23360280).
References
- 1) K. Otsuka and C. W. Wayman: Shape Memory Materials, Cambridge University Press, Cambridge, (1998), 2.
- 2) T. Saburi and S. Nenno: Proc. Int. Conf. on Solid-Solid Phase Transformations, AIME, Warrendale, PA, (1982), 1455.
- 3) K. Otsuka, C. W. Wayman, K. Nakai, H. Sakamoto and K. Shimizu: Acta Metall., 24 (1976), 207.
- 4) S. Miyazaki, K. Otsuka and Y. Suzuki: Scr. Metall., 15 (1981), 287.
- 5) R. Oshima, S. Sugimoto, M. Sugiyama, T. Hamada and F. E. Fujita: Trans. JIM, 26 (1985), 523.
- 6) S. Muto, R. Oshima and F. E. Fujita: Metall. Trans., 19A (1988), 2723.
- 7) J. Cui, T. W. Shield and R. D. James: Acta Mater., 52 (2004), 35.
- 8) S. Muto, R. Oshima and F. E. Fujita: Acta Metall., 38 (1990), 685.
- 9) O. Ingo, K. Koepernik, U. Nitzsche and M. Richter: Appl. Phys. Lett., 94 (2009), 072508.
- 10) F. Xiao, T. Fukuda, T. Kakeshita and K. Takahashi: Acta Mater., 61 (2013), 4044.
- 11) F. Xiao, T. Fukuda, T. Kakeshita and K. Takahashi: J. Alloys. Compd., 577S (2013), S323.
- 12) H.-J. Kestenbach: Metallography, 10 (1977), 189.
- 13) H. Kato, Y. C. Liang and M. Taya: Scr. Mater., 46 (2002), 471.
- 14) F. Xiao, T. Fukuda and T. Kakeshita: Appl. Phys. Lett., 102 (2013), 161914.
- 15) N. Nakanishi: Prog. Mater. Sci., 24 (1980), 143.
- 16) R. Hill: Proc. Phys. Soc., 65 (1952), 349.
- 17) T. Saito, T. Furuta, J-H. Hwang, S. Kuramoto, K. Nishino, N. Suzuki, R. Chen, A. Yamada, K. Ito, Y. Seno, T. Nonaka, H. Ikehata, N. Nagasako, C. Iwamoto, Y. Ikuhara and T. Sakuma: Science, 300 (2003), 464 (see supplemental material).
- 18) M. Suezawa and K. Sumino: Scr. Metall., 10 (1976), 789.
- 19) G. Guénin, M. Morin. P. F. Gobin, W. Dejonghe and L. Delaey: Scr. Metall., 11 (1977), 1071.
- 20) S. Miyazaki, Y. Ohmi, K. Otsuka and Y. Suzuki: J. Phys., 43 (1982), C4-255.
- 21) T. Saburi, S. Nenno, Y. Nishimoto and M. Zeniya: J. Iron Steel Inst. Jpn., 72 (1986), 571.