Abstract
The hot ductility of Nb–Ti bearing ship plate steel has been obtained using the Gleeble 1500 thermal-mechanical simulator, the results showed that the ductility trough of the reduction of area (R.A) curve of Nb–Ti bearing ship plate steel is wider than other steels without Nb. In order to investigate the reasons of the loss of the ductility, a series of studies have been done. It was found that Nb(C,N) particles with a mean size of 9 nm precipitate at 950°C and induce the formation of the nuclei of grain boundary ferrite, which could lead to strain concentration at grain boundaries as well as the poor uniformity of ferrite films thickness. This causes rapid decrease of the R.A values with the temperature cooling from 1000 to 950°C. When the temperature falls to 900°C, a large number of Nb(C,N) particles precipitate, which promote further formation of the grain boundary ferrite films. Therefore, the thickness of ferrite films formed at different time makes a difference and presents a poor uniformity. As the temperature down to 850°C, hot ductility further reduces because of the worse uniformity of ferrite films thickness which leads to strain concentration at the grain boundary. When temperature is close to Ae3 (816°C), the formation and growth of ferrite films become faster due to austenite-ferrite phase transformation, which leads to the uniformity of ferrite film thickness at worst, so that the R.A value exhibits a rapid decrease. After the temperature is lower than Ae3, ferrite films are markedly thickened, which compensate parts of adverse effects from the poor uniformity of ferrite films thickness and reduce the strain concentration at grain boundaries. In this way, ductility begins to recover.
1. Introduction
In order to effectively refine the grain of steel and improve its strength and toughness, a certain amount of Nb or Ti is commonly added, so the microalloy steels containing Nb or Ti have been widely used at present. However, ductility trough of continuous casting slab becomes wider for Nb bearing steel, especially expands to the higher temperature, which is easy to cause surface cracks during the straightening operation carried out in the temperature range from 1000°C down to 700°C.1,2) Therefore, the surface temperature of slab before the straightening operation has to be raised in the process of practical production. The measures such as making the casting speed faster, reducing the intensity of secondary cooling have been taken. Nevertheless, these measures will cause side effects for the quality of the slab such as shrinkage cavity, loose, segregation, internal crack, etc. Therefore, to find out the influence of Nb on high temperature mechanical properties has always been a concerned topic for the continuous casting workers.
Many studies have pointed out that there are lots of reasons about the extension of the ductility trough to higher temperature,3,4,5,6,7,8,9,10,11) while the precipitation of the microally elements is just one of the important influencing factors. In addition, a small number of the thin induced ferrite films formed at a higher temperature around the grain boundary also plays a big role in influencing ductility of steel, since these thin and soft ferrite films can cause a large strain concentration, which leads in this way to intergranular failure by the nucleation of grain boundary cracks and reduction of the ductility.12,13,14) In the case of Nb-bearing steels, the precipitation of Nb can favor ferrite nucleating around the γ boundary at a higher temperature, even above the Ae3. Furthermore, close to Ar3, the drag of solute Nb will delay the occurrence of phase transition and suppress the recovery of the ductility. Therefore, the ductility trough of the Nb-bearing steel becomes wider.15,16,17,18)
The quantitative study about the effect of the thickness and uniformity of the grain boundary ferrite films on the ductility of the high temperature region of the ductility trough in the Nb-bearing continuous casting slab is seldom reported. In this paper, in order to find out the effect of the precipitation behavior of Nb and the distribution regularity of ferrite films on the ductility, a systematic investigation about the continuous casting slab of Nb-bearing ship plate steel was done through the measurement of the R.A curve, quantitative statistics of the precipitation fraction and thickness of the grain boundary ferrite films, observation of the ferrite morphology, and also the study of precipitation characteristics of Nb. It has important significance to improve the quality of casting slab.
2. Material and Experimental Procedure
The steel used in the present study was Nb–Ti bearing low-carbon ship plate steel, the chemical composition of this steel is given in Table 1. Cylindrical tensile specimens of 120 mm in length and 10 mm in diameter were machined from continuous casting slab, a Gleeble 1500 thermal-mechanical simulator was employed to perform the hot tensile straining and the hot ductility was determined as the reduction of area (R.A.). After the specimens were positioned horizontally and fixed, the argon was inflated into the sample chamber at 1 L/min. The specimens were heated at 10°C/s to 1350°C and hold for 5 min followed by direct cooling to test temperature at 3°C/s. Specimens were held for 60 s at the final testing temperature before stretching straining to failure at the slow strain rate of 0.001 s–1, after fracture the specimens were allowed to rapidly cool by spraying a lot of water to keep the original morphology of fracture surface, the thermal schedule as shown in Fig. 1(a). In order to be more intuitive understanding of the influence of addition of Nb on the ductility, the Ti-bearing ship plate steel and Si–Mn steel were used for comparison, the compositions of the two steels as shown in Table 1. The the ductility of Ti-bearing ship plate steel was determined through the same thermal schedule as the Nb–Ti bearing ship plate steel, and the ductility of the Si–Mn steel came from the work of Ouchi.5) Figure 1(b) shows the thermal cycle used for investigation of ductility of the Si–Mn steel in the Ouchi’s study. Although there are a few small differences, such as lower redissolved temperature (1300°C) and longer keeping time before fracture (5 min), which has hardly obvious effect on the ductility from the precipitation of the microalloys since the lack of microalloying elements.1) In addition, the strain rate of 0.004 s–1 is a little bigger, which has the same order of magnitude compared with the present work (0.001 s–1). Therefore, the ductility from the work of Ouchi is selected for comparison with author’s work.
Table 1. Composition of Nb–Ti bearing ship plate steel examined and the steels used for comparison, mass%.
| Steel | C | Si | Mn | P | S | Nb | Ti | Al | N |
|---|
| Nb–Ti bearing | 0.16 | 0.22 | 1.20 | 0.014 | 0.002 | 0.025 | 0.015 | 0.028 | 0.0056 |
| Ti bearing | 0.16 | 0.22 | 1.43 | 0.015 | 0.004 | — | 0.022 | 0.031 | 0.0032 |
| Si–Mn5) | 0.15 | 0.29 | 1.36 | 0.013 | 0.006 | — | — | 0.022 | 0.0066 |

The specimens after tensile test, as shown in Fig. 2(a), were cut off into cylindrical specimens of 10 mm in length on the side of fracture surface. Subsequently, these cylindrical specimens of 10 mm in length were cut off longitudinally, as shown in Fig. 2(b), and then were polished and etched using 4% nital alcohol solution to obtain the metallographic microstructures. With the aid of a Metalloscope, the observation of metallographic microstructures was carried out in the perspective of the magnified 200 times, so 20 fields of microstructure pictures with a side length of 0.6 mm in square were obtained in succession near the fracture region of 3 mm, as shown in Fig. 2(c). Ferrite volume fraction was analyzed by using the ImageJ software to each microstructure picture, and the mean value of the ferrite volume fraction from 20 microstructure pictures was obtained at each temperature. The thickness and length of the grain boundary ferrite films were measured by using SuperImage software, and the sum of length of ferrite films in each thickness range (0–1 μm, 1–2 μm and 3–4 μm, etc.) and the overall of ferrite films in 20 fields of microstructure pictures at each temperature were obtained through the precise measurement of the thickness and length of the grain boundary ferrite films in all the pictures, where the average thickness and the overall length of grain boundary ferrite films at each temperature as shown in each picture in Fig. 8. It is worth noting that the ferrite films are not completely surrounded by the grain boundaries at 950°C, so the overall of grain boundaries instead of the overall of the ferrite films were measured and the ferrite film-lack grain boundaries were classified within the thickness range of 0–1 μm. Finally, the frequencies of ferrite films of different thicknesses can be obtained through dividing the sum of length of ferrite films in each thickness range (0–1 μm, 1–2 μm and 3–4 μm, etc.) by the overall of grain boundary ferrite films observed in 20 fields of microstructure pictures at each temperature.

In addition, three square carbon films with 2 mm side length which were used for carbon replicas were taken in 3 mm area adjacent to the fracture surface, the location of these carbon films as shown in Fig. 3. Precipitates were examined by using transmission electron microscope (TEM) at each temperature, and the chemical compositions of precipitates were analyzed using an energy dispersive spectrometer (EDS), 20 fields from three square carbon films at each temperature were selected for determining the size distribution of the numerous precipitates by using the “Soft Imaging System” software of TEM. The equilibrium phase transition temperature (Ae3) of the steel was calculated through Thermal-calc software, and the ferrite transformation starting temperature (Ar3) was measured by dilatometer experiments.
3. Results
3.1. Hot Ductility
The curves presenting reduction of area (R.A.) as a function of the test temperature for Nb–Ti bearing ship plate steel, Ti-bearing ship plate steel and Si–Mn steel are shown in Fig. 4, where the first two steels were studied by present author and the last one was the work of Ouchi.5) It is indicated that these three steels all have a good ductility at 1000°C, but the ductility of Nb–Ti bearing and Ti-bearing steel decrease rapidly when the temperature down to 950°C from 1000°C, where the decrease degree of the former is largest. It is easy to see that the ductility trough of Nb–Ti bearing steel extends to a higher temperature than that of the other two steels without the addition of Nb, and presents a poor ductility at a higher temperature. Nevertheless, the ductility of all three steels have different degree of rebound as the temperature is below 800°C, whereas Nb–Ti bearing steel has the least extent of recover, so the ductility trough of it extends to a much lower temperature than the other two steels. The effect of the formation and distribution of grain boundary ferrite films and precipitates on the ductility about Nb–Ti bearing ship plate steel will be mainly discussed further.

The volume fraction of induced grain boundary ferrite and R.A as a function of temperature for Nb–Ti bearing steel are shown in Fig. 5. It can be seen that the precipitation of ferrite at grain boundary occurs when the temperature down to 950°C from 1000°C and the R.A at the same time presents a rapid decline, although the amount of volume fraction of ferrite is less than 2% at 950°C. As the temperature cooling to 850°C, the volume fraction of ferrite increases slowly and the reduce of R.A becomes slow in the meantime. When the temperature further falls to 800°C, which is below Ae3 (816°C), the volume fraction of ferrite increases to 15%, at this time the steel has a minimum of R.A. At the followed more lower temperature, the volume fraction of ferrite begins to increase rapidly as the temperature decreases, the R.A also presents the trend of rapid increase, the value of ferrite volume fraction and R.A are 71% and 51% when the temperature at 650°C, respectively.

The microstructures of Nb–Ti bearing steel at different temperatures are shown in Fig. 6. It can be seen that the precipitation of ferrite at γ boundary has occurred at 950°C, as shown in the black arrow in the picture, although the thickness of ferrite films is very thin and the films fail to exist at everywhere of the γ boundary. As the temperature further drops to 900°C the thickness of ferrite films become heavier and the γ grain boundaries are wrapped completely, also the thickness of ferrite films at different positions of the grain boundary appears to be uneven. The above changing behaviour trend of the grain boundary ferrite films extends to 850°C, but the ferrite films are still keeping relatively thin at these temperatures. In the process of the temperature cooling to 800°C from 850°C, the thickness of ferrite films grows fast and its nonuniformity increases obviously. When the temperature down to 750°C, the thickness and nonuniformity of ferrite films further increase. Ferrite almost accounts for most of the metallographic microstructure at 650°C due to the occurrence of ferrite phase transformation on a big scale. These grain boundary ferrite films with different thicknesses have significant effect on the ductility, so the thickness distribution and the volume fraction of induced grain boundary ferrite films are to be discussed in detailed.

Figure 7 shows the microstructures of Ti bearing steel at different temperatures, it can be known that there is no ferrite at the grain boundary. What is more, incomplete grain boundaries resulted from the grain boundary migration are widespread, as shown the area covered with white words in Fig. 7 (left), which indicated the occurrence of dynamic recrystallization. Only a small amount of ferrite films precipitate at grain boundary until that the temperature drops to 900°C, as shown the black arrow in Fig. 7 (right). So it can be understood that the addition of Nb can promote the precipitation of grain boundary ferrite to higher temperatures by comparing Nb–Ti bearing steel (in Fig. 6) and Ti bearing steel (in Fig. 7).
3.2.3. Thickness of Ferrite Films
The frequency of grain boundary ferrite films with different thickness as a function of temperature of Nb–Ti bearing steel are shown in Figs. 8 and 9 presents the average thickness of ferrite film versus temperature. It is shown that ferrite has already formed at γ boundary when the temperature is above 950°C, as the temperature down to 950°C the thickness distribution of ferrite films mainly concentrates in the range of 1 to 4 μm, and the average thickness of ferrite films at 950°C is 1.86 μm. These thin ferrite films with lower strength compared with the austenite can lead to the strain concentration of grain boundary when the deformation is taking place, so that it can weaken the cohesion of the grain boundary and reduce the ductility of steel. With the temperature decreasing from 950°C to 900°C, the ferrite films become thicker, but the nonuniformity of the ferrite films thickness raises. The changing trend of the grain boundary ferrite films continues to 850°C, however, when the temperature down to near 800°C which is under Ae3, ferrite grows up quickly due to ferrite phase transformation. Although the average thickness of ferrite films increase rapidly and up to 5 μm as shown in Fig. 9, the nonuniformity of ferrite films thickness is further bigger which leads to the increase of local strain concentration. Along with the temperature down to below Ae3, the ferrite films become thicker and the nonuniformity becomes gradually smaller simultaneously. In this way, the strain concentration at the grain boundary decreases correspondingly, which is in favor of the improvement of ductility.

Figure 10 shows the distribution and composition of precipitates at 950°C of Nb–Ti bearing steel, it can be seen that two groups of precipitates were found. The first group is consisted of coarse 100–200 nm Ti-rich (Ti, Nb) nitrides, as shown in the black arrow (a) in Fig. 10. The formation of these coarse particles may be likely that the coarse TiN particles precipitating in the process of previous casting solidification have not completely re-dissolved when the samples were heated to 1350°C and become the nucleation sites of precipitates containing Nb as the temperature deceases,19) so these larger Ti-rich (Ti, Nb) nitrides probably have been formed before the tensile deformation and fail to resolve in present test. Although these particles still exist in steel at lower test temperature, they have a smaller influence on the ductility due to their less number and larger size.1,4) Therefore, these kind of large particles are not further presented and discussed in paper at the lower test temperature. The second groups is consisted of fine cuboidal 15–20 nm Nb-rich (Ti, Nb) CN particles, as shown in the black arrow (b) in Fig. 10, the formation of these particles may be likely that TiN parties precipitat firstly and then become the nucleation sites of precipitates containing Nb when the deformation occurs.20) In addition, the formation of these particles may also be likely due to a combination of Nb(C, N) and Ti(C, N) which precipitate in the meantime in the process of deformation.21) However, these particles are rarely found in lower temperature range.

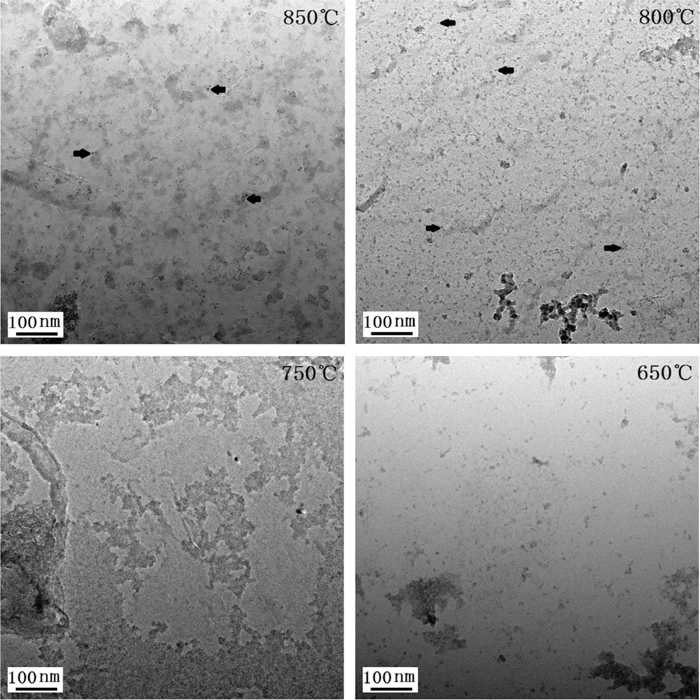
Figure 11 presents the distribution and composition of precipitates at 900°C of Nb–Ti bearing steel, it can be seen that the precipitates are mainly consisted of fine globular Nb carbides, and the average size of them is about 9 nm. There may be some Ti or N in the particles, but it is hard to be accurately detected because the size of the particles is so small. These tiny Nb carbides normally dynamically precipitate in the process of deformation and have a great influence on the property of steel.22) Figure 12 presents the TEM replica micrographs below 900°C of Nb–Ti bearing steel, it appears that the globular Nb carbides become more fine as the temperature decreases, as shown in the black arrows in Fig. 12, and the average size of them is only about 4 nm when the temperature down to 800°C. When the temperature further falls to below 800°C, the precipitates are so scarce that it is difficult to detect their existence under the condition of the present experimental observations.

The TEM replica micrographs at 950°C and 900°C of Ti bearing steel are shown in Fig. 13. It can be seen that the number of particles is small and the size of particles is large at 950°C, and the size of the particles decreases with the increase of the number with the temperature cooling to 900°C. The average diameter and the volume fraction of the particles at 950°C and 900°C are 15.4 nm and 11.5 nm, 0.14% and 0.43%, respectively. One would know that the Ti-bearing steel has the larger size and the smaller number of particles compared with the Nb–Ti bearing steel at the same temperature.
3.3.2. The Size and Distribution of Precipitates
Figure 14 presents the size and distribution of precipitates of Nb–Ti bearing steel as a function of temperature, and these results come from the statistics of precipitates in 20 fields near the fracture area, where the number of particles investigated on the whole at each temperature as shown in each picture in Fig. 14 and the minimum target particle size is 1 nm. It can be seen that the size of particles is relatively large at 950°C and become smaller with the temperature decreasing. The average diameter of the particles was determined through calculation of the size distribution and then the volume fraction of precipitates was calculated out as the average diameter was set into Eq. (1),23) the results as shown in Fig. 15. It is worth mentioning that the field pictures containing lots of particles were selected for better the statistics of the size distribution of particles, which would be likely to lead to a larger volume fraction of particles compared with Ti, Nb, C, N composition of steel, although some field pictures containing little or no particles are objective existence due to the as-cast organization which results in uneven precipitation of particles and smaller observation field of view. Figure 15 shows the average diameter and volume fraction of precipitates of Nb–Ti bearing steel as a function of temperature, and it is indicated that the average diameter of particles is relatively large at 950°C (9.2 nm as shown), although the volume fraction of precipitates is very small (only 0.28% as shown). The average diameter of particles decreases as the temperature decreases and reduces to only 3.9 nm at 800°C. Meanwhile, the volume fraction of precipitates gradually increases and reaches to 4.55%.
|
V
f
=[
1.4π
6
]×[
N
D
2
A
]
| (1) 23) |
Where D is the average diameter of particles, N is the number of precipitates and A is the area of field observed.
4. Discussion
It can be known that the precipitation temperature of grain boundary ferrite in Nb–Ti bearing steel is higher than Ti bearing steel through comparing Figs. 6 and 7, the precipitation of grain boundary ferrite has occurred at 950°C in Nb–Ti bearing steel, but very small amount of ferrite has precipitated until that the temperature drops to 900°C in Ti bearing steel. The results of TEM replicas shown that the size of particles in Ti bearing steel is lager and the number is smaller at 950°C, which cannot effectively suppress the occurrence of recrystallization and induce the precipitation of ferrite, as shown in Fig. 7. Although the size of the particles decreases and the rise in the number at 900°C, just a small amount of ferrite precipitates at grain boundaries. According to the above results, so it can be seen that the addition of Nb can induce the precipitation of grain boundary ferrite at higher temperature, which can lead to deterioration in ductility and the extension of ductility trough of steel to higher temperature. The effect of Nb on the precipitation of grain boundary ferrite and the ductility will be discussed in detailed.
4.1. Effect of Nb Precipitation Behavior on the Ferrite Transformation
In view of the occurrence of the ferrite transformation at temperatures above the Ae3 in Nb-bearing steel which is associated with the precipitation of Nb carbides and nitrides, and many authors have pointed out that Nb precipitation in austenite accelerates the ferrite transformation because they could act as potential nucleation sites of the precipitation of ferrite. However, the dissolved Nb atoms retards the strain induced ferrite transformation by the solute drag effect and the consumption of strain energy for the precipitation of NbC during deformation.5,14,24) The results of carbon extraction replica observed by using TEM are just the final precipitation morphology of particles when fracture occurs, however, understanding of the dynamic process of precipitation is still very important. The dynamic models of Dutta et al.27) and Pereloma et al.19) have been established for predicting the dynamic precipitation behavior of Nb in the process of deformation, which aim to indirectly clarify the effect of the strain-induced precipitation of Nb(C, N) on the formation of ferrite films, and the accuracy of these models mentioned above have got the good verification in their works. Therefore, these models combined with the present experimental conditions were used for investigating the precipitation fraction of Nb(C, N) in the process of tensile deformation. Figure 10 shows that these coarse Ti-rich (Ti, Nb) nitrides are a combination of a large number of Ti and N, and the fine cuboidal Nb-rich (Ti, Nb) CN particles are only found at 950°C. When the temperature down to below 950°C, the precipitates are mainly consisted of fine globular Nb carbides. Therefore, in present study the dynamic models of Dutta et al.27) and Pereloma et al.19) were used to mainly estimate the volume fraction of precipitates containing Nb that formed as a function of time, whereas Ti has just played a role in consuming C and N.
Firstly, the equilibrium starting temperature of NbCxN1–x precipitates was calculated by using the following equations proposed by Yong.25)
|
log
[
Nb
]⋅[ C ]
x
=2.96-7 510/T
| (2) 25) |
|
log
[
Nb
]⋅[ N ]
1-x
=3.70-10 800/T
| (3) 25) |
|
Nb-[
Nb
]
C-[ C ]
=
92.9064
x×12.011
| (4) 25) |
|
Nb-[
Nb
]
N-[ N ]
=
92.9064
(
1-x
)
×14.0067
| (5) 25) |
Where Nb, C, N is the composition of steel (0.025%, 0.16%, 0.0056%, respectively), [Nb], [C], [N] is the dissolved composition at a given temperature, and x denotes the site fraction of C in carbonitride. According to Eqs. (2), (3), (4), (5), the equilibrium temperature can be obtained, as 1418 K. Then the equilibrium constituent of TiCxN1–x at this temperature can be determined through the following equations proposed by Wang et al.:26)
|
log
[
Ti
]⋅[ C ]
x
=2.75-7 000/T
| (6) 26) |
|
log
[
Ti
]⋅[ N ]
1-x
=0.32-8 000/T
| (7) 26) |
|
Ti-[
Ti
]
C-[ C ]
=
47.867
x×12.011
| (8) 26) |
|
Ti-[
Ti
]
N-[ N ]
=
47.867
(
1-x
)
×14.0067
| (9) 26) |
Where Ti, C, N is the composition of steel (0.015%, 0.16%, 0.0056%, respectively), so according to Eqs. (6), (7), (8), (9), the dissolved compositions of [Ti], [C] and [N] at 1418 K are obtained, they are 0.0022%, 0.1598%, 0.0020%, respectively. Then according to Eqs. (2), (3), (4), (5) and [C], [N] which are the composition at 1418 K and the composition of Nb, the equilibrium dissolved composition of Nb, C, N at test temperatures are determined which are used to calculate the starting time of precipitates containing Nb. The estimation of the starting time of precipitates containing Nb at isothermal test temperature is based on the precipitation start model of Dutta and Sellars,27) as the following equation:
|
t
ps
=3×
10
-6
[
Nb
]
-1
ε
-1
Z
-0.5
exp[
270 000
RT
]×exp[
1.5×
10
10
T
3
(
lnK
s
2
)
]
| (10) 27) |
Where tps is the starting time of Nb precipitates at isothermal test temperature (time for 5% precipitation), Ks= ([Nb][C+12N/14])/102.26–6770/T,27) Z is the Zener-Hollomon parameter,27) [Nb], [C] and [N] are the equilibrium solution composition of Nb, C, N at test temperatures, respectively, ε is the strain during the tensile deformation and T is the test temperature (in K). It is worth mentioning that ε is not a constant during the tensile deformation, so the change of strain as a function of time must be taken into account. In the present experiment, the relation between strain and time is described as the following expression:
Where k is the slope obtained through the linear fit of strain and time of the experiment at different test temperatures, which means that the strain generated in a certain period of time divided by time, since the change of strain as a linear function of the time in the experiment. The value of k is 1.07627×10⁻⁴, 1.07565×10⁻⁴, 1.07578×10⁻⁴ and 1.07453× 10⁻⁴ at 950°C, 900°C, 850°C and 800°C, respectively. According to Eqs. (10) to (11), the tps is obtained, they are 1.40 s, 0.28 s, 2.75 s and 9.79 s at 950°C, 900°C, 850°C and 800°C, respectively.
The precipitation fraction of Nb at test temperature is determined using the following equation proposed by Pereloma et al.:19)
|
X=1-exp[
ln(
0.95
)
(
t
t
ps
)
n
]
| (12) |
Where X is the precipitation fraction of Nb, t is the precipitation starting time at the test temperatures and n is the Avrami exponent, here the value of n is 0.7 according to the work of Pereloma et al.19) The ln(0.95) factor appears because the precipitation starting time is the moment at which precipitation is 5% complete. The results were shown in Fig. 16.

Figure 16 presents the precipitation fraction of Nb as a function of time for Nb–Ti bearing steel, and the finish time is the moment occurring fracture at test temperature. It is shown that the precipitation of Nb is earliest and the rate of precipitation is fastest at 900°C, and the rate of precipitation becomes so faster after 5 s that the precipitation fraction increases to more than 90% after 100 s. While Nb starts to precipitate quickly from 20 s and 30 s at 950°C and 900°C, respectively, and both of the precipitation fraction increase to more than 80% after 400 s. However, the rate of precipitation of Nb begins to increase close to 80 s and the precipitation fraction is less than 50% even by the end of the tensile experiment at 850°C, so it is indicated that lots of Nb atoms are dissolved in the matrix.
According to the previous results, it can be seen that a certain amount of Nb is able to precipitate in the early time of deformation at 950°C, and further combining with the testing results of the TEM replica as shown in Fig. 15, it can be known that the average diameter of the particles is about 9 nm. These fine precipitates containing Nb accelerate the ferrite transformation because they could act as potential nucleation sites of the ferrite, and Fig. 8 shows that a certain number of ferrite films have formed at 950°C. With the temperature cooling to 900°C, a large number of Nb-bearing particles precipitate rapidly which promote more ferrite films to nucleate, meanwhile, the ferrite films formed earlier gradually grow up, so that the nonuniformity of ferrite films thickness becomes serious. However, when the temperature down to below Ae3, deformation induced ferrite transformation accelerates the growth of the ferrite and further raises the nonuniformity of ferrite films thickness.
4.2. Mechanism of the Hot Ductility Behavior
As shown in Figs.15 and 16, it is indicated that a certain number of fine 9 nm Nb-bearing particles precipitate at 950°C and they can act as nucleation sites of ferrite, which lead to the formation of a certain quantity of thin ferrite films. These thin ferrite films are likely to form firstly at the trident points of the γ boundaries where generate greater stress and lead to the formation of ductile voids, as shown in Fig. 17(a) where the arrow represents the tensile direction, which results in the rapidly decrease of R.A with the temperature cooling from 1000°C to 950°C. When the temperature down to 900°C, as shown in Fig. 16, a small number of Nb-bearing particles precipitate in the early time of the deformation and accelerate the formation of parts of the ferrite films around the grain boundary. Soon afterwards, a large number of Nb-bearing particles precipitate rapidly with the increase of deformation and promote the formation of the new ferrite films nucleation at the grain boundary. Meanwhile, the ferrite films formed earlier gradually grow up, so that the nonuniformity of ferrite films thickness becomes serious, which leads to the increase of strain concentration and further deterioration of the ductility. This changing trend continues until 850°C, and more wedge shaped cracks appear due to the increase of nonuniformity of ferrite films thickness, which could lead to the increase of local strain concentration, as shown in Fig. 17(b). It can be understood that the increase of the nonuniformity of ferrite films thickness plays a leading role in leading to the gradually decrease of the ductility with the temperature cooling in the range 950°C to 850°C, although the average thickness of ferrite films increases slowly with the temperature cooling in this temperature range, as shown in Figs. 8 and 9, which is favor of relieving the strain concentration and improving the ductility to some extent.

When the temperature falls to 800°C (below Ae3), ferrite transformation accelerates the growth of the ferrite films and further increases the nonuniformity of ferrite films thickness, what more, the extent of the increase of ferrite films average thickness is limited because of the drag of solution Nb atoms, so that all the factors mentioned above result in the appearance of the minimum value of R.A at 800°C. When the temperature down to close Ar3 (680°C), the occurrence of ferrite transformation on a big scale, so the increase of average thickness to a greater degree which greatly reduces the strain concentration of the γ grain boundaries, although the nonuniformity of ferrite films thickness still exists. Finally, the ductility starts to recover and increases to 50% when the temperature cools to 650°C.
5. Conclusions
(1) The value of R.A in Nb–Ti bearing ship plate steel decreases rapidly when the temperature down to 950°C from 1000°C. The ductility reduces slowly with the temperature cooling to 850°C, and the value of R.A to a minimum at 800°C which closes to Ae3. As the temperature further decreases, the ductility begins to recover.
(2) Through the quantitative investigation of the thickness of ferrite films, it can be seen that there has been a small number of fine ferrite films with the thickness distribution concentrating in the range of 1 to 4 μm at 950°C. As the temperature decreases, along with the increase of the average thickness of ferrite films and the nonuniformity of ferrite films thickness is also increased.
(3) There are mainly three groups of precipitates. The first group is consisted of coarse 100–200 nm Ti-rich (Ti, Nb) nitrides and the second group is the fine cuboidal 15–20 nm Nb-rich (Ti, Nb) CN parties, which appear mainly at 950°C, and the third group mostly includes fine globular Nb carbides with the average size of about 9 nm, which appear in all conditions. Moreover, the size of these particles reduces gradually along with the increase of volume fraction as the temperature decreases. When the temperature falls to below 750°C, the precipitates containing Nb become rare.
(4) The precipitation of a certain number of fine 9 nm Nb-bearing particles at 950°C accelerates the formation of a certain quantity of thin ferrite films, which leads to the rapid decrease of ductility compared with 1000°C. When the temperature down to 900°C, plenty of precipitates containing Nb lead to the growth of the ferrite films formed earlier time and generation of the new ferrite films, which results in the increase of nonuniformity of ferrite films thickness and the decrease of ductility. This changing trend continues to 850°C. With the temperature cooling to close Ae3, the ferrite transformation promotes the growth of the ferrite films and further increase of the nonuniformity of ferrite films thickness, which lead to the value of R.A to a minimum at 800°C. As the temperature further decreases, the thickness of the ferrite films increases obviously which results in the improvement of the ductility.
Acknowledgment
The authors would like to be grateful to the National Natural Science Fund (No.51374020) and every student in our lab for their assistance in the experiment.
References
- 1) B. Mintz, S. Yue and J. J. Jonas: Int. Mater. Rev., 36 (1991), 187.
- 2) B. Mintz: Ironmaking Steelmaking, 27 (2000), 343.
- 3) B. Mintz: ISIJ Int., 39 (1999), 833.
- 4) B. Mintz and D. N. Crowther: Int. Mater. Rev., 55 (2010), 168.
- 5) C. Ouchi and K. Matsumoto: Trans. Iron Steel Inst. Jpn., 22 (1982), 181.
- 6) K. I. Suzuki, S. Miyagawa, Y. Saito and K. Shiotani: ISIJ Int., 35 (1995), 34.
- 7) U. H. Lee, T. E. Park, K. S. Son, M. S. Kang, Y. M. Won, C. H. Yim, S. K. Lee, I. Kim and D. Kim: ISIJ Int., 50 (2010), 540.
- 8) Z. Mohamed: Mater. Sci. Eng. A, 326 (2002), 255.
- 9) A. S. Hamada and L. P. Karjalainen: Mater. Sci. Eng. A, 528 (2011), 1819.
- 10) F. Zarandi and S. Yue: ISIJ Int., 45 (2005), 686.
- 11) T. Revaux, P. Deprez, J. P. Bricout and J. Oudin: ISIJ Int., 34 (1994), 528.
- 12) K. M. Banks, A. Tuling and B. Mintz: Mater. Sci. Technol., 28 (2012), 536.
- 13) M. Vedani, D. Dellasega and A. Mannuccii: ISIJ Int., 49 (2009), 446.
- 14) C. M. Chimani and K. Mörwald: ISIJ Int., 39 (1999), 1194.
- 15) A. Cowley, R. Abushosha and B. Mintz: Mater. Sci. Technol., 14 (1998), 1145.
- 16) B. Mintz and A. Cowley: Mater. Sci. Technol., 22 (2006), 279.
- 17) X. Q. Yuan, Z. Y. Liu, S. H. Jiao, L. Q. Ma and G. D. Wand: ISIJ Int., 46 (2006), 579.
- 18) V. V. Basabe and J. J. Jonas: ISIJ Int., 50 (2010), 1185.
- 19) E. V. Pereloma, B. R. Crawford and P. D. Hodgson: Mater. Sci. Eng. A, 299 (2001), 27.
- 20) H. Luo, L. Pentti Karjalainen, D. A. Porter and H. M. Liimatainen: ISIJ Int., 42 (2002), 273.
- 21) S. Yuan and G. Liang: Mater Lett., 63 (2009), 2324.
- 22) D. N. Crowther, Z. Mohamed and B. Mintz: Metall. Mater. Trans. A, 18 (1987), 1929.
- 23) H. Ma and Y. Li: Mater. Sci. Eng., 20 (2002), 328.
- 24) E. Essadiqi and J. J. Jonas: Metall. Mater. Trans. A, 19 (1988), 417.
- 25) Q. Yong: Secondary Phases in Steels, Metallurgical Industry Press, Beijing, (2006), 361.
- 26) Z. Wang, Q. Yong, X. Sun, Z. Yang, Z. Li, C. Zhang and Y. Weng: ISIJ Int., 52 (2012), 1661.
- 27) B. Dutta and C. M. Sellars: Mater. Sci. Technol., 3 (1987), 197.