1. Introduction
High manganese steel with an austenitic single structure has a high strength with a superior resistance to erosion, making it popular as a high strength structural steel for engineering works, construction machinery, and rail crossings. Hadfield steel (Fe-13%Mn-1%C, mass%) is a typical high-Mn steel popular for its resistance to friction and impingement, and similar modified steels having a superior corrosion resistance and work hardening have also been developed.1,2,3) Research is ongoing for high-Mn steels to transfer their application to the automobile industry. Twinning-induced plasticity (TWIP) steel ((Fe-(15–30)%Mn-Al-Si)4,5) is a potential candidate as it can obtain high work hardening through the formation of deformation twins. However, these steels have not become widely used due to their low productivity and high alloy costs. In terms of saving natural resources, it is preferable to reduce the quantities of Mn used in steel production.
Based on these limitations, medium-Mn steel has become the focus as a next generation high strength structural steel. The medium-Mn steel consists of (3–7)%Mn and has an excellent balance of strength, elongation, and toughness through the transformation induced plasticity (TRIP) effect, which controls the austenite stability with optimized production processes.6,7,8,9) Thus the alloy element (Mn) quantity can be reduced compared to conventional high-Mn austenitic steel. Recently, research on 5%Mn steel has increased in Asian countries, and there is considerable work on improving the tensile properties9) and clarifying the phase transformation behavior.10)
However, when reducing the Mn content from high-Mn austenitic steel, the transformation to martensite occurs during cooling through an increased martensite start temperature (Ms temperature). Therefore, duplex structures such as (austenite + martensite) and (austenite + ferrite) are formed in medium-Mn steel. Indeed, recent studies have discussed how to best optimize the duplex structures to improve steel properties. If the austenitic single structure can be obtained in these medium-Mn alloys, then its favorable characteristics such as high work hardening, elongation, and non-magnetic properties can be applied for use in structural products. To achieve this degree of microstructural control, the alloy focus should be on C, with its considerable effect on austenite stability, while the other alloy components should be a secondary focus.
In this study, the range of chemical compositions that can obtain an austenitic single structure were defined for medium-Mn-C steels (5%Mn), and then their mechanical properties were investigated. As accessorial elements, Cr, Ni, and Mo were available to add to the steel for controlling the Ms temperature. Of these, Cr was selected to reduce the alloy cost, due to it being an abundant resource, and Fe-5%Mn-Cr-C austenitic steels were fabricated in this study.
3. Results and Discussion
3.1. Optimum Chemical Composition for Austenitic Single Structure in Medium-Mn Steel
In order to obtain an austenitic single structure steel at room temperature, the chemical composition must be optimized to produce a thermodynamically stable austenitic single structure at the solution-treatment temperature and to suppress the martensitic transformation during cooling. The martensitic transformation can be suppressed by lowering the Ms temperature to room temperature. Although the Ms temperature decreases with increasing Mn, Cr, and C, content, the addition of Cr and C promotes carbide formation, making it difficult to obtain the austenitic single structure at the solution-treated temperature. On the other hand, the addition of Mn is preferable in high C austenitic steels, as it does not significantly affect the carbide solubility. To fabricate the austenitic single structure in the medium-Mn range, the balance between Cr and C was optimized in this study for a minimum use of Mn.
The effects of Mn, Cr, and C on the solubility of carbide were calculated using the Thermo-Calc software as shown in Fig. 1, to clarify the maximum carbon content that could be used. The solubility of carbide (solid line) is the boundary between the (austenite + carbide) phase and the austenitic single phase, and the region below this line corresponds to the Mn–Cr composition where all of the added C should be in a solid solution. This figure reveals that the Mn content does not affect the carbide solubility; however, increasing the Cr content decreases carbide solubility, making it easier to precipitate.

For example, in the case of the Fe-5%Mn-10%Cr alloy, the maximum carbon content that can be added is approximately 0.6 mass%, and the final chemical composition should satisfy this requirement with a Mn–Cr balance to lower the Ms temperature to room temperature. In this study, a 5%Mn was selected and the balance between Cr and C was discussed. Figure 2 shows the equilibrium phase diagram of the Fe-5%Mn-4%Cr-C alloy at 1373 K. The broken line denotes the chemical composition where the Ms temperature is equal to room temperature (298 K). The Ms temperature was estimated with Eq. (1),11) which was established for low-alloy carbon bearing steels.
|
M
s
(
K
)
=722-317[
%C
]-11[
%Si
]-33[
%Mn
]
-28[
%Cr
]-11[
%Mo
]-17[
%Ni
]-11[
%W
]...
| (1) |
An austenitic single structure is expected to obtain for the chemical composition within the hatched area.
Figure 3 shows an example optical micrograph of the solution-treated small ingot specimens. The chemical compositions were Fe-5%Mn-4%Cr-(0.5, 0.8, 1.1, 1.4)%C; Fe-5%Mn-(8, 12)%Cr-0.5%C; and Fe-5%Mn-8%Cr-0.7%C. Although the austenitic single structure is expected for all of these steels, the steels with less than 0.7%C content display a martensitic structure as well as austenitic. The body-centered cubic (BCC) structure was also confirmed by the X-ray diffraction analysis, showing that
Eq. (1) does not apply to the chemical composition range used in this study. Based on the experimental data,
Fig. 2 was then modified to
Fig. 4.

From these results, the chemical composition range for obtaining an austenitic single structure was defined in medium-Mn steels by investigating various quantities of Mn, Cr, and C. In the case of higher Cr content, carbide can easily precipitate and it is difficult for the additional C to be in a solid solution. Additionally, the purpose of reducing elements within the alloy was not satisfied. On the other hand, in the case of lower Cr content, the amount of carbon required for the austenitic single structure is considerably higher, allowing carbide precipitation during cooling. In this study, a composition range of Fe-5%Mn-4%Cr-C was selected due to the carbide solubility and ability to reduce the elements in the alloy as much as possible.
3.2. Tensile Deformation Behavior and Deformation Substructure in the Fe-5%Mn-4%Cr-C Alloy
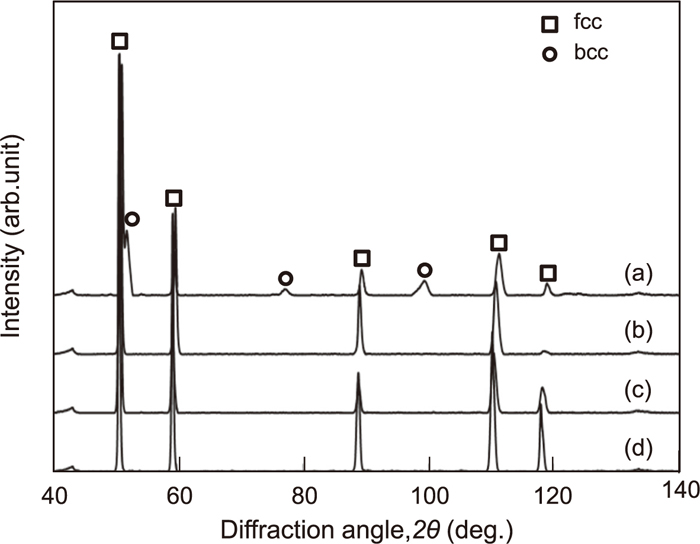
To produce steel plates for tensile testing, 10 kg ingots of the Fe-5%Mn-4%Cr-(0.5–1.2)%C (Table 2) were prepared, hot-rolled to size and underwent a solution treatment. It was confirmed that the solution-treated large ingot specimens exhibited similar microstructures to the small ingot specimens. The (martensite + austenite) structure was formed in the 0.5%C steel sample, and the austenitic single structure was obtained in the other specimens. In the 1.1%C and 1.2%C steels, a minimal amount of fine carbide was dispersed at the grain boundaries, due to the difference in the specimen size as shown in Fig. 5. As the specimen thickness was large compared to the samples in Fig. 3, the cooling rate decreased and carbide precipitates during the cooling. Figure 6 shows the X-ray diffraction patterns of these specimens, with the results corresponding to the optical micrographs. In the 0.5%C steel, the BCC diffraction peak as well as a face-centered cubic (FCC) peak (austenite) was detected, whereas only the austenite peak was detected for the (0.8–1.2)%C steels. The volume fraction of the BCC phase (martensite) was almost 30% for the 0.5%C steel. To estimate the Ms temperature, which relates to the austenite stability, a dilatation measurement was performed on the samples, with the results shown in Fig. 7. The Ms temperature of the 0.8%C steel was at 219 K, and it was below the measurement limit (173 K) for the 1.1%C and 1.2%C steels, indicating that the high carbon steels have a stabile austenite formation. Figure 8 shows the relationship between the measured hardness and the C content in these solution-treated specimens. The results of other austenitic steels with various quantities of C, Mn, Cr, and Ni are also indicated in this figure. The plot of the 0.5%C steel deviates considerably from the linear relationship of the austenitic steels (hatched band) due to the hard phase (martensite) formation. The results of the (0.8%–1.2%)C steels nearly align with the linear relationship obtained by previous researchers. Thus, the hardness of the C-bearing austenitic stable steels is predominately determined by the C content, while the effect of the other alloy elements is comparatively small.


Tensile tests were conducted on these specimens with varied austenite stability and hardness values, with the results shown in Fig. 9. The yield stress increased with increasing C content and the austenite is strengthened by the C solid solution. After the maximum yield stress, a high work hardening was obtained with a clear increase in the flow stress. However, all of the steels in this study fractured at an early strain stage, with a lower elongation and tensile strength than seen for conventional austenitic steels. This appears to be the result of grain coarsening during the solution treatment and carbide precipitation at the grain boundaries. These problems will be discussed in detail henceforth. At the uniform deformation stage, serrations occur; it has been known that dynamic strain aging4,12,13) and deformation twins14) affect this phenomenon. To clarify the mechanism of such deformation behavior, the relationship between the work hardening characteristics and the deformation substructure was investigated. The true stress-strain curve and work hardening rate were plotted in Fig. 10. All samples fractured at the early strain stage prior to the plastic instability. The work hardening rate was around 1500 MPa after a 0.05 strain stage, and this is dependent on the C content. In the 1.2%C steel, the work hardening rate was higher at the early strain stage and then decreased gradually with deformation. This is similar to the dislocation slipping mechanism trend seen in steel with a high stacking fault energy (SFE).15) In comparison, the work hardening rate did not decrease at the later strain stage in the 0.8%C and 1.2%C steels; this was especially true for the 0.8%C steel, where the work hardening rate increased with deformation. These phenomena confirmed the deformation-induced martensite15) and deformation twin4) mechanism in the metastable austenitic steels. To investigate the C content effect on the deformation substructure, a microstructural analysis was performed on the samples fractured by the tensile tests. Figure 11 shows the optical micrographs of the fractured samples. The samples were cut parallel to the longitudinal sample direction. There are numerous substructure streaks in all samples, which appear to be the deformation-induced martensite and deformation twins. Figure 12 shows the X-ray diffraction patterns obtained for regions near the fracture (the distance from the fracture face is less than 100 μm). The BCC diffraction peak was detected in the 0.8%C steel, indicating that the deformation-induced martensite was formed by the tensile deformation. In comparison, there were no BCC peaks in the 1.1%C and 1.2%C steels, illustrating that these steels have stable austenite and the austenitic single structure was maintained after deformation.
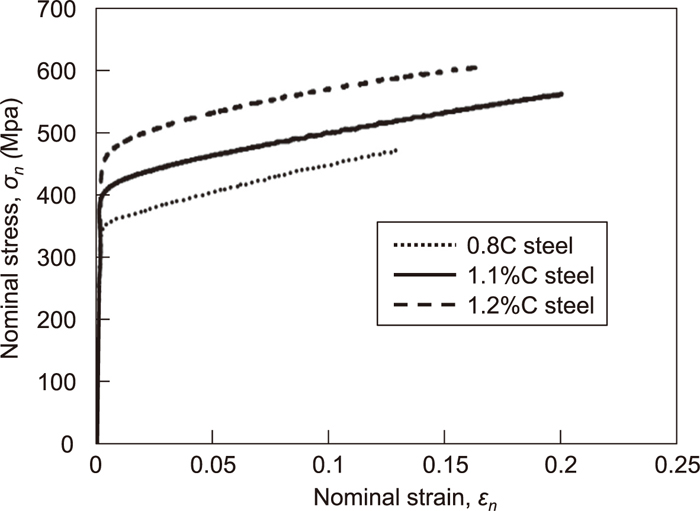


Figure 13 shows the crystallographic orientation image maps, with (a) as the FCC and BCC analyses and (b) as a selected BCC map in the 0.8%C steel. Based on these results, it is apparent that the streak substructure does not correspond to the BCC phase (the deformation-induced martensite) but rather to a deformation substructure in the matrix. The deformation-induced martensite corresponds to a randomly distributed plate-like substructure. The crystallographic orientation relationship between the matrix and the deformation-induced martensite satisfied the Kurdjumov-Sachs (K-S) relationship. In the 1.1%C and 1.2%C steels, the BCC phase was not detected. As shown in Fig. 14, the streak substructure was deformation twins, where the twin plane is {111} and the common axis of rotation is <110>. The frequency of deformation twin formation was tended to be decreased with increasing C content.

From these results, the work hardening mechanism can be summarized for the different samples. In the 0.8%C steel, both the deformation-induced martensite and the deformation twins affected the high work hardening rate. In the 1.1%C steel, the deformation twin formation dominated the deformation substructure. However, in the 1.2%C steel, these deformation substructures are hardly formed, so dislocation slipping is the primary mechanism. Therefore, the work hardening rate decreased gradually with deformation. Further investigation is needed on the dynamic strain aging effect. In this study, the dynamic strain aging contribution is nearly identical among the three samples, because the Mn and Cr content, which interact with the C atoms, is equal.
3.3. Work Hardening Characteristics of 5%Mn-4%Cr-C Steels
It is known that in general, the work hardening of austenitic steels depends on the SFE. Remy and Pineau16) indicated that the deformation substructure changes from a dislocation cell to ε martensite with decreasing SFE, leading to a work hardening rate increase. As for the Mn effect, it has been reported that the addition of 15% Mn resulted in a monotonously decreasing SFE.17) If the relationship between the Mn content and the SFE could be extrapolated to a lower Mn range, the 5%Mn steel could have a high SFE which is more than 30 mJ/m2. The effect of Cr on the SFE is smaller compared to other elements; Cr increases the SFE in some alloys, but decreases it in others.18) On the other hand, C has a strong effect on the SFE. If the equation suggested by Schramm and Reed19) could be applied, the addition of 1% C could increase the SFE to 410 mJ/m2. Considering these results, the Fe-5%Mn-4%Cr-C alloys in this study should have a high SFE and smaller work hardening than other austenitic steels. However, it has been noted that C promotes the formation of deformation twins or strengthens them,20) increasing the work hardening rate. It is also possible that the dynamic strain aging by the Mn–C clusters affects the work hardening behavior;12) however, thus far the exact mechanism has not yet been clarified.
The difference in the work hardening characteristics between the medium-Mn-C steels in this study and other austenitic steels were discussed in terms of their SFE. Olson and Cohen21) suggest using Eq. (2) to estimate the SFE as a function of the Gibbs free energy difference between the FCC phase and the hexagonal close-packed (HCP) phase (ΔGfcc→hcp).
|
SFE=2
ρ
A
(Δ
G
fcc→hcp
+
E
strain
)+2σ
| (2) |
The
ρA is the atom density of the {111} plane in austenite [mol/m
2], the E
strain is the elastic strain energy caused by the HCP formation from the FCC [J/mol], and
σ is the interface energy at the HCP/FCC boundary [J/m
2]. As the factors besides the
ΔG
fcc→hcp do not appear to change in similar alloys, if the
ΔG
fcc→hcp value is higher, then the FCC phase is more stable with a higher SFE.
Figure 15 shows the relationship between the C content and the
ΔG
fcc→hcp calculated by the Thermo-Calc software, and
Fig. 16 shows the relationship between the
ΔG
fcc→hcp and the work hardening rate at the 5% and 10% strain stages obtained by the tensile tests in the present study and various Fe–Mn–C austenitic steels.
22,23,24,25,26) With increasing C content, the
ΔG
fcc→hcp is increased, leading to a higher SFE. The work hardening decreases monotonously with increasing
ΔG
fcc→hcp. This indicates that the C contribution to the work hardening is not the result of the carbon itself but instead by the control of the SFE. The results of the Fe-5%Mn-4%Cr-C alloy in this study focus on the relationship obtained for previous results. Therefore, the medium-Mn-C steels have a similar work hardening characteristic to previous TWIP steels, in spite of having substantially different chemical compositions. The high SFE in the Fe-5%Mn-4%Cr-C alloys suppresses the formation of deformation twins and their work hardening is slightly lower than conventional austenitic steels.


