Abstract
By applying the chemical equilibrium method, the equilibrium between liquid iron and 2CaO∙SiO2-3CaO∙P2O5 solid solution has been measured with oxygen partial pressure of 5.22×10⁻¹² atm at 1823 K and 1.41×10⁻¹¹ atm or 4.25×10⁻¹⁰ atm at 1873 K. The phosphorus partition ratio between 2CaO∙SiO2-3CaO∙P2O5 solid solution and liquid iron was observed. The activity of P2O5 relative to hypothetical pure liquid P2O5 was determined from the phosphorus content in liquid iron and the reported thermodynamic data. The activity of P2O5 in 2CaO∙SiO2-3CaO∙P2O5 solid solution increased with the increase of 3CaO∙P2O5 content in solid solution. The activity coefficient of P2O5 in 2CaO∙SiO2-3CaO∙P2O5 solid solution also increased with the increase of 3CaO∙P2O5 content in solid solution.
1. Introduction
Generally speaking phosphorus is a harmful element for steel. It could cause embrittlement.1,2,3) In order to meet the requirement of high quality steel, phosphorus should be removed as much as possible. The CaO–SiO2–FeOx slag system is commonly used for BOF process, and usually extra CaO is added to remove phosphorus from molten hot metal and steel. Due to the unreacted CaO, the BOF slag is difficult to be reused meanwhile the amount of slag increases. Although fluorite could enhance CaO dissolution into slag, use of fluorite is restricted due to its toxicity for human and environment.
Recently, multi-phase fluxes are adopted in the hot metal dephosphorization process, in which di-calcium silicate and tri-calcium phosphate could form a solid solution over a wide composition range at the steelmaking temperature range as reported by Fix et al.4) Suito and Inoue5) confirmed the existence of 2CaO·SiO2-3CaO·P2O5 solid solution during the reaction between solid CaO and CaO–FetO–P2O5(–SiO2) slag. The 2CaO·SiO2-3CaO·P2O5 solid solution was found between the solid CaO and CaO–FetO–P2O5(–SiO2) slag. They also studied the phosphorous transfer behavior from CaO–FetO–P2O5(–SiO2) slag to 2CaO·SiO2 particles6) and the phosphorous partition between 2CaO·SiO2 particles and CaO–SiO2–FetO slag with the similar experimental method.7) Kitamura et al.8) studied the mass transfer of P2O5 between CaO–SiO2–FeO–P2O5 slag and 2CaO·SiO2-3CaO·P2O5 solid solution by immersing 2CaO·SiO2 or 3CaO·P2O5 rod into CaO–SiO2–FeO–P2O5 slag for various reaction duration. Pahlevani et al.9) estimated the activity coefficient of P2O5 in 2CaO·SiO2-3CaO·P2O5 solid solution by applying the regular solution model and chemical equilibrium method. For the reaction mechanisms between solid CaO or 2CaO·SiO2 and CaO–SiO2–FeOx–P2O5 slag, Fukagai et al.10) and Hamano et al.11) studied the reaction mechanisms between solid CaO and CaO–SiO2–FeOx–P2O5 slag, and Yang et al.12,13,14,15) studied the reaction mechanisms between 2CaO·SiO2 and molten CaO–SiO2–FeOx–P2O5 slag with the similar experimental method like Suito and Inoue’s experiments. Gao et al.16,17,18) studied the phase relationship of the CaO-SiO2-FeO-5 mass% P2O5 system by applying the chemical equilibrium method similar to the study reported by Pahlevani et al. Takeshita et al.19) measured the free energies of the formation of 2CaO·SiO2-3CaO·P2O5 solid solution by applying the gas equilibrium technique. Hasegawa et al.20) estimated the thermodynamic properties of 2CaO·SiO2-3CaO·P2O5 solid solution by applying chemical equilibrium method and phase relationship.
For estimating the activity of P2O5 in 2CaO·SiO2-3CaO·P2O5 solid solution by Pahlevani et al.,9) the regular solution model was adopted. However, other components such as FeO, MgO, Al2O3 etc. were contained in the 2CaO·SiO2-3CaO·P2O5 solid solution. In the study by Hasegawa et al.,20) the metal phase was Cu base rather than Fe base and the activities of P2O5 in some compositions were deduced by the measured activities of P2O5 of other compositions by applying the phase relationship and the appropriate simplification for calculation. In order to eliminate the deviation caused by applying the regular solution model and the appropriate simplification for calculating the activity of P2O5, in current research by conducting the equilibration between molten iron and 2CaO·SiO2-3CaO·P2O5 solid solution at 1823 and 1873 K, the activity of P2O5 was measured directly.
2. Experimental
A chemical equilibrium method was adopted in the present study, in which 2CaO·SiO2-3CaO·P2O5 solid solution was equilibrated with molten iron and the activity of P2O5 relative to hypothetical liquid P2O5 was observed. Reaction (1) was used to obtain the activity of P2O5.
|
P
2
O
5
(
l
)
=2
P
_
(
mass%
)
+5
O
_
(
mass%
)
| (1) |
|
Δ
G
1
°=832 384-632.65T J/mol
| (2) 21) |
|
K
1
=
f
P
2
[
mass%P
]
2
f
O
5
[
mass%O
]
5
a
P
2
O
5
| (3) |
and
fO are the activity coefficients of phosphorus and oxygen in liquid iron relative to 1 mass%, respectively, and
a
P
2
O
5
is the activity of P
2O
5 relative to hypothetical pure liquid P
2O
5.
T is absolute temperature. The values of
fP and
fO could be estimated by using the interaction parameters in liquid iron, respectively. In the present experiment, liquid Fe–P–C alloy was equilibrated with 2CaO·SiO
2-3CaO·P
2O
5 solid solution pellet in an MgO crucible, and the oxygen partial pressure was controlled by CO–CO
2 gas atmosphere according to reaction (4).
|
CO(
g
)
+
1
2
O
2
(
g
)
=
CO
2
(
g
)
| (4) |
|
Δ
G
4
°=-281 000+85.23T J/mol
| (5) 22) |
The 2CaO·SiO2-3CaO·P2O5 solid solution pellet was prepared by sintering the mixture of the reagent grade SiO2, CaHPO4·2H2O and CaO obtained by the calcination of reagent grade CaCO3 with various ratios. Firstly the mixture of raw materials was charged into a Pt crucible and put in a resistance furnace for 24 hours at 1873 K in air. The sample quenched with Ar gas flow was ground into fine powder. The powder was charged into a Pt crucible and put in a resistance furnace for 24 hours at 1873 K again. The ground sample was obtained. About 1.5 g of fine powder was charged into an alloy steel mold and pressed into a pellet shape at 50 MPa. For some samples the pellets were heated for another 24 hours at 1873 K. The formation of each solid solution was confirmed by XRD and after sintering for 24 hours for twice at 1873 K the 2CaO·SiO2-3CaO·P2O5 solid solution was detected and the CaO, SiO2 and P2O5 was not detected as shown in Fig. 1.

A vertical resistance furnace with an Al2O3 tube (outer diameter: 60 mm, inner diameter: 50 mm, length: 1000 mm) was used. Temperature was controlled at 1823 K ± 1 K or 1873 K ± 1 K by a thermocouple placed at the bottom of the MgO crucible. The partial pressure of oxygen was controlled by CO–CO2 gas according to reaction (4). The CO/CO2 ratio was 110/1 (PO2=5.22×10⁻¹² atm at 1823 K or 1.41×10⁻¹¹ atm at 1873 K) with the total flow rate of 366 mL/min or 20/1 (PO2=4.25×10⁻¹⁰ atm at 1873 K) with the total flow rate of 347 mL/min. The CO/CO2 ratio was 20/1 in order to obtain a suitable content of P after reaction for the experiments with the large 3CaO·P2O5 content tablet at 1873 K and the CO/CO2 ratio was 110/1 for the other experiments. About 10 g electrolytic iron was equilibrated with about 1.5 g synthesized pellet in an MgO crucible at 1823 or 1873 K. As explained in section 3, the equilibrium duration of 24 hours was adopted to ensure equilibrium for various compositions of solid solution. After the equilibrium was established, the crucible was taken out from the furnace and quenched in Ar flow. Phosphorus content in iron was analyzed by the molybdenum-blue spectrophotometric solvent extraction method or the phosphomolybdate blue spectrophotometric method depending on the content of P in iron. Phosphorus content in solid solution was analyzed by the phosphomolybdate blue spectrophotometric method. ICP-OES was adopted for the analysis of Ca, Mg and Fe. Gravimetry was used for SiO2 in solid solution. Table 1 shows the initial composition of solid solution, temperature, the ratio between CO and CO2 gases and the initial content of phosphorus in iron. Figure 2 shows the projection of the initial compositions of solid solution on the CaO–SiO2–P2O5 ternary phase diagram near the CaO corner.
Table 1. Experimental conditions and initial compositions of solid solutions.
| No. | T/K | CO/CO2 | P in iron/
mass% | Solid solution |
|---|
CaO/
mass% | SiO2/
mass% | P2O5/
mass% | 3CaO·P2O5/
mass% |
|---|
| 1 | 1823 | 110/1 | 0.0003 | 64.7 | 33.5 | 1.8 | 4.0 |
| 2 | 1823 | 110/1 | 0.0003 | 64.2 | 32.1 | 3.7 | 8.0 |
| 3 | 1823 | 110/1 | 0.0003 | 63.8 | 30.7 | 5.5 | 12.0 |
| 4 | 1823 | 110/1 | 0.0003 | 62.9 | 27.9 | 9.2 | 20.0 |
| 5 | 1823 | 110/1 | 0.0003 | 61.9 | 24.4 | 13.7 | 30.0 |
| 6 | 1823 | 110/1 | 0.0003 | 60.8 | 20.9 | 18.3 | 40.0 |
| 7 | 1823 | 110/1 | 0.0003 | 60.0 | 18.6 | 21.4 | 46.7 |
| 8 | 1823 | 110/1 | 0.0003 | 59.0 | 15.2 | 25.8 | 56.5 |
| 9 | 1823 | 110/1 | 0.0003 | 57.9 | 11.9 | 30.2 | 66.0 |
| 10 | 1823 | 110/1 | 0.0003 | 57.0 | 8.7 | 34.3 | 75.0 |
| 11 | 1823 | 110/1 | 0.0003 | 55.9 | 5.2 | 38.9 | 85.0 |
| 12 | 1823 | 110/1 | 0.0003 | 54.8 | 1.7 | 43.5 | 95.0 |
| 13 | 1823 | 110/1 | 0.0003 | 54.2 | 0.0 | 45.8 | 100.0 |
| 14 | 1873 | 110/1 | 0.0077 | 64.2 | 32.1 | 3.7 | 8.0 |
| 15 | 1873 | 110/1 | 0.0268 | 62.9 | 27.9 | 9.2 | 20.0 |
| 16 | 1873 | 110/1 | 0.0393 | 61.9 | 24.4 | 13.7 | 30.0 |
| 17 | 1873 | 110/1 | 0.0551 | 60.8 | 20.9 | 18.3 | 40.0 |
| 18 | 1873 | 110/1 | 0.5304 | 59.7 | 17.4 | 22.9 | 50.0 |
| 19 | 1873 | 110/1 | 1.0736 | 58.6 | 13.9 | 27.5 | 60.0 |
| 20 | 1873 | 100/5 | 0.1785 | 57.5 | 10.5 | 32.0 | 70.0 |
| 21 | 1873 | 100/5 | 0.6773 | 56.4 | 7.0 | 36.6 | 80.0 |
| 22 | 1873 | 100/5 | 1.6298 | 55.3 | 3.5 | 41.2 | 90.0 |
| 23 | 1873 | 100/5 | 3.7796 | 54.2 | 0.0 | 45.8 | 100.0 |
3. Results and Discussion
According to Fig. 3, for the 60mass%2CaO·SiO2-40mass%3CaO·P2O5 solid solution at 1823 K and the 92mass%2CaO·SiO2-8mass%3CaO·P2O5 solid solution at 1873 K, the equilibrium was attained within 12 hours. For the 3CaO·P2O5 at 1873 K, the equilibrium was attained within 24 hours. Finally 24 hours was adopted for the subsequent experiments in order to ensure equilibrium for various compositions of solid solution.

The results of the chemical analysis of the solid solution and the content of P in iron were presented in Table 2. The content of iron oxide was calculated as FeO. Due to the inevitable analytical error, the total mass percent of solid solution was not 100% but near to 100%. Powder of 2CaO·SiO2-3CaO·P2O5 solid solution was contaminated with more or less MgO and metallic Fe particles, which would be the reason of larger MgO and FeO contents in some solid solutions. After normalizing the contents of CaO, SiO2 and P2O5, the normalized compositions were projected on the CaO–SiO2–P2O5 phase diagram near to CaO corner which were shown in Fig. 4. In Fig. 4(A), the compositions after reaction diverged from the initial compositions more or less, and some compositions moved to the CaO corner or away from CaO corner. The materials after reaction were tested by XRD as shown in Fig. 5, and the CaO, SiO2, P2O5 or other phases were not detected, which means the 2CaO·SiO2-3CaO·P2O5 solid solution has certain solubility for the other component in the composition range of current research. In Fig. 4(B), although the compositions after reaction diverged from the initial compositions as shown in Fig. 4(A), the compositions were still solid phase after reaction and no liquid phase was observed for all the samples.
Table 2. The composition of solid solution and the content of P in metal phase after experiments.
| No. | Solid solution/mass% | P in iron/
mass% |
|---|
| P2O5 | SiO2 | CaO | MgO | FeO | Total |
|---|
| 1 | 1.83 | 32.8 | 67.1 | 0.566 | 0.216 | 102.5 | 0.00276 |
| 2 | 3.59 | 31.3 | 60.6 | 0.589 | 0.354 | 96.4 | 0.00282 |
| 3 | 5.44 | 29.6 | 64.5 | 0.721 | 0.351 | 100.6 | 0.00501 |
| 4 | 9.18 | 27.3 | 60.7 | 0.502 | 0.299 | 98.0 | 0.0081 |
| 5 | 13.6 | 23.9 | 59.8 | 0.383 | 0.489 | 98.2 | 0.0059 |
| 6 | 18.2 | 19.7 | 63.1 | 0.397 | 0.268 | 101.7 | 0.0124 |
| 7 | 21.8 | 18.9 | 60.8 | 0.476 | 0.231 | 102.2 | 0.0175 |
| 8 | 25.5 | 14.8 | 56.7 | 0.398 | 0.328 | 97.7 | 0.0238 |
| 9 | 30.2 | 11.5 | 59.2 | 0.273 | 0.286 | 101.5 | 0.0178 |
| 10 | 31.9 | 8.82 | 57.1 | 0.811 | 0.697 | 99.3 | 0.111 |
| 11 | 37.2 | 5.16 | 57.3 | 0.353 | 2.32 | 102.3 | 0.128 |
| 12 | 43.4 | 1.72 | 57.2 | 0.294 | 0.436 | 103.1 | 0.150 |
| 13 | 45.8 | 0.00 | 56.4 | 0.266 | 0.467 | 102.9 | 0.221 |
| 14 | 3.47 | 29.5 | 61.1 | 4.28 | 0.174 | 98.5 | 0.0201 |
| 15 | 8.60 | 25.1 | 58.0 | 4.19 | 0.331 | 96.2 | 0.0498 |
| 16 | 12.1 | 22.0 | 56.9 | 5.66 | 0.575 | 97.2 | 0.109 |
| 17 | 16.8 | 19.7 | 57.9 | 3.67 | 0.317 | 98.4 | 0.261 |
| 18 | 21.6 | 16.7 | 57.4 | 2.72 | 0.261 | 98.7 | 0.661 |
| 19 | 25.3 | 12.5 | 56.6 | 2.86 | 0.319 | 97.6 | 1.26 |
| 20 | 31.8 | 10.8 | 55.3 | 0.510 | 0.209 | 98.6 | 0.127 |
| 21 | 36.3 | 7.18 | 53.6 | 0.626 | 0.276 | 98.0 | 0.557 |
| 22 | 41.9 | 3.49 | 52.7 | 0.850 | 0.704 | 99.6 | 1.49 |
| 23 | 46.5 | 0.00 | 51.5 | 1.10 | 0.319 | 99.4 | 3.52 |

In the present study, the partial pressure of oxygen was controlled by the ratio of CO and CO2. Because of the segregation of C and O in a solidified iron sample resulting in the possible formation of CO gas bubbles and the inevitable analytical error, the analyzed concentrations of C and O were not stable. Therefore, the concentrations of C and O in iron after reaction were calculated according to reactions (6) and (8) and the reported interaction coefficients shown in Table 3. The segregation of P does not influence the analyzed concentration of P in iron from the current analytical method.
|
O
_
(
mass%
)
+CO(
g
)
=
CO
2
(
g
)
| (6) |
|
Δ
G
6
°=-166 900+91.16 T J/mol
| (7) 25) |
|
C
_
(
mass%
)
+
CO
2
(
g
)
=2CO(
g
)
| (8) |
|
Δ
G
8
°=144 700-129.5T J/mol
| (9) 25) |
Table 3. The reference data about interaction coefficient.
Figure 6 shows the relationship between the equilibrium content of P in iron and the 3CaO·P2O5 content in solid solution. The contents of 3CaO·P2O5 in solid solution were calculated from the analyzed content P2O5 and the normalized compositions were shown in Table 4. The content of P in iron increased with the increase of the 3CaO·P2O5 content in solid solution. And for a constant composition of solid solution, equilibrium content of P in iron increased with the increase of temperature from 1823 K to 1873 K. At 1873 K, when the ratio between CO/CO2 changed from 110/1 to 20/1, the equilibrium content of P in iron decreased.
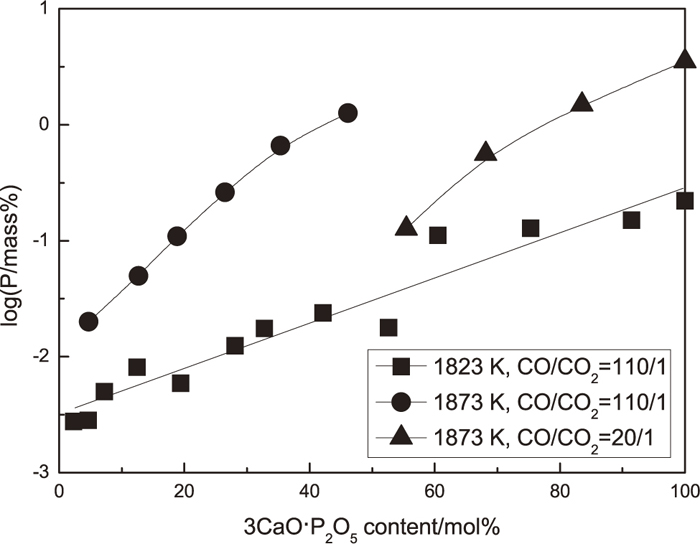
Table 4. The normalized compositions of solid solution calculated from P
2O
5 and SiO
2 content by assuming 2CaO·SiO
2-3CaO·P
2O
5, phosphorus partition ratios between 2CaO·SiO
2-3CaO·P
2O
5 solid solution and liquid iron, and the activity and the activity coefficient of P
2O
5 in 2CaO·SiO
2-3CaO·P
2O
5 solid solution.
| No. | 3CaO·P2O5/mol% |
(
mass%P
)
[
mass%P
]
|
a
P
2
O
5
|
γ
P
2
O
5
|
|---|
| 1 | 2.3 | 2.84×10² | 2.74×10⁻²⁵ | 3.73×10⁻²³ |
| 2 | 4.6 | 5.82×10² | 2.86×10⁻²⁵ | 1.84×10⁻²³ |
| 3 | 7.2 | 4.76×10² | 9.06×10⁻²⁵ | 3.97×10⁻²³ |
| 4 | 12.5 | 5.1×10² | 2.4×10⁻²⁴ | 5.9×10⁻²³ |
| 5 | 19.4 | 1.0×10³ | 1.3×10⁻²⁴ | 2.0×10⁻²³ |
| 6 | 28.1 | 6.35×10² | 5.59×10⁻²⁴ | 6.90×10⁻²³ |
| 7 | 32.8 | 5.36×10² | 1.12×10⁻²³ | 1.13×10⁻²² |
| 8 | 42.2 | 4.82×10² | 2.09×10⁻²³ | 1.67×10⁻²² |
| 9 | 52.6 | 7.34×10² | 1.16×10⁻²³ | 7.95×10⁻²³ |
| 10 | 60.5 | 1.28×10² | 4.97×10⁻²² | 3.07×10⁻²¹ |
| 11 | 75.3 | 1.27×10² | 6.73×10⁻²² | 3.52×10⁻²¹ |
| 12 | 91.4 | 1.23×10² | 9.46×10⁻²² | 4.19×10⁻²¹ |
| 13 | 100.0 | 8.85×101 | 2.21×10⁻²¹ | 9.11×10⁻²¹ |
| 14 | 4.7 | 8.01×101 | 1.45×10⁻²³ | 9.55×10⁻²² |
| 15 | 12.7 | 8.22×101 | 9.21×10⁻²³ | 2.30×10⁻²¹ |
| 16 | 18.9 | 5.33×101 | 4.70×10⁻²² | 8.08×10⁻²¹ |
| 17 | 26.5 | 2.99×101 | 3.16×10⁻²¹ | 3.95×10⁻²⁰ |
| 18 | 35.4 | 1.49×101 | 3.09×10⁻²⁰ | 2.95×10⁻¹⁹ |
| 19 | 46.1 | 9.29 | 2.11×10⁻¹⁹ | 1.65×10⁻¹⁸ |
| 20 | 55.5 | 1.12×10² | 3.10×10⁻¹⁸ | 1.92×10⁻¹⁷ |
| 21 | 68.2 | 2.93×101 | 9.38×10⁻¹⁷ | 4.88×10⁻¹⁶ |
| 22 | 83.6 | 1.25×101 | 1.79×10⁻¹⁵ | 7.87×10⁻¹⁵ |
| 23 | 100.0 | 5.89 | 8.53×10⁻¹⁴ | 3.24×10⁻¹³ |
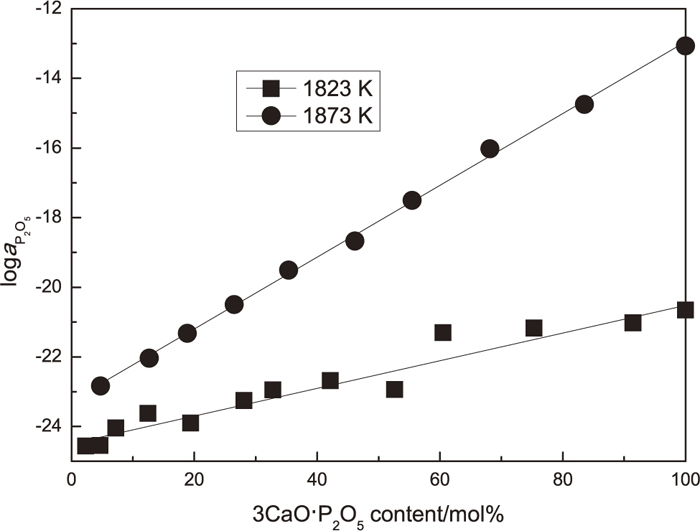
The activity of P2O5 calculated by reaction (1) and interaction coefficients shown in Table 3 were shown in Table 4. Figure 7 shows the relationship between the activity of P2O5 relative to hypothetical pure liquid P2O5 in solid solution and the 3CaO·P2O5 content in solid solution. The activity of P2O5 increased with the increase of the 3CaO·P2O5 content in solid solution at both 1823 and 1873 K. The activity of P2O5 at 1873 K is larger than that at 1823 K.
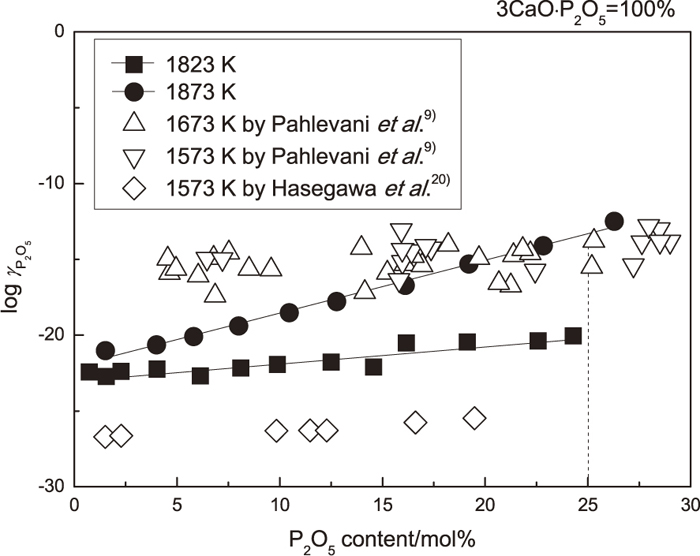
3.3. The Activity Coefficient of P2O5 in 2CaO·SiO2-3CaO·P2O5 Solid Solution
Pahlevani et al.9) studied the activity coefficient of P2O5 in 2CaO·SiO2-3CaO·P2O5 solid solution by conducting the slag and solid solution equilibrium and applying the regular solution model. Figure 8 shows the activity coefficient of P2O5 in solid solution measured in the present study compared with those reported by Pahlevani et al. and Hasegawa et al. In Fig. 8, the dashed line means the pure 3CaO·P2O5 whose mole percent of P2O5 is 25%. Due to the analytical error, P2O5 contents for some samples were beyond 25 mol%. The activity coefficient of P2O5 in large 3CaO·P2O5 content region increased from about 10−20 to 10−12 when the temperature increased from 1823 K to 1873 K. At both temperatures, the activity coefficient of P2O5 increased with the increase of P2O5 content in solid solution. On the contrary, Pahlevani et al. reported that the activity coefficient of P2O5 measured at 1673 and 1573 K showed no obvious difference. The activity coefficient of P2O5 in solid solution was in the range between 10−17 and 10−13. There was no clear relationship between the activity coefficient of P2O5 and the content of P2O5 in solid solution. Comparing with the values reported by Pahlevani et al., the current values of the activity coefficient of P2O5 were smaller. Besides, the activity coefficient of P2O5 measured at 1573 K by Hasegawa et al. increased with the increase of P2O5 content in solid solution and the current values were larger than those because of the higher temperature.
4. Conclusions
By applying chemical equilibrium method, the equilibrium between liquid iron and 2CaO·SiO2-3CaO·P2O5 solid solution pellet has been measured at 1823 and 1873 K with the oxygen partial pressure of 5.22×10⁻¹², 1.41×10⁻¹¹ or 4.25×10⁻¹⁰ atm. The equilibrium P content in iron increased with the increase of the 3CaO·P2O5 content in solid solution. The phosphorus partition ratios between 2CaO·SiO2-3CaO·P2O5 solid solution and liquid iron decreased with the increase of the 3CaO·P2O5 content in solid solution. The activity of P2O5 relative to hypothetical pure liquid in 2CaO·SiO2-3CaO·P2O5 solid solution changed from 2.74×10⁻²⁵ to 2.21×10⁻²¹ at 1823 K and from 1.45×10⁻²³ to 8.53×10⁻¹⁴ at 1873 K with the increase of the 3CaO·P2O5 content in solid solution. The activity coefficient of P2O5 in 2CaO·SiO2-3CaO·P2O5 solid solution was also calculated.
Acknowledgment
This research was partially supported by Steel Foundation for Environmental Protection Technology. Authors greatly appreciate the financial support.
References
- 1) C. L. Briant and S. K. Banerji: Metall. Trans. A, 10A (1979), 123.
- 2) R. Viswanathan: Metall. Trans., 2 (1971), 809.
- 3) C. L. Briant and R. P. Messmer: Acta Metall., 30 (1982), 1811.
- 4) W. Fix, H. Heymann and R. Heinke: J. Am. Ceram. Soc., 52 (1969), 346.
- 5) H. Suito and R. Inoue: ISIJ Int., 46 (2006), 180.
- 6) R. Inoue and H. Suito: ISIJ Int., 46 (2006), 188.
- 7) R. Inoue and H. Suito: ISIJ Int., 46 (2006), 174.
- 8) S. Kitamura, S. Saito, K. Utagawa, H. Shibata and D. G. C. Robertson: ISIJ Int., 49 (2009), 1838.
- 9) F. Pahlevani, S. Kitamura, H. Shibata and N. Maruoka: ISIJ Int., 50 (2010), 822.
- 10) S. Fukagai, T. Hamano and F. Tsukihashi: ISIJ Int., 47 (2007), 187.
- 11) T. Hamano, S. Fukagai and F. Tsukihashi: ISIJ Int., 46 (2006), 490.
- 12) X. Yang, H. Matsuura and F. Tsukihashi: ISIJ Int., 50 (2010), 702.
- 13) X. Yang, H. Matsuura and F. Tsukihashi: Mater. Trans., 51 (2010), 1094.
- 14) X. Yang, H. Matsuura and F. Tsukihashi: ISIJ Int., 49 (2009), 1298.
- 15) X. Yang, H. Matsuura and F. Tsukihashi: Tetsu-to-Hagané, 95 (2009), 268.
- 16) X. Gao, H. Matsuura, I. Sohn, W. Wang, D. J. Min and F. Tsukihashi: Metall. Mater. Trans. B, 43B (2012), 694.
- 17) X. Gao, H. Matsuura, I. Sohn, W. Wang, D. J. Min and F. Tsukihashi: Mater. Trans., 54 (2013), 544.
- 18) X. Gao, H. Matsuura, M. Miyata and F. Tsukihashi: ISIJ Int., 53 (2013), 1381.
- 19) H. Takeshita, M. Hasegawa, Y. Kashiwaya and M. Iwase: Steel Res. Int., 81 (2010), 100.
- 20) M. Hasegawa, Y. Kashiwaya and M. Iwase: High Temp. Mater. Process., 31 (2012), 421.
- 21) E. T. Turkdogan: ISIJ Int., 40 (2000), 964.
- 22) E. T. Turkdogan: Physical Chemistry of High Temperature Technology, Academic Press, New York, (1980), 7.
- 23) W. Gutt: Nature, 197 (1963), 142.
- 24) E.-J. Drewes and M. Olette: Arch. Eisenhüttenwes., 38 (1967), 163.
- 25) S. Ban-ya and S. Matoba: Tetsu-to-Hagané, 48 (1962), 925.
- 26) K. Yamada and E. Kato: Tetsu-to-Hagané, 65 (1979), 264.
- 27) H. G. Hadrys, M. G. Frohberg and J. F. Elliott: Metall. Trans., 1 (1970), 1867.
- 28) D. Dutilloy and J. Chipman: Trans. Metall. Soc. AIME, 218 (1960), 428.
- 29) H. Sakao and K. Sano: J. Jpn. Inst. Met., 23 (1959), 671.