Regular Article
Delta Phase Characterization in Inconel 718 Alloys Through X-ray Diffraction
2015 Volume 55 Issue 11 Pages 2450-2454

Details
2015 Volume 55 Issue 11 Pages 2450-2454
One of the main issues of concern regarding the quality control of Inconel alloys is the precipitation of δ-phase, which in certain quantities and morphologies can lead to a loss in fracture toughness; it is therefore important to be able to properly detect and quantify it. X-ray diffraction (XRD) is a well-established and widely used technique for qualitative and quantitative analysis; however, the quality of its results depends on prior knowledge of the exact structure of each phase. The information on δ-phase available in the literature is incomplete and several discrepancies exist among different publications; furthermore, doubts persist regarding the interaction of δ and γ’’ phases. The aim of this work is to evaluate the structure of δ-phase in Inconel 718 alloys. This was achieved through a combination of experimental results, obtained for samples of the alloy that were subjected to three different heat treatments in order to produce different concentrations of δ-phase, and comparison of these with simulated results. This methodology allowed a global view of the mechanics of phase transformations in the alloy and to the correct identification of diffraction lines for δ-phase.
Nickel superalloys are used extensively in the oil and gas, chemical, nuclear and aerospace industries.1) Among these, Inconel 718 is especially interesting due to its excellent corrosion resistance and good mechanical properties.2) Its mechanical resistance is given by precipitation of coherent and semi-coherent γ’ and γ”-phases in its austenitic matrix, the latter having a significant effect on the hardening process.3) δ-phase precipitates may also occur; some improvement in mechanical properties at low quantities of this phase was seen in,4) whereas other authors show a decrease in ductility and an increase in high temperature cracking as its concentration increases and its morphology becomes plate-like.5) However, the main effect caused by its precipitation is the consumption of γ”-phase precipitates since both phases compete for the niobium content of the alloy.1) This leads to a significant loss of mechanical resistance. Hence, an important issue is the correct quantification of the δ-phase content in the alloy and X-ray diffraction (XRD) is a common technique for such analysis (especially as a reference for the development of standards for calibration of other techniques6)). However, many doubts persist regarding the correct analysis of the alloy with this method.5) This is mainly due to the difficulty in identifying and separating the diffraction lines of γ’, γ”, and δ-phases in the resulting diffractograms. This has led to many inconsistencies among different authors and to a lack of literature in which robust phase quantification is achieved. A summary of information found in the literature is shown in Table 1.
| Phase | Space Group | Lattice parameter range2) | Wyckoff positions | |||||
|---|---|---|---|---|---|---|---|---|
| Element | Notation | X | Y | Z | Sof* | |||
| NbC7) | 225 - Fm-3m | a = 0.430–0.470 | Nb | 4a | 0 | 0 | 0 | 0.192 |
| C | 4b | 0.5 | 0.5 | 0.5 | 0.230 | |||
| Matrix8) | 225 - Fm-3m | a = 3.591 | Cr | 4a | 0 | 0 | 0 | 0.5 |
| Ni | 4a | 0 | 0 | 0 | 0.5 | |||
| δ – Ni3Nb9) | 59 - Pmmn | a = 0.3624–0.511 | Nb | 2a | 0 | 0 | 0.667 | 1 |
| b = 0.421–0.4251 | Ni | 2b | 0 | 0 | 0.5 | 1 | ||
| c = 0.452–0.4556 | Ni | 4f | 0.25 | 0 | 0.167 | 1 | ||
| γ”– Ni3Nb10) | 139- I4/mmm | a = 0.3624 c = 0.7406 | Nb | 2a | 0 | 0 | 0 | 1 |
| Ni | 2b | 0 | 0 | 0.5 | 1 | |||
| Ni | 4d | 0 | 0.5 | 0.25 | 1 | |||
| γ’11) | 221 - Pm-3m | a = b= c= 0.3561–0.3568 | Al | 1a | 0 | 0 | 0 | 1 |
| Ni | 3c | 0.5 | 0.5 | 0 | 1 | |||
| TiC12) | 225 - Fm-3m | a = 0.430–0.470 | Ti | 4a | 0 | 0 | 0 | 0.26 |
| C | 4b | 0.5 | 0.5 | 0.5 | 0.44 | |||
This work aims at studying the phases formed in samples subjected to three different heat treatments through XRD analysis results, and comparison of these with theoretical models. This allowed the evaluation of lattice parameters and the crystallographic structure of the phases. A quantitative analysis of the phases present in the samples could then be performed satisfactorily.
Samples of 15 mm in height were cut from a 26 mm-diameter bar, and their chemical composition was obtained through optic emission spectroscopy. Table 2 shows the results along with the chemical composition established by the API Specification 6A718;13) all values suggest that the material conforms to the specified composition of Inconel 718.
| Ni | Fe | Cr | Nb | Mo | Ti | Al | Co | C | Mn | Si | |
|---|---|---|---|---|---|---|---|---|---|---|---|
| Sample | 53.20 | 18.62 | 18.45 | 5.03 | 2.97 | 0.98 | 0.54 | 0.07 | 0.01 | 0.03 | 0.03 |
| Standard* | 55.00 | Bal. | 21.00 | 5.5 | 3.30 | 1.15 | 0.8 | 1.0 | 0.08 | 0.35 | 0.35 |
All samples were initially annealed at 1035°C to enhance homogeneity, condition I indicated in table I, and then heat treated, aging process, according to the parameters in Table 3, conditions II, III and IV (which shows temperature, time and the expected resulting phases for each condition).14) The parameters were selected in order to produce samples with different concentrations of δ-phase, with morphologies varying from mostly globular to mostly plate-like. δ-phase precipitation occurs initially at the grain boundaries with a globular morphology, which gradually changes to plate-like structures that grow inwards towards the centre of the grains, whereas γ’ and γ”-phase precipitates tend to be globular and intragranular.6) When the alloy is heat treated at high temperatures for long periods, intragranular δ-phase precipitates can often also be seen. Carbides are formed during initial stages of production of the alloy and remain unchanged during subsequent heat treatments.
| Condition | Heat Treatment | Temperature | Time | Expected phases |
|---|---|---|---|---|
| I | Annealing | 1035°C(*) | 1 h(*) | MC(+), Matrix |
| II | Annealing + aging | 835°C | 18 h | MC(+), Matrix, γ”, δ (initial plate-like) |
| III | Annealing + aging | 865°C | 18 h | MC(+), Matrix, γ”, δ (plate-like) |
| IV | Annealing + aging | 900°C | 18 h | MC(+), Matrix, δ (plate-like and intergranular) |
Hence, samples treated according to condition II (which holds the samples at a temperature within the range suggested by applicable standards, but for a period three times longer than specified in these) were expected to have a microstructure consisting of intergranular γ’ and γ”-phase precipitates. Furthermore, these samples were expected to display a mixture of globular and plate-like δ-phase precipitates at initial stages at the grain boundaries. Samples subjected to condition III (in which temperatures slightly higher than those suggested by standards are held for the same 18 h) were expected to have been depleted of γ’ and γ”-phase precipitates in favour of considerable amounts of plate-like δ-phase precipitates. Condition III is an extreme heat treatment in which high temperatures are held for the same period in order to create a microstructure consisting of large plate-like δ-phase precipitates, both at grain boundaries (growing towards the centre of the grains) and intragranular (a condition that would result from long service times at high temperatures).
The samples were analyzed through X-ray diffraction (XRD) in two ways: in bulk samples with dimensions as described above; and in the form of an electrolytically extracted precipitate powder, obtained when the matrix is dissolved according to ASTM E963.15) This standard recommends that this extraction be performed in a solution of 15% HCl in methanol, with the sample acting as an anode and a current density of 0.75 A/cm2 being applied between it and a platinum cathode for a period varying between 2 and 4 hours.
Figure 1 shows images obtained through scanning electron microscopy (SEM) from the bulk sample and the powder extract obtained from annealed samples (condition I), in which mostly globular carbides are seen. Figure 2 shows similar images obtained for samples treated according to condition IV, in which plate-like δ-phase precipitates are seen.

Scanning Electron Microscopy images of Inconel 718 samples in the annealed state (Condition I) in bulk (left) and the electrolytically extracted power (right).
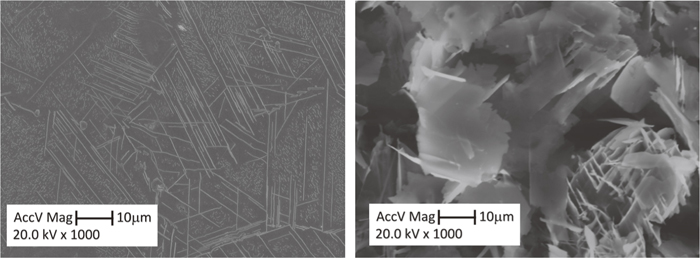
Scanning Electron Microscopy images of Inconel 718 samples treated according to condition IV in bulk (left) and the electrolytically extracted power (right).
XRD analyses were carried out in two separate equipment. For the powder samples, a Siemens D500 diffractometer equipped with a Cu X-ray tube and a graphite secondary monochromator was used. The measurement range in 2θ was from 35° to 80° with a 0.05° step and time step of 10 s. The second equipment, a Bruker D-8 diffractometer, also equipped with a Cu X-ray tube, was used in measurements on the bulk samples; in this case the 2θ range was from 20° to 145° with a 0.02° step and a time step of 20 s.
Simulations of diffractograms containing δ, γ” and NbC were performed with the PowderCell 2.4 software®.16) Data found in the literature (shown in Table 1) was used to simulate the diffractograms for γ” and NbC. δ-phase simulations were performed both with lattice parameter values and Wyckoff positions; these were varied within the boundaries established in the different literature sources and the results were routinely compared to experimental results in order to obtain the best possible match. It should be noted that simulated results obtained through PowderCell 2.4® do not take into account effects of peak broadening and interactions between phases, and hence is a simplistic simulation.16) It was however a practical way of optimizing parameters for δ-phase in order to proceed to a more robust Rietveld-based quantification simulation procedure. A typical diffractogram obtained through this analysis is shown in Fig. 3; it shows an overlay of diffractograms for the phases considered. Two diffractograms are shown for different lattice parameters of δ-phase in order to highlight the considerable effect of such discrepancies.

Simulated diffractograms for Cu radiation for δ (with two different lattice parameter data sets), γ”, and NbC.
Figure 4 shows the measured diffractogram obtained for bulk samples treated according to conditions I and IV. Samples in condition I, as expected, consisted of carbides in a γ matrix (see Fig. 1). In comparison, results in Fig. 4 for samples in condition IV showed diffraction lines for carbides, δ-phase and γ matrix; this was also expected from the images obtained in Fig. 2.
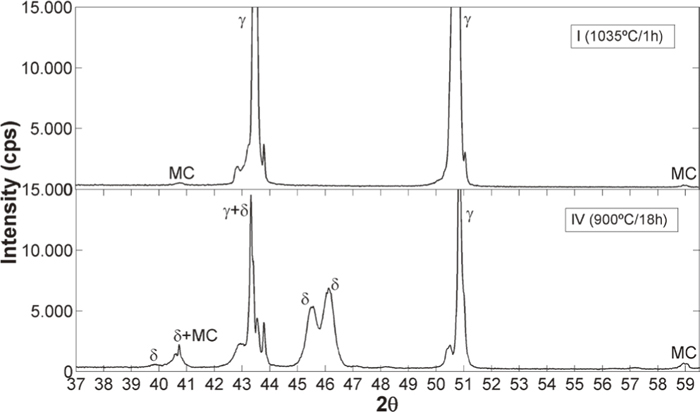
Diffractograms for Cu-Kα radiation obtained for bulk samples in conditions I and IV.
The analysis of XRD results in this alloy needs to take into account the orientation of γ and δ-phases. According to17) the relationship between their crystallographic orientations is:
Since the precipitation of δ-phase occurs due to supersaturation of the matrix at high temperatures, phase transformation occurs through symmetric spatial groups, leading to overlapping of diffraction lines (as seen in Fig. 4).
Simulations performed with data from models proposed by18) and,9) as shown in Table 4, led to significant discrepancies in relation to the experimental results shown in Fig. 4. Hence, a new model was proposed which gave a better match. The parameters for this model are also shown in Table 4; these were used for quantification of phases in the powder samples.
Diffractograms for powder samples of all conditions are shown in Fig. 5. The phases found for each condition match expectations. Samples of condition I show a mixture of TiC and NbC and some residue of γ matrix. In condition II, γ”-phase predominates, although NbC lines can still be seen along with lines of small intensity for δ-phase (which precipitates initially at grain boundaries in globular format). As the temperature of the heat treatment increases in conditions III and IV, the intensity of diffraction lines for δ-phase increases, whereas lines for γ”-phase initially increase in intensity and then disappear completely in the latter condition.

XRD results for powder samples for all analyzed conditions.
Strong overlapping of diffraction lines of γ” and δ-phases are also seen in Fig. 5. The planes with highest density of atoms are (010) for for δ-phase and (112) for for γ”-phase; both phases have the same proportion of nickel to niobium atoms (Ni3Nb) and the structure of both phases is very similar in these two planes. Such overlapping of the diffraction lines corresponding to these planes is therefore inevitable.
The diffractograms obtained for the powder samples were used for phase quantification via adjustment of a Rietveld-based refining algorithm. Figure 6 presents an overlay plot of the experimental and simulated diffractograms for a sample treated according to condition IV. The following control parameters were obtained: “R Expected” 2,99, “R Profile” 8,96 e “Weighted R Profile” 10,99; these were considered adequate given the high complexity of the phases involved in the analysis. More details concerning the R factors can be found in.19)

Experimental and Rietveld-based refined diffractograms for a powder sample treated according to condition IV.
It can be noted from the diffractograms in Fig. 6 that it is especially difficult to obtain a good match in the 2θ range between 40° and 46°; this is due to preferential orientation of the diffraction line at 43°, which causes high intensity of this peak, leading to better adjustment of this line in detriment of the smaller ones. This leads to a lower quality match of the δ-phase lines at 40° and 46°, and is a consequence of limitations of the refining algorithm.
Table 5 shows the final results of the quantification analysis for powder samples in all conditions. As expected, δ-phase quantities increase in conditions II to IV whereas all other phases reduce in quantity. Values of “R Expected”, “R Profile” and “Weighted R Profile” were all within an acceptable range, as defined in.19)
| Condition | γ | γ” | δ | MC (Carbides) |
|---|---|---|---|---|
| I | 10.6% | – | – | 90.4% |
| II | – | 96.7% | 1.7% | 1.6% |
| III | – | 90.6% | 5.4% | 3.9% |
| IV | – | – | 90.8% | 9.2% |
These results seem to show that the structure of both γ” and δ-phases proposed in this model are well described in terms of lattice parameters and atomic positions in the unit cell.
From the results obtained in this study and the comparison with the state of the art, it can be concluded that:
- The main factors that lead to mistakes in the correct identification of diffraction patterns of Inconel 718 alloys are: (i) the high complexity of the structure of δ-phase. (ii) overlapping of γ” and δ-phase diffraction lines in diffractograms, since the microstructure of the alloy in its usual application condition has considerable amounts of both phases. (iii) the different heat treatments to which the alloy can be subjected can lead to a considerable variation in lattice parameters and unit cell parameters.
- With careful heat treatment procedures, and comparison of experimental and simulated results, it is possible to correctly identify the position of the diffraction lines of γ” and δ-phases, and the effects leading to overlapping of some of their diffraction lines. Such a study also allowed the determination of the correct lattice parameters and Wyckoff positions for δ-phase.
- With the correct structure data for δ-phase, it was possible to quantify the phases in the alloy adequately, by using a Rietveld-based method.
The authors would like to thanks the Brazilian and German Government agencies CAPES, DAAD and CNPq for funding the project.