2015 Volume 55 Issue 12 Pages 2604-2608
2015 Volume 55 Issue 12 Pages 2604-2608
If the combined model is used to calculate the residence time distribution (RTD) curves of different outlets of multi-strand or asymmetric tundishes, there may exist negative dead volume fraction or bigger calculation errors. The flow characteristics (the volume fractions of dead region, plug flow, and well-mixed flow) are analyzed mainly on the basis of the tracer concentration versus time curve (C curve) or E curve. In the present work, the E curve obtained by “pulse stimulus-response” tests was translated into F curve generated by step input of the tracer; then based on F curve, an analysis model for dead volume fraction in multi-strand or asymmetric tundishes was established. The dead volume fraction was used to evaluate metallurgical effect, and the flow uniformity of molten steel in dual asymmetric tundishes was evaluated by comparing the flow concentration difference and the maximum difference of F curves between the two strands. This model was used to analyze the flow characteristics of dual-strand asymmetric tundishes. As for the experiment condition in the paper, there is a linear relationship between the dead volume fraction and the volumetric flow rate difference of the two strands. The maximum concentration difference between the two strands is not significantly affected by the volumetric flow rate difference of the two strands. Dual-strand asymmetric tundishes are not fit for casting with small volumetric flow rate. If the total volumetric flow rate is small, the volumetric flow rate difference between two strands should be reduced.
With the increasingly high demand for the quality of steel products, it is demanded that tundishes should have the functions of adjusting and controlling the temperature and composition of molten steel to further remove inclusions in steel. In industrial production, because of different products and production patterns, tundishes should be designed to have different shapes and casting strands, and tundishes can be used to produce continuous casting slabs or blooms with different sections. Asymmetric tundishs refer to the dual-stand or multi-strand tundishs whose shape is asymmetric with the long nozzle as the axis or in which the flow of molten steel is in an asymmetric state because of the different flow of different strands. When asymmetric tundishes are used to cast, the molten steel flow characteristics from the long nozzle to different outlets vary, so the temperature of different outlets and the removing effect of inclusions in molten steel are different. As a result, the quality stability of continuous casting products cannot be ensured.
Residence time distribution (RTD) is often used to analyze the fluid flow characteristics in a tundish. As for diverse RTD curves, many researchers have put forward corresponding models and modified methods. The modified combined model by Y. Sahai and T. Emi1) has been widely used so far. This model was established mainly for fluid flow characterization of single-strand tundishes and dual-strand symmetric tundishes.2) In terms of the flow characteristics of multi-strand (≥3) or asymmetric tundishes, the RTD curves of different strands are different from one another. RTD curve analysis models for multi-strand tundishes were mainly worked out on the basis of the combined model.3,4,5,6,7,8,9,10,11,12) Pulse stimulus-response method was often adopted to obtain the outlet tracer concentration versus time curve (C curve) in simulation experiment of multi-strand tundishes. Then C curve was analyzed or translated into E curve. Many researchers4,6,7,9) used the combined model for single-strand tundishes to calculate the volume fractions of dead region, plug flow and well-mixed flow of different strands. They evaluated the flow characteristics of tundishes by comparing the volume fraction difference between different strands before and after optimization. Z. Wei11) evaluated the flow characteristics of tundishes by averaging the volume fraction of different strands obtained by the combined model for single-strand tundishes. S. Zheng8) thought that the combined model for multi-strand tundishes could be considered as the parallel connection of several combined models for single-strand tundishes. The volume fraction of plug, mixed and dead regions is the sum of that of plug, mixed and dead regions of different strands. R. D. Morales,5) A. Kumar10,11,12) and H. Lei13) used the experiment data of different strands of multi-strand tundishes to calculate the overall RTD curve, then analyzed the RTD curve using the combined model, and finally evaluated the flow characteristics. However, if the combined model is used to calculate the RTD curves of different outlets, there may exist negative volume fraction of dead region or bigger calculation errors.13) In addition, researchers4,6,7,9,10,11,12) tended to consider the tundishes were symmetric and only measured the concentration variation of half outlet when they studied the dead region of multi-strand tundishes. The dead volume fracion obtained by this method is different from that of single-strand tundish in physical meaning.
The analysis methods used in the present work are different from the common ones. Based on F curve, a new analysis model for the dead volume fraction in multi-strand or asymmetric tundishes was established, where the dead volume fraction was used as a flow characteristic value to evaluate the metallurgical effect of tundishes, and the flow uniformity of different strands was evaluated by comparing the flow concentration difference of F curve between different strands. In addition, simulation experiments were carried out on the basis of an industrial tundish for dual-strand slab continuous casting in a steel plant. The flow features were characterized while the two strands cast slabs with different sections at the same time.
The dead volume is the fluid that moves slowly in the tundish and stays for longer than double1,6,7,8) (used in this paper) or 2.5 times3,4,10,12) the mean residence time. F curve can be used to reflect the residence time distribution of new and old molten steel in tundishes.14) Figure 1 shows a typical F curve of tundish. The area between the curve and the horizontal axis represents the new molten steel volume out of tundish. The one between the curve and the line of F=1 represents the old molten steel volume out of tundish. The old molten steel volume, whose residence time is over 2 times the mean residence time, is called dead volume in tundish. The dead volume fraction can be calculated out as follows:
| (1) |
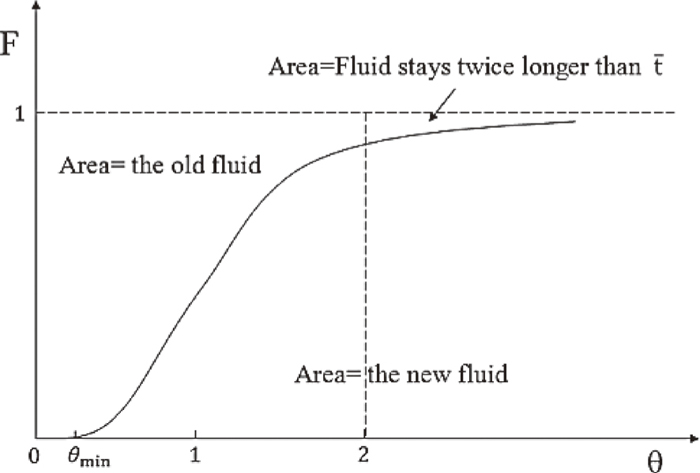
F curve of single-strand tundish.
For multi-strand or asymmetric tundishes, the new molten steel volume out of n-strand tundish is equal to the sum of the new molten steel volumes out of different strands.
| (2) |
The dead volume fraction in multi-strand or asymmetric tundish can be calculated out by substituting Eq. (2) into Eq. (1).
| (3) |
Equation (3) means the total volume of the new molten steel out of different strands of multi-strand or asymmetric tundish is the new molten steel volume out of the whole tundish. The volume of old molten steel out of tundish can be obtained by subtracting the volume of new molten steel from the total volume out of tundish, and the volume of old molten steel which does not flow out of tundish can be obtained by subtracting the volume out of tundish from the total volume of old molten steel in tundish. The dead volume fraction obtained is that in the whole tundish and is equal to that of single-strand tundish shown in Fig. 1 in physical meaning.
As is well-known to us, F curve is the cumulative residence time distribution curve obtained by step input of the tracer in water model experiment of tundish. The relationship between F curve and E curve is as follows:14,15)
| (4) |
According to Eq. (4), the E curve by “pulse stimulus-response” tests can be translated into F curve. And then the dead volume fraction in single-strand tundish can be calculated out based on Eq. (1), as follows:
| (5) |
By substituting Eq. (2) into Eq. (5), the dead volume fraction in multi-strand or asymmetric n–strand tundish can be calculated out as follows:
| (6) |
For water model experiments, translating the E curve by “pulse stimulus-response” tests into F curve is preferable to directly obtaining F curve by step experiments. On the one hand, fewer tracers, such as KCL, are used, especially for models with large size. On the other hand, the existing experiment devices and methods need not be changed, and what needs to be changed is the subsequent analysis methods and thoughts. The calculation method of E curve was presented in Refs. 10) and 14). The curve of water conductivity vs. time obtained by “pulse stimulus-response” tests can be translated into C curve by dimensionless method. Then C curve can be translated into E curve by normalization processing.
2.2. Evaluation Methods for Consistency of Flow Characteristics of Different StrandsAccording to Eq. (3), the new molten steel volume out of different strands of multi-strand or asymmetric tundish would affect the dead volume fraction in the whole tundish, and the ability of tundish to remove non-metallic inclusions. In addition, the difference between the new molten steel volumes out of different strands of multi-strand or asymmetric tundish would affect the uniformity of the temperature in tundish and cleanness of the molten steel, as well as the quality stability of casting products. So for multi-strand or asymmetric tundish, both the dead volume fraction and the uniformity of the flow characteristics should be studied.
Figure 2 shows typical F curves of two-strand asymmetric tundish. By comparing these two F curves, it can be easily found that the dimensionless concentration difference between the two strands vary with dimensionless time, from which the uniformity of molten steel in dual-strand tundish can be found out.
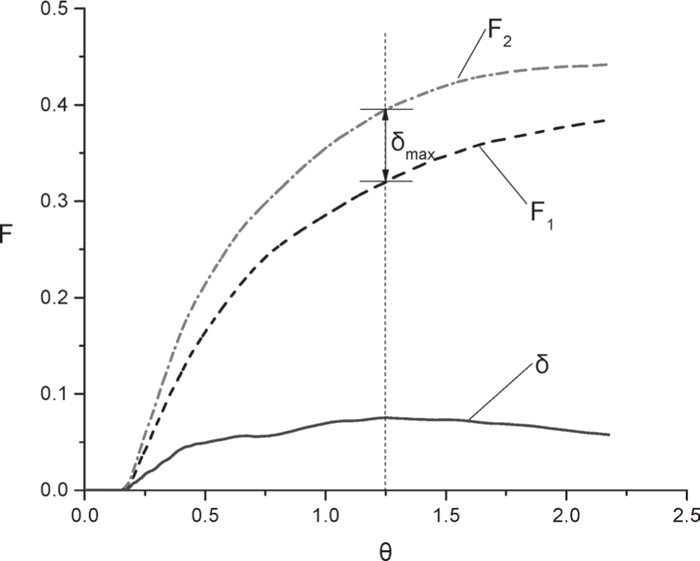
F curves of two strands varying with dimensionless time.
In the present work, the concentration difference between two strands is defined as δ, which can be calculated out based on the following equation:
| (7) |
The area between the concentration difference curve between two strands δ and horizontal axis θ represents the difference of new fluid volumes from two strands. The bigger the difference is, the greater the effect on the uniformity of the temperature and cleanness of the two-strand molten steel is. The biggest concentration difference between two strands δmax reflects the maximum difference value between two strands, so it is considered as an index to evaluate the flow uniformity in two-strand asymmetric tundish.
For multi-strand or multi-strand asymmetric tundish, the variation of the concentration standard deviation of different strands with time can be calculated out by comparing the F curves of different strands. According to this, the molten steel uniformity of different strands in n-strand tundish can be judged. The fluid concentration standard deviation of different strands σ can be obtained as follows:
| (8) |
The maximum of the fluid concentration standard deviation of different strands σmax reflects the maximum of difference degree of different strands, so it is considered as an index to evaluate the flow uniformity in multi-strand or multi-strand asymmetric tundish.
The relationship between δ and σ is as follows: σ is a basis for evaluating tundishes with more than two strands. If n=2, then:
| (9) |
It can be seen that both δ and σ reflect the difference between different strands. In evaluating the difference between two strands in dual-strand asymmetric tundish, δ is double σ, so the difference rule between two strands will not be affected. In addition, Eq. (7) is simpler and its physical meaning is more specific in evaluating dual-strand tundish.
An organic glass tundish model was produced in the 1:3 proportion of an industrial dual-strand tundish for slab continuous casting in a steel plant. The size of the prototype tundish in the plant is shown in Fig. 3. The Reynolds number and Froude number of the flow of the model is equal to those of the prototype tundish. In the tundish system, the water flow in constant temperature water model experiment is turbulent flow mainly driven by gravity and inertia force, so Froude number was chosen as the key number of the experiment. The water flow in the simulation experiment corresponding to the molten steel flow in the prototype tundish can be calculated as follows:
| (10) |
| (11) |

Illustration of the size of tundish.
The experiment was carried out at room temperature and it used cold water. Using cold water or hot water may have a certain effect on the electrical conductivity of water, the temperature field and the flow field in the tundish, but it would not affect the application of this model to the analysis of the asymmetric flow characteristics. The detailed experimental procedure is the same as described in Ref. 11).
3.2. Analysis Result of Dead Volume in TundishThe results of the experiments are shown in Table 1, where the dead volume fraction was worked out according to Eq. (6).
| No. | Q1 (×10−4 m3/s) | Q2 (×10−4 m3/s) | |Q1–Q2| (×10−4 m3/s) | Q (×10−4 m3/s) | |Q1–Q2|/Q | Vd/V | δmax |
|---|---|---|---|---|---|---|---|
| 1# | 3.1 | 3.96 | 0.86 | 7.06 | 0.1214 | 0.2855 | 0.0427 |
| 2# | 4.38 | 5.13 | 0.75 | 9.52 | 0.0786 | 0.1856 | 0.0516 |
| 3# | 5.35 | 4.81 | 0.54 | 10.16 | 0.0527 | 0.1163 | 0.0271 |
| 4# | 5.35 | 5.03 | 0.32 | 10.37 | 0.031 | 0.1017 | 0.0335 |
| 5# | 5.35 | 5.13 | 0.22 | 10.48 | 0.0205 | 0.1192 | 0.0199 |
| 6# | 5.35 | 5.45 | 0.11 | 10.8 | 0.0099 | 0.0702 | 0.0294 |
From Table 1, we can see that if the total volumetric flow rate is small and the volumetric flow rate difference between two strands is large, the dead volume fraction is large. Among the 6 experiments, the total volumetric flow rate of 1# experiment is smallest (7.06×10⁻⁴ m3/s) and its volumetric flow rate difference between two strands is largest (0.1214). As a result, its dead volume fraction is largest, 0.2855. Conversely, the total volumetric flow rate of 6# experiment is largest (10.8×10⁻⁴ m3/s) and its volumetric flow rate difference between two strands is smallest (0.0099). As a result, its dead volume fraction is smallest, 0.0702. The dead volume fraction in asymmetric tundish is affected by both the total volumetric flow rate and the volumetric flow rate difference between two strands.
3.3. Analysis Results of Flow UniformityAccording to Table 1, the maximum concentration difference between two strands of 2# experiment is 0.0516. The corresponding F curves of 2# experiment are shown in Fig. 4. According to Fig. 4, there exist obvious concentration difference between the two strands, and the concentration difference varies with time, which is harmful to the uniformity of different strands and production of different sections.
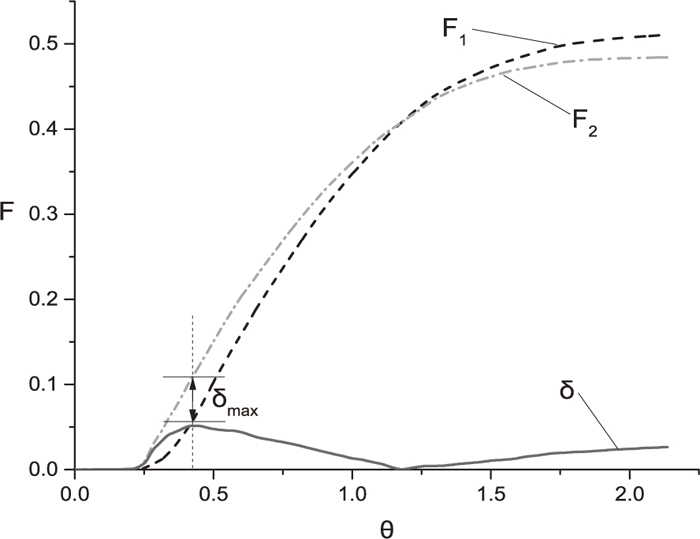
F curve of 2# experiment.
The corresponding F curves of 5# experiment are shown in Fig. 5. According to Fig. 5, the F curves of the two strands present similar trend, and the maximum concentration difference is only 0.0199. The concentration difference varies little with time, and the flow states are similar to each other. The continuous casting of different sections can be carried out with the dual-stand tundish.
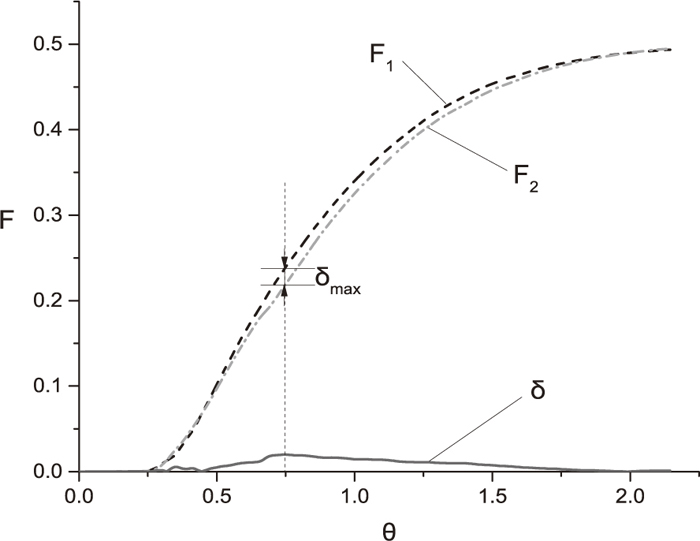
F curve of 5# experiment.
The relationship between the volumetric flow rate fraction difference between two strands and the dead volume fraction as well as the maximum volumetric flow rate fraction difference between two strands is shown in Fig. 6. According to Fig. 6, it can be seen that the dead volume fraction increases nearly linearly with the rise of the volumetric flow rate fraction difference. The intercept of the fit line with Y axis represents the real dead volume fraction in asymmetric tundishes (about 0.052), which is not influenced by the flow difference between two strands. The maximum concentration difference between two strands increases with the rise of the volumetric flow rate fraction difference, but there is not obvious linear relationship between them. This means that the volumetric flow rate fraction difference between two strands has a more significant influence on the dead volume fraction, but it has a less significant influence on the maximum concentration difference between two strands.
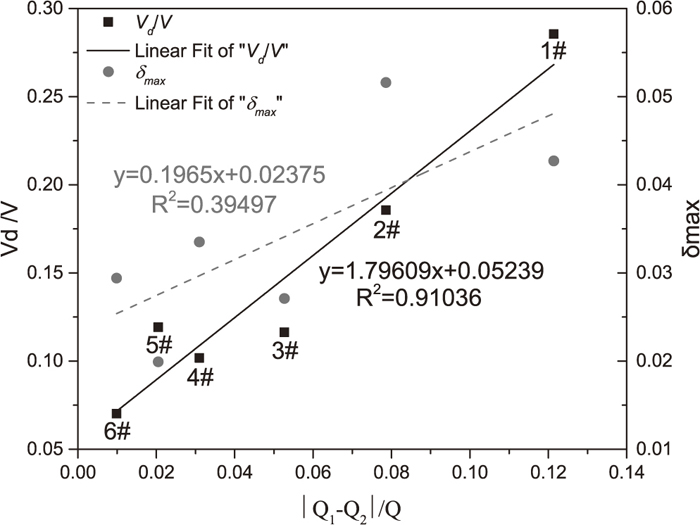
Effect of the fraction difference of volumetric flow rate between two strands on the dead volume fraction and the maximum volumetric flow rate fraction difference.
Dual-strand asymmetric tundishes are fit for casting under the condition of smaller volumetric flow rate fraction difference between two strands. On the one hand, it should be avoided to use dual-strand asymmetric tundishes to cast products under smaller volumetric flow rate fraction difference between two strands. For example, the total volumetric flow rate of two strands of 1# experiment is smallest, but its dead volume fraction attains to 0.2855 and the maximum concentration difference is 0.0427. It is easy to lead to the increase of the difference between two strands. As a result, the uniformity of the temperature and cleanness of the molten steel, as well as the quality stability of casting products, will be affected. On the other hand, the volumetric flow rate difference between two strands should be reduced as much as possible. For example, the volumetric flow rate difference between two strands of 6# experiment is smallest, its dead volume fraction is only 0.0702 and the maximum concentration difference is 0.0294. The flow of the two strands is similar to each other, and different sections can be casted at the same time in industrial production.
By translating E curve obtained by “pulse stimulus-response” experiment into F curve, a calculation model for the dead volume fraction in multi-strand asymmetric tundishes was established on the basis of F curve. The dead volume fraction in multi-strand or asymmetric tundishes obtained by this model is equal to that of single-strand tundishes in physical meaning.
The concentration standard deviation of different strands and its maximum can be used to evaluate the molten steel flow uniformity of different strands in multi-strand or multi-strand asymmetric tundishes. In the present work, the fluid concentration deviation δ and its maximum δmax were used to evaluate the molten steel flow uniformity in dual-strand asymmetric tundishes. Large fluctuation of δ curve and large δmax indicate the poor uniformity in asymmetric tundishes.
Under the experiment condition in the paper, if the total volumetric flow rate is small and the maximum volumetric flow rate fraction difference between two strands is large, the dead volume fraction is large. The dead volume fraction increases with the rise of the volumetric flow rate fraction difference between two strands. The volumetric flow rate fraction difference between two strands has a more significant influence on the dead volume fraction, but it has a less significant influence on the maximum concentration difference between two strands.
The authors give thanks to Beijing Higher Education Young Elite Teacher Project (No. YETP0411) for the financial support.
Vd: Volume of dead region in a tundish
V: Volume of fluid in a tundish
F: Cumulative residence time distribution
E: Residence time distribution function
θ: Dimensionless time
L: Characteristic length
Q: Total volumetric flow rate in through a tundish
Q1: Volumetric flow rate through strand 1
Q2: Volumetric flow rate through strand 2
m: Model
p: Prototype