Regular Article
Theoretical and Experimental Analysis of Chatter in Tandem Cold Rolling Mills Based on Wave Propagation Theory
2015 Volume 55 Issue 3 Pages 637-646
Details
2015 Volume 55 Issue 3 Pages 637-646
In this paper, a new theory is introduced to explain chatter mechanism based on wave propagation in elastic solids. It is believed that previous theories in chatter are based on a static analysis and normally are consistent just for low-frequency vibrations such as forced vibration. But chatter phenomenon is a dynamic high-frequency event and requires a consistent theory with a dynamic analysis. In this research, variations of inter-stand tensions are calculated based on wave propagation theory. Predicted results by wave propagation theory were evaluated by dynamic finite element method in a benchmark problem. Results show that wave propagation theory is consistent by dynamic finite element method, but previous theories are not sufficiently accurate in chatter conditions. Hereafter, a numerical model is constituted to simulate the vibrational behavior of a tandem rolling mill. Parameters for numerical simulations are adopted from an industrial two-stand tandem mill. Consequently, results of the analytical model are compared with the experimental measurements from that full scale industrial mill. Two main chattering characteristics, i.e., critical rolling speed and chatter frequency, obtained from the simulation program were found to be more consistent with the experimental results when considering the dynamic effects.
Similar to any mechanical system, rolling mills may vibrate in any of the following three vibration types: forced, free, or self-excited vibration. The third type is usually known as the chatter vibration, and has three predominant types: torsional, third-octave, and fifth-octave.
Chatter researches can be classified into the following categories: Several theoretical researches have been conducted to model the chatter vibrations in rolling.1,2,3,4,5,6) Consequently, a large number of mathematical models for the rolling process have been established with various degrees of simplification. In these researches, efforts are made to understand the causes of chatter and to prepare a chatter model. On the other hand, some researchers reported their experimental findings in this respect.2,7,8,9,10,11) Several approaches have been made to provide significant insights into the chatter phenomenon, and are used to investigate control methods for the suppression of instability in this process.3,9,11,12) As a result, advanced chatter monitoring instruments were implemented. The frequency analysis of the rolling mills is presented in some articles in order to be used to predict the dynamic behavior of rolling stands.8,13,14) The influence of lubrication and friction on the chatter is studied and the conclusions are reported in the literature.2,15,16,17) Since the main objective of the current research is the identification of the chatter phenomenon and improvement of its models, some related researches are briefly reviewed.
Tamiya et al.18) addressed the development of rolling chatter by studying the relationship between roll movements and strip tension variations. Further, they proposed that the chattering phenomenon is a self-excited vibration due to the phase delay between the strip tension and vertical vibration of the work rolls based on the study of a simplified model. Tlusty et al.19) formulated the simple theory of chatter in cold rolling. They tried to explain the relationship between rolls vibrations and tension fluctuations. They have pointed out that the periodic variation of the rolling force leads to the rolling vibrations by a 90-degree phase. Consequently, it results in negative damping and causes a rise in vertical oscillations of the rolls.
Yun et al.20) developed a model that is more suitable for studying chatter. This model presents a dynamic relationship between rolling parameters, and relaxes some assumptions in the previous models. It is pointed out by Hu et al.21) that there are four significant mechanisms for third octave chatter: model matching, negative damping, mode coupling, and regenerative.
Niroomand et al.22) utilized a finite element model of the chatter vibrations in rolling, which relaxes many assumptions of analytical models. This model has the benefit of mass translation to the computational region by using Arbitrary Lagrangian Eulerian (ALE) technique, which tremendously reduces huge computational requirements of common Lagrangian models. According to explicit dynamic finite element method that was used, authors discovered that wave propagation is an important factor in studying chatter in rolling. It is found that modeling of the elastic parts of the strip that are between stands can be improved by using wave propagation theory. So, authors in current research made a comprehensive study of rolling chatter, by taking the wave propagation theory into consideration.
Furthermore, preceding theory on chatter in cold rolling is discussed. Then, a new theory for explaining chatter mechanism using wave propagation in elastic solids is developed. This is followed by a comparison of the accuracy of previous theory and that of suggested theory in real conditions of chatter. Suggested wave propagation theory is then implemented in a simulation program. Finally, experimental measurements are used to show the accuracy, robustness and usefulness of the proposed theory and simulation program.
According to previous research of the authors,22) in which explicit finite element method has been used, the effect of the wave propagation was found to be important in the chatter phenomenon. According that stress wave propagation is taken into account only in dynamic finite element method, finite element analysis is used to evaluate the wave propagation theory. In this section, wave propagation theory and its contribution to chatter simulations is discussed.
2.1. Wave Propagation TheoryMany chatter researches are generally based on the idea introduced by Tamiya et al.18) that has been presented in a simple theory by Tlusty et al.19) In this paper, based on the wave propagation in elastic solids, a new theory for studying chatter in rolling has been presented. First, the previous theory in chatter is introduced. Hereafter, this theory will be called the simple theory.
Tamiya et al.18) supposed two neighboring stands in which downstream one is vibrating as illustrated in Fig. 1. The second stand is considered for analysis.

Vibration of rolling stand.
They also supposed that the thickness of the input strip to the stand is constant while the output strip thickness is varying. From the equation of mass consistency it is concluded that the input velocity must also vary. The exit velocity from the previous stand is constant and equal to the mean of the input strip velocity at the current stand. The difference in these velocities causes a variable tension to the strip. Variation of the tension (dσ) is determined in the simple theory by Arimura et al.23) and was used by Tamiya et al.18) and later on by other researchers19,20,21) as given below:
| (2.1) |
Obviously, the weak point of the above equation is that it is based on a static analysis. Fortunately, wave propagation on the strip between two consequent stands could be easily formulated using one-dimensional wave theory. The governing equation for the one-dimensional motion of an elastic solid may be written as follows24,25,26,27) that is called the wave equation:
| (2.2) |
| (2.3) |
By integrating the above equation and according to Hooke’s law, changes in tensile stress can be achieved. Results of the static analysis coincide with Eq. (2.1) that represents the simple theory.
The significance of dynamic effects depends on the ratio of the two characteristic times: the time specifying the application of the external load and that of transmission of wave across the body. It should be noted that dynamic effects are important if these two characteristic times are of the same order of magnitude. Otherwise, the situation is quasi-static rather than dynamic, and inertia effects can be neglected. For permanent loads, the effects of wave propagation need to be taken into account if the externally applied load is rapidly changing with time, i.e., if the frequency is high.24,25,26,28) The significance of dynamic effects in chatter models will be discussed next.
The general solution of the wave equation (Eq. (2.2)), which is the governing equation of the dynamic problem, is given by:24,25,26,27)
| (2.4) |
For linear elastic material:
| (2.5) |
| (2.6) |
| (2.7) |
As mentioned previously, the criterion to investigate the significance of dynamic effects in mechanical problems is presented in the literature by a well-known principle: the ratio of the time specifying the application of the external load and that of transmission of wave across the body. So, these two characteristic times should be evaluated in the conditions of rolling chatter. Typical frequencies of third-octave chattering are in the range of 100 to 250 Hz and the fifth-octave chatter usually occurs in the range of 500 to 700 Hz. On the other hand, the rolling stands configuration and rolling condition should also be taken into consideration. So, the finite element analysis of a sample problem is intended to provide basic evaluation of the wave propagation theory, which is utilized for considering dynamic effects in chatter problems.
Figure 2 shows a schematic view of a part of the strip that is located between two stands. As mentioned before, the output speed from the previous stand is equal to the mean speed of input strip to the current stand. In the finite element problem, the mean value of speed is subtracted from both sides. So, the left side is fixed and the right side has a varying speed about zero.

A schematic view of a part of the strip that is located between two stands.
This model consists of a two-dimensional thin-thickness plate, which is made of steel. The model is investigated using plane strain computations. A linear elastic isotropic material is used and the reflection of the waves is assumed to be non-dissipative. The boundary conditions are that all degrees of freedom on the left side of the plate are constrained. The loading is prescribed by assigning the sinusoidal velocity boundary condition at the right end of the strip as shown in the figure. The plate is modeled with equal sized four-node quadrilateral elements. The problem is analyzed by both dynamic explicit method and static method using automatic time stepping. Specifications of the sample problem are summarized in Table 1.
| Parameter | Value |
|---|---|
| Elastic modulus (E), GPa | 200 |
| Density (ρ), Kg/m3 | 7800 |
| Maximum variation in speed (V0), m/s | 0.2 |
| Thickness (t), mm | 0.216 |
The stability limit (the largest time increment that can be taken without the method generating large errors) is closely related to the time required for a stress wave to cross the smallest element dimension in the model; thus, the time increment in an explicit dynamic analysis can be very short if the mesh contains small elements. The method is, therefore, computationally attractive for problems in which the total dynamic response time that must be modeled is only a few orders of magnitude longer than this stability limit such as wave propagation. The mesh which is chosen should be sufficiently refined to accurately model waves. Mesh convergence criteria represent that the chosen mesh density should not significantly be less accurate than a finer version. So, the mesh was sufficiently refined such that an increase in mesh density yielded a 1%, or less, change in the results.
The main objective of this study is to find the relationship between speed variation and variation of inter-stand tension in chatter conditions. Four different cases are run. In the first attempt, the length of the strip, inter-stand distance, is set to 4.725 meters. This is equal to the distance between two subsequent stands in the test machine that is used in the experimental investigations. It is important to know that the designs of rolling mills are very close to each other; therefore, this length is a typical inter-stand distance for many of the cold rolling tandem mills. The frequency of speed variation is set to 200 Hz, i.e., in the range of third-octave chatter. This problem is analyzed by dynamic explicit finite element method. In addition to finite element solution, the relationship between speed variation and stress variation at the right end of the strip is calculated by the simple theory and wave propagation theory.
Based on the wave propagation theory, stress wave propagates through the strip. In an elastic solid, the stress value is always much less than the elastic modulus value. So, the strip velocity will be much less than the stress propagation velocity.24,25,26) The stress wave travels through the inter-stand distance and reflects as it reaches the neighboring stand. The reflected stress wave will be superposed by subsequent stress waves. Hence, the value of stress in each stage is superposition of the value of the stress wave at the same instance and that of the previous reflected waves. It can be calculated using a loop, by repeating the superposition of the new wave and reflected waves, in a program for utilizing wave propagation theory. Stress variation in the right end of the strip according to each of the above methods is presented in Fig. 3(a).
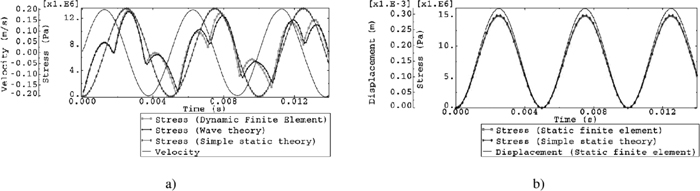
Simulation results (L=4.725 m, ω=200 Hz), a) First case (Dynamic finite element), b) second case (Static finite element).
Figure 3(a) shows that the stress variation calculated by the dynamic explicit finite element method is different from the stress calculated by the simple theory. The stress variation that was obtained based on the wave propagation theory matches that of the results of dynamic finite element method. Sharp points that are seen in the stress diagram in the dynamic finite element method are related to situations in which a new sine wave is accumulated with the reflected waves.
Based on the frequency of oscillation (200 Hz), the time period in the first case is 0.005 second. While the transmission time of the wave from the right end to the left end is about 0.001 seconds. So, these two characteristic times are approximately of the same order; so, dynamic effects should be considered.24,25,26,28)
As mentioned previously, the simple theory is based on a static perspective. In the second case, the previous problem is analyzed by static finite element method. Figure 3(b) shows the results of the second case.
It can be seen that the stress obtained from the static finite element method is proportional to the displacement. It matches the results of the simple theory well and proves that the simple theory is a static analysis which can’t consider the dynamic effects.
Under certain conditions, inertia effects can be neglected and results of the dynamic finite element method would be similar to the static finite element method. Some of these are conditions of low-frequency of oscillation or low inter-stand distance. As for both of these conditions, the oscillation time period and wave transmission time are not in the same order of magnitude.
In the third case, the frequency of oscillation is set to 50 Hz, and dynamic finite element method is used. Results of this case are shown in Fig. 4(a).
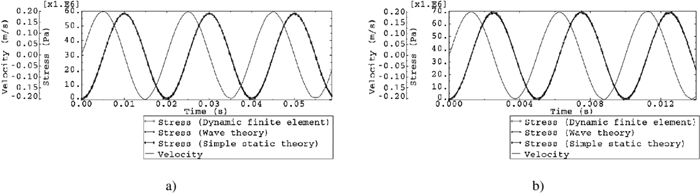
Simulation results, a) Third case (L=4.725 m, ω=50 Hz), b) Fourth case (L=1 m, ω=200 Hz).
It is evident that when the frequency of speed oscillations is low, stress oscillations will have the same shape. In this condition, results of both simple theory and wave propagation theory perfectly match those of dynamic finite element method. But it should be considered that the frequency of third-octave chatter and fifth-octave chatter is much larger than 50 Hz. It can be concluded that the simple theory is adequate for studying low-frequency vibrations such as the forced vibration in rolling.
Figure 4(b) is related to the fourth case in which the length of the strip is set to 1 meter. It can be seen that results of both simple theory and wave propagation theory are in agreement with those of the dynamic finite element method. But it should be noted that generally inter-stand distances are more than 1 meter. For example, the distance between stands in the test machine, i.e., the two-stand tandem mill unit of Mobarakeh Steel Company (MSC), is 4.725 meters. Table 2 compares the conditions of different cases that have been analyzed using dynamic finite element method.
| Case | Frequency (f), Hz | Length (L), m | Oscillation time period (tf), s | Wave transmission time (tw), s |
| Dynamic analysis | Static analysis |
|---|---|---|---|---|---|---|---|
| 1 | 200 | 4.725 | 0.005 | 0.001 | 5 | Valid | Not valid |
| 3 | 50 | 4.725 | 0.02 | 0.001 | 20 | Valid | Valid |
| 4 | 200 | 1 | 0.005 | 0.0002 | 25 | Valid | Valid |
It is clear that in the first case, two characteristic times, i.e., the oscillation time period and wave transmission time, are of the same order of magnitude. So, in this case, only dynamic analysis is valid. But in the third and fourth cases, these two characteristic times are not in the same order of magnitude and both dynamic and static analyses are valid.
Hereinafter, simulation results of a two-stand tandem mill based on the wave propagation theory will be presented and compared with the experimental measurements.
Chatter is generated by interactions between the dynamics of the rolling structure and that of the rolling process.6,21,29,30,31) The dynamics of the mill structure and that of the rolling process will be separately modeled, and chatter model will be constructed based on the interaction between these two models.
3.1. Rolling Process ModelIn this research, a dynamic model of the rolling process was adopted based on Hu et al.1) The model is obtained by applying the slab method to the plastic deformation process under plane strain condition. Work hardening is ignored and rigid-perfectly plastic model is used for the plastic deformation process of the strip material. Elastic flattening of the work rolls is not considered. Input parameters to model include strip entry and exit tensile stresses (σ1 and σ2), strip thickness at entry (h1), roll horizontal movement (xc), roll gap spacing (hc) and roll peripheral velocity (vr). Output parameters are rolling horizontal force per unit width (fx), rolling vertical force per unit width (fy), rolling torque per unit width (T), strip velocity at entry (u1) and strip velocity at exit (u2). These parameters are shown in Fig. 5.

Roll bite geometry.
Relationship between input and output parameters can be found by following equations:1)
| (3.1) |
| (3.2) |
| (3.3) |
| (3.4) |
| (3.5) |
| (3.6) |
| (3.7) |
| (3.8) |
| (3.9) |
Since the chatter is a dynamic phenomenon rather than a static one, variations of the parameters rather than their steady-state values should be studied. This can be achieved by linearization of the process. So, a linearized model is achieved by applying a first-order Taylor series approximation to the equations of the rolling process model. The linearized rolling process model can be expressed in the form of a transfer function matrix. Input parameters can be presented as a vector up.
| (3.10) |
Output parameters also can be presented as a vector yp.
| (3.11) |
Dynamic model of the rolling process can be written in the transfer function matrix:
| (3.12) |
A four-high mill stand can be presented as a vibration system with four degrees of freedom which is assumed to vibrate along the longitudinal principal direction. It consists of four mass elements including the top and bottom work and backup rolls, and all forces due to elastic deformations are represented by linear springs.1,2,20,31) Instead of this model, a simplified model assuming that the vibration is symmetrical to the rolled strip can be used. As a result of this assumption, the number of degrees of freedom of the model was reduced to two.
The displacements between the rolls change when there is a dynamic force variation acting on the work roll. The relationship between the displacement of the backup and work rolls and the force variation dfy can be expressed by a set of second order differential equations:
| (3.13) |
| (3.14) |
The relationship between the angular motions of the roll and the torque variation (dT) can be written as follows:
| (3.15) |
| (3.16) |
| (3.17) |
So, the structure model can be represented as:
| (3.18) |
The chatter model for a single stand can be formulated by combining the rolling process model with the structural model and by considering the interactions between neighboring stands20,21,29,30) as schematically shown in Fig. 6(a). It can be seen how the outputs of the rolling process model act as the inputs of the structural model and vice versa. Also, there are three input ports and three output ports to interact with the upstream and the downstream single stand chatter models via inter-stand model. The input ports include the thickness variation of the upstream stand, dh1, the exit tensile stress variation of the upstream stand, dσ1 , and the entry tensile stress variation of the downstream stand, dσ2, while the output ports consist of the thickness variation of the stand, dhc, the exit velocity variation of the stand, du2, and the entry velocity variation of the stand, du1.

Single stand chatter model, (a) Combination of rolling process and structural models, (b) Inter-stand model.
The construction of the inter-stand model is shown in Fig. 6(b). Essentially, the inter-stand model is used to compute the back and front tension variations using the differences in the velocity variations. The inter-stand model is based on the presented wave theory instead of previous theories (Eq. 2-1). In this model, the stress wave travels the inter-stand distance and reflects as it reaches the neighboring stand. Reflected stress wave is superposed by subsequent stress waves. Hence, the value of stress in each stage is superposition of the stress wave at the same instance and that of the previous reflected waves. It is calculated using a loop, by repeating the superposition of the new wave and reflected waves. Also, strip gauge variation from one stand to the next is considered.
To study the two-stand tandem mill stability, a suitable model is established based on the single-stand chatter model shown in Fig. 7.

Chatter model for a multi-stand tandem mill.
The two-stand chatter simulation program consists of two single-stand chatter modules, one payoff reel module and one pick-up reel module, as shown in Fig. 8.

Two-stand chatter simulation program.
Each chatter module represents a single-stand chatter model that contains a mill structure model and a rolling process model, along with an inter-stand model, which deals with the inter-stand tension and the transportation time delay effects. The payoff reel and pick-up reel modules are used to provide a way to feed back the influences of tension variations before the entry to the first stand and after the exit from the second stand. The payoff reel module also provides an initial excitation to the stands so that the dynamic responses of each individual stand along with the inter-stand tension variations can be studied. This disturbance is a small thickness reduction of 10 μm from the steady state condition for 1 ms duration. It can simulate an impulse signal which excites all frequency modes of the system.
The experimental data used in this research is collected from a two-stand tandem mill unit of Mobarakeh Steel Company (MSC). Figure 9 shows a view of this unit.

Two-stand tandem mill unit of Mobarakeh Steel Company.
Incoming coils of this unit are 2 mm in thickness. The coil passes through two four-high stands and reduces its thickness by 60 to 90 percent as a result of two or three rolling passes, and is coiled by a Pick-up reel. The second pass is in the reverse direct. In practice, for this mill, chatter usually occurs in second stand during the third pass.
A chatter detector system was installed in the second stand. It processes the signals from the accelerometer sensor. The frequency of sampling of this sensor is 5120 Hz. If the frequency of rolling vibration lies in the range of chatter frequency, or amplitude of acceleration or its rate of divergence reaches the critical value, rolling speed is decreased automatically to avoid chattering. All rolling conditions are recorded during the process and can be used in simulation programs. Rolling speed and frequency of chatter will be used for the comparison of the simulation results and the experimental measurements.
To simulate the chatter, rolling conditions should be obtained first. Specifications of the rolling mill under consideration and process parameters in third pass are presented in Tables 3 and 4.
| Parameter | Stand 1 | Stand 2 |
|---|---|---|
| Work roll mass (Kg) | 14000 | 14000 |
| Backup roll mass (Kg) | 38000 | 38000 |
| Work roll damping coefficient (N.s/m) | 0 | 0 |
| Backup roll damping coefficient (N.s/m) | 9.54e5 | 9.54e5 |
| Work roll spring constant (N/m) | 7.01e10 | 7.01e10 |
| Backup roll spring constant (N/m) | 3.64e8 | 3.64e8 |
| Work roll radius (m) | 0.245 | 0.245 |
| Backup roll radius (m) | 0.675 | 0.675 |
| Friction factor | 0.051 | 0.054 |
| Shear yield stress (MPa) | 514.55 | 535.65 |
| Strip width (m) | 0.732 | 0.732 |
| Entry thickness (m) | 416e-6 | 324e-6 |
| Exit thickness (m) | 324e-6 | 216e-6 |
| Parameter | Payoff real-Stand 1 | Stand 1-Stand2 | Stand 2-Pickup real |
|---|---|---|---|
| Distance (m) | 5.675 | 4.725 | 6.6 |
| Tensile Stress (MPa) | 95 | 151 | 81 |
Most of these parameters are recorded in the rolling unit by a data collection. Some of the parameters such as reductions and tensions are determined based on the reduction and tension tables. The process automation system of the rolling unit involves some calculation to estimate the friction coefficient and material properties. The coefficient of friction is obtained using an empirical equation. This equation takes into account the bite angle, initial work roll surface roughness, change of roughness by grinding, as well as wear during rolling. The estimated friction coefficient is used to calculate rolling force and torque. Comparison of calculated and measured rolling force and torque verifies the estimated friction coefficient. The model utilized a constant friction factor approach rather than a constant friction coefficient approach to formulate the friction between the work roll and strip. So, the coefficient of friction is converted to friction factor.32) The constant friction factor model is suitable for metal forming processes under highly loaded conditions1) but may seem to be not adequate under excellent lubrication conditions, because the friction stress is far less than the shear strength of the strip material. But it should be mentioned that the friction stress exceeds the limiting shear stress of the rolling lubricant and the use of friction factor is reasonable in the investigated conditions.33)
The values of spring constants and damping coefficients are obtained as follows. Mill modulus of a rolling mill is obtained experimentally by a calibration test. Mill modulus is the equivalent stiffness of the contacting rolls and stand. The deformation of the rolls is nonlinear. The nonlinearity is associated with the change in the contact area as the rolls pressed together. So a finite element model is utilized to calculate the stiffness depending on the contact between work roll- work roll and work roll- backup roll. The movement between the rolls centers due to compressive force is calculated. Knowing the mill modulus i.e., equivalent stiffness, and stiffness of rolls contact, stiffness of the stand can be calculated.
Very slight damping effect due to lubricant film present in the journal bearing of the backup rolls is reported in the literature, while no damping is assumed for the work rolls.19,34,35) A simulation program of the forced vibration is utilized to calibrate the damping coefficient. The damping value is chosen so the results of the forced vibration program matches with that of the experimental results. Then this value is used in the current program for the chatter simulation. The calculated values of the stiffness and the damping coefficients are close to the same values reported by other researches19,34,35) as the mill properties and the design of rolling stands are somewhat similar to one another.
Two main characteristics of chatter are chatter critical speed and chatter frequency. So, these parameters are used to compare the simulation and experimental results. Figure 10(a) shows the acceleration of the work roll of the second stand measured by accelerometer sensor during the third pass of the rolling for 700 seconds. It can be seen that chatter occurs in about 80 seconds after starting the process. The peak in acceleration is related to this time. Afterward vibrations were limited because of speed reduction.

Experimental measurements of acceleration of the work roll, a) during the third pass of rolling, b) at the time range of chatter.
Figure 10(a) is expanded in Fig. 10(b) at the time range of chatter. Critical speed of the first stand in the chatter condition that is recorded in the rolling system is 5.8 m/s.
FFT spectrum of the experimental measurements of acceleration is shown in Fig. 11. It shows that the peak occurs at 124.6 Hz, which is in the range of third-octave chatter frequency.

FFT spectrum of the experimental measurements of acceleration.
For better understanding of what occurs when chatter appears, the experimental measurements of acceleration signal are processed. There is considerable interest in vibration analysis and signal processing in the rolling literature.7,8,10,36,37,38) A band-pass filter is applied to acceleration signal to separate the signal related to chatter frequency from other signals. Figure 12(a) illustrates the filtered signal of acceleration of the work roll in the time range of chatter. It is clear that amplitude of the signal related to chatter frequency arises rapidly and regenerative chatter occurs in the second stand. FFT spectrum of the filtered signal is presented in Fig. 12(b). It is illustrated that this signal contains only the chatter frequency and shows the adequate operation of the filter.

Filtered signal of experimental measurements, a) acceleration of the work roll, b) FFT spectrum of the signal.
Simulation program was used with the same condition of experimental setting in order to compare the simulation and experimental results. When rolling speed is low, vibrations quickly damp out, and the system is stable. It is expected that the system goes to instability in higher speeds.2,6,15,16,18,19,39,40,41) By increasing the rolling speed, in the critical case, the vibrations do not vanish with time and remain at the same magnitude. The value of the speed in this case is considered as rolling critical speed. If the rolling speed increases more than the critical value, the rolling process becomes unstable and the vibrations are amplified in magnitude exponentially, as shown in Fig. 13(a). It can be concluded that the critical speed can be achieved from simulation program by trial and error. Calculated critical speed is 6.2 m/s. It is close to measured critical speed of 5.8 m/s. Figure 13(a) shows the strip thickness variations in the second stand in an unstable condition. FFT spectrum of the simulation results is shown in Fig. 13(b). The peak of this diagram occurs at 129 Hz. It is also in the range of third-octave chatter frequency and is in agreement with the experimental observations.

Simulation results according to second stand in an unstable case, a) Thickness variation, b) FFT spectrum of the signal.
It should be mentioned that accelerometers are robust, simple to use and readily available transducers. Measuring velocity and displacement directly is not simple. So the experimental results are based on the acceleration of the work roll. But it should be noted that the vibration is a form of movement and can be presented by acceleration, velocity or displacement. Acceleration, velocity and displacement have the same frequency; only amplitude and phase change. So the nature of the vibrations in Figs. 12 and 13 are the same and can be compared.
In order to evaluate the effect of consideration of the dynamic effects in simulation program, it was used again without considering dynamic effects using the simple static theory. Comparison of the experimental results and simulation results is summarized in Table 5.
| Case | Critical speed (m/s) | Chatter frequency (Hz) |
|---|---|---|
| Experiment | 5.81 | 124.6 |
| Simulation with dynamic effects | 6.42 | 129 |
| Simulation without dynamic effects | 6.57 | 132 |
It can be seen that the results of the simulation program are more consistent with the experimental results when the dynamic effects are considered. It should be noted that due to the damaging effects of chatter, if this is even a little earlier diagnosed, it can be important. So the small increase in the accuracy of the results can be notable. Also, it is shown previously that the effect of dynamic effect is more significant in high-frequency vibrations. So the presented method can be more useful when fifth octave chatter occurs.
In this paper, a new opinion for studying chatter in rolling is presented based on the wave propagation in elastic solids. It is witnessed that the time period of oscillation and wave transmission time in industrial rolling mills are of the same order, and therefore, a dynamic analysis is necessary to undertake the effect of traveling waves. Wave propagation theory is well matched with the results of dynamic explicit finite element method. It was implemented in a simulation program and its results were compared with the experimental measurement values. The predicted critical speed agrees with the experimental critical speed with errors within 7 percent, and predicted chatter frequency is in agreement with experimental data within 4 percent error. Signal processing was carried out by applying a band-pass filter to experimental acceleration signals, and exponential increscent of the signal that contains chatter frequency was observed.
The authors are grateful for the assistance of Mobarakeh Steel Company.