Regular Article
Recycling of Blast Furnace Dust in the Iron Ore Sintering Process: Investigation of Coke Breeze Substitution and the Influence on Off-gas Emissions
2015 Volume 55 Issue 4 Pages 758-764
Details
2015 Volume 55 Issue 4 Pages 758-764
In iron ore sinter plants blast furnace dust and other fine-grained residues which are rich in iron or carbon content are recycled. The carbon contained in the blast furnace dust can be used to replace coke breeze which is added to the charge as fuel for the sintering process. However, there is no information in the literature on the carbon replacement factor of fine-grained blast furnace dust. Nor is detailed information on the effect of blast furnace dust recycling on sinter plant off-gas emissions available. Recycling of blast furnace dust increases the zinc content of the sinter feed mixture. The degree of volatilisation of zinc in the sintering process and its discharge with the off-gas is of interest because zinc has to be limited in the burden of the blast furnace. The sinter pot tests performed in this study revealed that the carbon replacement factor of the carbon content in fine-grained blast furnace dust is very close to 1.0. The removal of sulphur contained in the sinter charge depends on the basicity of the sinter and on the total sulphur input. About 25% of the zinc contained in the blast furnace dust was volatilised in the sintering process and emitted with the off-gas.
In the integrated iron and steel making process various fine-grained residues are generated as by-products. Dust and sludge from dry and wet off-gas cleaning facilities together with the mill scale amount to about 70 to 110 kg of fine-grained residues per ton of steel.1) Materials rich in iron and carbon are usually recycled through sinter plants. However, there are constraints on the materials that can be recycled because operational problems have to be avoided in sinter plant and in blast furnace (BF) operations.2,3) The recycling is generally controlled depending on the analysis of the material4) because the recycled residues also have some effect on sinter quality, strength and productivity. In particular, the concentration of zinc and alkali metals (sodium and potassium) has to be controlled to avoid problems in BF operations5,6) and similarly the concentration of hydrocarbons must be controlled to avoid problems in the sintering plant gas cleaning system.7) Therefore, materials which contain harmful components like Na, K, Zn, Pb or oil at higher concentrations cannot be recycled through a sinter plant.
Because of the high concentration of iron, carbon and calcium and the relatively low content of harmful components in BF dust (Table 1) this residue can usually be recycled in the sinter plant.1,4) According to the Best Available Techniques (BAT) Reference Document for Iron and Steel Production8) the average rate of BF dust recycling at European sinter plants is 12.7 kg/t of sinter.
| Component | Concentration in BF dust in % (w/w) |
|---|---|
| C | 24–40 |
| Fe | 15–40 |
| Ca | 1.4–5.7 |
| Zn | 0.1–0.5 |
| Pb | 0.02–0.07 |
| Na | 0.02–0.47 |
| K | 0.20–0.80 |
| S total | 0.20–1.3 |
In the sintering process coke breeze is used as fuel to supply the thermal energy for sintering the feed material. At the start of the travelling grate, called the sinter strand, a canopy of gas burners ignites the coke breeze in the mixture. In the down-draft process, a fan draws process air through the entire length of the sinter bed into the windboxes located underneath the grate. As the sinter mixture proceeds along the sinter strand, the combustion front is drawn downwards through the mixture. This creates sufficient heat (1300°C–1480°C) to sinter the fine particles together into porous sinter. The coke breeze consumption is in the range of 44 kg to 64 kg per ton of sinter.8) The carbon contained in the recycled BF dust is also combusted during the sintering process. Thus, the coke breeze addition to the sinter feed mixture can be reduced. However, a sufficient addition rate of fuel is crucial for sinter quality and the carbon replacement factor is not known for coke with carbon of BF dust which provides sufficient performance and sinter quality figures.
An important parameter in the sintering process is the return fines ratio. A return fines ratio of 1.0 means that the production of return fines is as high as the return fines input to the feed material. If the return fines ratio is higher than 1.0 the amount of produced fines exceeds the amount of sinter return fines mixed to the feed. By increasing the fuel addition rate the strength of the sinter produced can be increased and thus the return fines ratio can be reduced.
The industrial production of sinter is a continuous process. Sinter pot tests which are batch tests are performed in the laboratory to investigate the sintering process9,10) and the emissions produced.11,12) In a study sinter pot tests were performed to investigate the carbon replacement factors for pelletized BF dust and other alternative fuels like pet coke, olivine fruit pits and wood pellets.13) The carbon replacement factor is defined as the ratio of the carbon content of the alternative fuel used (e.g. BF dust) to the carbon content of the coke breeze replaced. Only the fuel carbon is considered in this calculation while the carbonate carbon is not taken into consideration. For pelletized BF dust a replacement factor of 1.0 was found, whereas the factor was less than 1.0 for the biomass fuels. In another study pellets made of BF dust were used instead of coke breeze at various fractions at a constant addition of total carbon content.14) It was found that the strength of the mechanical properties of the sinter improved with an increasing rate of BF dust pellets added, while the productivity of the sintering process decreased. From sinter pot tests replacing coke breeze by pellets made of BF dust and BF sludge improvements in the mechanical properties of the sinter produced were also reported.15) However, in this study the productivity of the sintering process was also increased.
Zinc in the charge of the blast furnace is mainly contained in the sinter.16) The total amount of zinc in the charge is usually restricted to 100 g/t–150 g/t of hot metal produced8) because zinc can form crusts in the upper part of the furnace and accumulates in the lining of the furnace which consequently deteriorates.16,17) Zinc is also circulated inside the blast furnace by evaporation of the zinc in the lower part of the furnace, upward flow of the zinc vapour with the blast furnace gas, condensation of most of the zinc on the surface of the burden material which carries the zinc downwards, while only a fraction of the zinc leaves the furnace with the top gas. This circulation results in increased coke consumption and decreased productivity.4) If an up-cycling of zinc happens in a closed-loop system, where the BF dust is recycled to the sinter feed depends on the de-zincing capacity of the sintering process.6)
Recycling of BF dust also increases the sulphur input to the sintering process. The concentration of sulphur in the BF dust is usually in the same range as the sulphur concentration of the coke breeze. However, the carbon content of the BF dust is lower and therefore the mass of BF dust added is higher than the mass of coke breeze replaced. The rate of sulphur released to the off-gas is of great interest because the sulphur dioxide emission of sinter plants is limited and increased emissions can require a desulphurization of the off-gas. Typical sulphur dioxide emission limits for sinter plants are 500 mg/m3 (STP)18) or even less.19) Generally, the basicity of the sinter has a big impact on the incorporation of sulphur in the sinter. The higher the basicity the higher the degree of sulphur uptake by the sinter.20,21,22)
Another residue which is often recycled in the sinter plant is mill scale. The high iron content of mill scale makes it a favourite material for recycling. However, a limitation for mill scale recycling results from its oil content.1,23)
In this work sinter pot tests were performed to determine the carbon replacement factor of untreated, fine-grained BF dust and to investigate the effect of BF dust recycling on the gaseous emissions of the sintering process. Two series of sinter pot tests were performed. In the first series BF dust and mill scale were added separately to the feed material to investigate the effects of these recycling materials. In the second series both recycling materials were used simultaneously.
The concentrations of CO2 and SO2 in the off-gas were measured by an NGA gas analyser system from Emerson Process Management using an IR detector and a UV detector. The concentrations of Fetotal, SiO2, CaO, MgO, Al2O3 and K2O in the solids were determined by X-ray fluorescence spectroscopy. The concentrations of Na2O and Zn were determined by flame atomic absorption spectrometry and the concentration of Stotal was measured by infrared absorption. The sulphur content of coke and BF dust was measured according to DIN 51724-3.24)
The carbon content of the coke and the BF dust (Cfix) was calculated by subtracting the sum of the moisture content and the ash content, both measured according to ÖNORM G1074,25) and the content of volatile components, measured according DIN 51720,26) from 100%. The particle size distribution was determined using the laboratory sieve shaker with sieves from 12.5 mm to 0.125 mm. The undersize material (< 500 μm) of the BF dust was analysed using a laser diffraction instrument from Sympatec, type HELOS/RODOS.
The basicity of the sinter is calculated as the ratio of the concentration of CaO to the concentration of SiO2. The extended basicity is calculated as the ratio of the sum of CaO and MgO divided by the sum of SiO2 and Al2O3. The tumbler index was determined according to ISO 3271.27) The sieve size used was 6.3 mm.
The microscopic image of the BF dust particle was taken with a scanning electron microscope TESCAN, type VEGA LM. Further information about the chemical composition of the particle surface was obtained in combination with energy dispersive X-ray spectroscopy (SEM-EDX).
2.2. Basic Iron Ore MixtureBecause of the long period of time between the two series of tests the composition of the materials used is slightly different. The compositions of both basic ore mixtures are shown in Table 2. The concentration of Fetotal was a little higher in the second test series, whereas the concentrations of CaO, MgO, Al2O3, K2O and Stotal were considerably lower.
| Basic iron ore mixture | BF dust | |||
|---|---|---|---|---|
| First series | Second series | First series | Second series | |
| Fetotal | 62.1 | 63.8 | 32.5 | 37.0 |
| Cfix* | n.a. | n.a. | 38.7 | 19.7 |
| SiO2 | 6.01 | 5.38 | n.a. | n.a. |
| CaO | 1.55 | 0.01 | 3.1 | 10.6 |
| MgO | 0.56 | 0.01 | n.a. | n.a. |
| Al2O3 | 1.39 | 0.85 | n.a. | n.a. |
| K2O | 0.10 | 0.013 | 0.24 | 0.14 |
| Na2O | n.a. | 0.01 | n.a. | 0.16 |
| Zn | n.a. | 0.0022 | n.a. | 0.594 |
| Stotal | 0.02 | 0.004 | 0.354 | 0.57 |
n.a. not analysed
The composition of the BF dust changed from the first test series to the second series. Especially the carbon content of the BF dust used in the second series was much lower whereas the iron and the sulphur content were slightly higher. The compositions of the BF dusts used are shown in Table 2, the particle size distribution of the BF dust used in the first series is shown in Fig. 1.

Particle size distribution of BF dust and coke breeze from the first series.
In both test series similar coke breeze was used. The content of Cfix based on dry weight was 87.7% and 87.2% and the concentration Stotal was 0.59% and 0.69% in the first and the second series, respectively. The particle size distribution of the coke breeze used in the first series is shown in Fig. 1.
2.5. Mill ScaleIn the first series the oil content of the mill scale (MS) was 0.74% and the Fetotal content of the mill scale was 68.8%. The mill scale of the second series showed a higher Fetotal content (74.3%), whereas the oil content was lower (0.62%).
2.6. Sinter Pot TestsThe diameter of the sinter pot is 500 mm and the maximum height of the sinter bed is 700 mm. The suction pressure was constant –11 kPa, thus the off-gas volumetric flow results from the permeability of the mixture in the sinter pot. The sinter pot test unit is described in detail in.13,28,29)
The feed material for the reference test of the first series was prepared by adding per 100 kg of iron ore mixture 13.2 kg limestone, 38.9 kg return fines and 5.4 kg coke breeze, all values on a dry basis. The moisture content of the mixture was 4.7%. The basicity of the mixture was 1.54. For the other tests the mixing ratios were adapted under consideration of the composition of the BF dust and the mill scale.
For the reference test of the second series the reference material was prepared by adding per 100 kg of iron ore mixture 3.3 kg burnt lime, 3.0 kg limestone, 17.9 kg dolomite, 55.5 kg return fines and 6.1 kg coke breeze, all values on a dry basis. The moisture content of the mixture was 7.1%. The basicity of the mixture was 1.73. For the other tests BF dust and mill scale were added simultaneously. The mixing ratios were adapted under consideration of the composition of the BF dust and the mill scale. The blending of the various charges is summarized in Table 3.
| First series | Second series | |||||
|---|---|---|---|---|---|---|
| Reference | 10% BF | 5%MS | Reference | 6%BF + 1%MS | 10%BF + 3%MS | |
| Bssic iron ore mixture | 63.3 | 58.4 | 60.4 | 53.7 | 49.3 | 45.3 |
| BF dust | 0 | 7.2 | 0 | 0 | 4.2 | 7.0 |
| Mill scale | 0 | 0 | 3.5 | 0 | 0.9 | 2.6 |
| Coke breeze | 3.4 | 1.2 | 3.4 | 3.3 | 2.4 | 1.8 |
| Fluxes | 8.6 | 8.4 | 8.0 | 13.0 | 13.3 | 13.5 |
| Return fines | 24.8 | 24.9 | 24.7 | 30.0 | 30.0 | 29.8 |
The feed material was mixed and homogenised in an Eirich mixer type R09 for 1 minute while some water was added. Subsequently, the material was granulated for 4 minutes in a granulation drum to enhance the formation of micro-pellets which improve the permeability of the sinter bed.
When putting the charge into the sinter pot, first of all a hearth layer of about 50 mm consisting of sinter with a size of 10–16 mm was placed onto the bottom grate of the sinter pot. Afterwards the granulated sintering charge was put into the pot. At the beginning of a sinter test the suction fan was started and the ignition hood was placed over the sintering pot. For the ignition of the raw mixture the natural gas-fired burner was in operation for 90 seconds at 1240°C. After that the ignition hood was removed from the sinter pot. From the start of ignition the temperature of the off-gas and the off-gas composition were recorded. The burn-through temperature in the sinter pot test facility is measured 440 seconds after the off-gas has reached a temperature of 200°C. After the sinter pot test the sinter produced was crushed and screened.
The main data of the sinter pot tests are summarized in Table 4. The return fines ratio in the reference tests was 1.05 to 1.08. This indicates that the amount of coke breeze used in the reference mixture was not sufficient. In the first test 65% of the coke breeze was replaced by BF dust under the assumption of a carbon replacement factor of 0.7. This substitution corresponds to a net surplus of carbon contained in the fuel (coke breeze plus BF dust) of about 26%. This surplus of fuel caused the remarkable increase in the burn-through temperature of about 100°C. The resulting substantial reduction of the return fines ratio down to 0.75 is a result of the improved sintering of the material. This improvement is also confirmed by the increased tumbler index. The results clearly indicate that the real carbon replacement factor of BF dust is much higher than 0.7. This is similar to the results for pelletized BF dust reported by13) where the determined carbon replacement factor was close to 1.0. However, in this study only 10% of the carbon of the coke breeze was replaced by the carbon of the BF dust pellets.
| Reference tests | First series | Second series | ||||
|---|---|---|---|---|---|---|
| First series | Second series | 10% BF | 5%MS | 6%BF + 1%MS | 10%BF + 3%MS | |
| Carbon replacement factor | – | – | 0.7 | – | 1.0 | 1.0 |
| Coke breeze replacement; in % | 0 | 0 | 65 | 0 | 27 | 45 |
| Total Cfix relative to reference tests; in % | 100 | 100 | 126 | 100 | 100 | 100 |
| Fuel rate; g Cfix per kg of sinter | 50.8 | 48.0 | 60.4 | 49.3 | 50.3 | 53.3 |
| Burn-through time; s | 2280 | 2050 | 2090 | 2220 | 1950 | 2065 |
| Total off-gas volume; in m3 (STP) | 140 | 202 | 143 | 122 | 185 | 171 |
| Cold permeability; in m/s | 0.40 | 0.59 | 0.38 | 0.64 | 0.57 | 0.53 |
| Burn-through temperature; °C | 440 | 427 | 530 | 420 | 434 | 425 |
| Calculated productivity; t/m2 d | 33.9 | 34.6 | 39.7 | 35.7 | 36.3 | 32.0 |
| Return fines ratio out/in | 1.08 | 1.05 | 0.75 | 1.03 | 1.03 | 1.16 |
| Tumbler index (> 6.3 mm); % | 72.2 | 72.7 | 77.3 | 75.2 | 70.6 | 73.0 |
The addition of mill scale caused no change in the burn-through temperature. The return fines ratio was also nearly unchanged. The improved tumbler index may be explained by the coarse structure of the mill scale which might support agglomeration.
In the second series a carbon replacement factor of 1.0 was used for the BF dust. As might be expected the measured burn-through temperature was unchanged in comparison to the reference test. The resulting average return fines ratio was slightly increased whereas the average tumbler index was slightly reduced. Thus, the carbon replacement factor of fine-grained BF dust is slightly below 1.0.
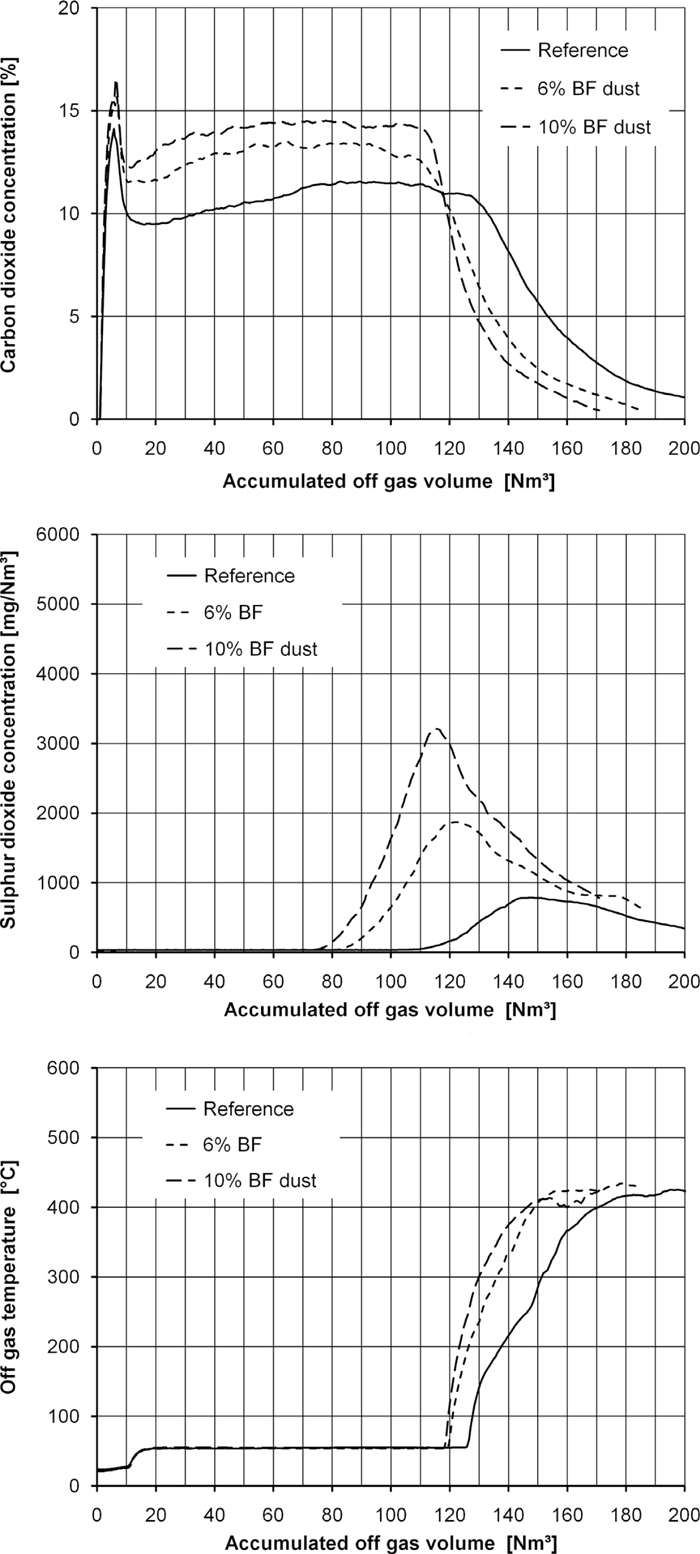
3.2. Sulphur Dioxide and Carbon Dioxide EmissionsThe emission of sulphur with the off-gas is not constant during a sinter pot test. The concentration of SO2 in the off-gas is shown in Fig. 2. On the left the course of the concentrations of CO2 and SO2 are shown. On the right the concentrations are shown as a function of the off-gas volume produced. Thus the area under these concentration curves represents the emitted amount of the components. The higher total emissions of CO2 and SO2 in the test with BF dust recycling caused by the higher input of C and S are clearly visible in these diagrams.

Carbon dioxide, sulphur dioxide concentration and off-gas temperature as a function of the time (left) and as a function of the cumulative off-gas volume (right) for the first test series.
The maximum of the SO2 peak is shortly after the carbon dioxide concentration starts to descend. This is similar to the behaviour in real sinter plants.30) The addition of BF dust led to accelerated combustion with higher CO2 concentration for most of the time of the test and an earlier downward curve in the CO2 concentration. The same behaviour was shown by the SO2 concentration where both the rise in SO2 concentration and the SO2 peak concentration are earlier when BF dust is in the mixture. Also the rise in off-gas temperature stars earlier. In the second test series these results were confirmed (Fig. 3). A probable explanation for the acceleration of the combustion in the tests with BF dust recycling is the grain size of the fuels. The mass mean diameter of the BF dust is only a fifth of that of the coke breeze (Fig. 1). This results in a much larger value of the specific surface area of the BF dust and in faster combustion.
Carbon dioxide, sulphur dioxide concentration and off-gas temperature as a function of the cumulative off-gas volume for test series 2.
The total SO2 emissions and the average SO2 concentrations are summarized in Table 5. On the left in Fig. 4 is the mass of sulphur fixed in the sinter produced (sinter plus return fines) as a function of the specific sulphur input which is calculated from the total input of sulphur divided by the sinter produced (sinter plus return fines). As expected, the basicity of the sinter mixture strongly influences the fixation of sulphur in the sinter. But the mass of sulphur fixed in the sinter only slightly increases with increasing sulphur input.
| Reference tests | First series | Second series | ||||
|---|---|---|---|---|---|---|
| First series | Second series | 10% BF | 5%MS | 6%BF + 1%MS | 10%BF + 3%MS | |
| Total S input in g | 110 | 126 | 140 | 110 | 159 | 184 |
| Total SO2 emission with the off-gas in g | 107 | 50 | 156 | 106 | 115 | 155 |
| Total S input in g/kg charge (dry) | 0.53 | 0.60 | 0.68 | 0.53 | 0.77 | 0.89 |
| Total S fixed in the sinter in g/kg charge (dry) | 0.27 | 0.48 | 0.30 | 0.27 | 0.49 | 0.52 |
| Total SO2 emission with the off-gas in g/kg charge (dry) | 0.51 | 0.24 | 0.76 | 0.51 | 0.56 | 0.75 |
| Specific off-gas volume; in m3 (STP) per t of sinter * | 1050 | 1520 | 1010 | 890 | 1440 | 1390 |
| Average SO2 concentration in mg/m3 (STP) ** | 760 | 250 | 1090 | 870 | 620 | 910 |

Sulphur fixed in the sinter produced; left: mass of sulphur; right: fraction of sulphur input.
In Fig. 4 on the right the fraction of the sulphur fixed in the sinter produced is shown as a function of the specific sulphur input. The higher the basicity the higher is the fraction of sulphur which is fixed in the sinter. For the same basicity the fraction of sulphur fixed in the sinter decreases with the sulphur input. In comparison with the reference tests 85% ± 5% of the additional sulphur input caused by the BF dust addition was discharged with the off-gas as SO2. The amount of sulphur fixed in the sinter produced in the reference tests as a function of the extended basicity is shown in Fig. 5. A linear extrapolation of the measured results would indicate that at a basicity of 1.0 almost no sulphur would be fixed in the sinter.

Sulphur fixed in the sinter produced as a function of the basicity.
In the second test series the volatilisation of Zn during the sinter pot test was investigated. The mass of Zn in the various fractions of the charge and the product is summarized in Table 6. The Zn discharge with the off-gas was calculated from the Zn balance. In the reference test the Zn concentration of the charge was 0.005%. That is at the lower end of the typical range of the Zn concentration in the sinter charge of 0.007 to 0.02%.8) Practically no Zn was discharged with the off-gas of the reference test because the mass of Zn in the produced sinter and sinter fines was the same as the mass of Zn in the charge. In the tests with BF addition the Zn input was much higher due to the high Zn content of the BF dust. The Zn output with the product was higher too. Assuming, based on the result from the reference test, that the Zn discharged with the off-gas was all from the added BF dust, an average volatilisation of Zn contained in this dust of 24.5 ± 2.5% was calculated.
| Reference test | 6%BF + 1%MS | 10%BF + 3%MS | |
|---|---|---|---|
| Zn input excluding BF dust; in g | 11.0 | 10.9 | 10.9 |
| Zn input with BF dust; in g | – | 51.2 | 85.3 |
| Zn output with sinter + return fines; in g | 11.0 | 48.8 | 77.0 |
| Zn discharge with the off-gas; in g | – | 13.3 | 19.2 |
| Fraction of the additional Zn input by the BF dust discharged | – | 26% | 23% |
In a study on the reduction of ZnO by CO at high temperature31) the process conditions deviated considerably from the conditions in the sintering process. In an atmosphere of 80% CO2 and 20% CO it was shown that for ZnO contained in iron ore pellets the reduction reaction in the temperature range of 950°C to 1100°C is controlled by the interfacial chemical reaction. The time required for volatilisation of a fraction of 25% of the Zn at a temperature of 1100°C was approximately 5 min. In the sintering process the temperature maximum which is reached in the material for some minutes is about 1350°C, the CO concentration is only about 1% and the oxygen content is about 14%.8) Thus, the reported results are not really applicable for the sintering process. However, they indicate that reduction of ZnO requires some time.
The volatilisation of Zn in the sinter process depends on the form in which the Zn is present. In the BF dust the Zn is present as an oxide.6,32) In the blast furnace, Zn is volatilised and when the top gas cools down it forms fine ZnO particles.8) Figure 6 shows an image of a BF dust particle with a large number of small deposits on its surface. The fraction of zinc on such a deposit (Spektrum 4) measured by SEM-EDX was 14.5%, which is a multiple of the Zn concentration in the BF dust of approximately 0.6%. The Zn in the BF dust is concentrated on the surface of the particles where it is more accessible for volatilisation during sintering compared to Zn which is contained in the iron ore particles.

Scanning electron microscope image of a BF dust particle.
The sinter pot tests showed that recycling of BF dust to the sintering process can be used to replace solid fuel. The carbon contained in the BF dust effectively replaces coke breeze as fuel, the carbon replacement factor of the fine-grained BF dust was very close to 1.0. However, the BF dust also increases the sulphur input. The mass of sulphur fixed in the sinter depends on the basicity of the sinter but is almost independent of the amount of sulphur input. From the additional sulphur input caused by the BF dust recycling, 85% ± 5% of the sulphur is emitted with the off-gas as sulphur dioxide. The zinc contained in the iron ore was hardly reduced in the sinter pot test. The zinc contained in the BF dust was discharged with the off-gas to an extent of about 25%. This rate was nearly independent of the zinc input. Further sinter pot experiments are required to study the described effects in more detail.
The financial support of K1-MET is acknowledged. K1-MET is a member of COMET – Competence Centers for Excellent Technologies and is financially supported by the BMVIT (Federal Ministry for Transport, Innovation and Technology), BMWFJ (Federal Ministry of Economy, Family and Youth), the federal states of Upper Austria, Styria and Tyrol, SFG and Tiroler Zukunftsstiftung. COMET is managed by FFG (Austrian research promotion agency). The performance of the sinter pot tests and the laboratory analyses by voestalpine Stahl GmbH are gratefully acknowledged. We also want to thank Mr. P. Orgill for proof-reading and Mr. M. Gillich for the preparation of the scanning electron microscope image.