Regular Article
Camber Regulation in Rough Rolling Process Using Wedge Estimation of Incoming Bar
2015 Volume 55 Issue 4 Pages 851-857
Details
2015 Volume 55 Issue 4 Pages 851-857
In this paper, a new algorithm to reduce camber based on an estimated entry-side wedge of the bar during rough rolling process is proposed. The entry-side wedge is estimated based on a simple mathematical model with the aids of the tangent vector variation and curvature, which can both be obtained using the measured bar centerline. The differential roll gap between drive-side and work-side was then adjusted to minimize the delivery-side curvature of the bar using this estimated entry-side wedge information. A three-dimensional simulator that describes a rough rolling process was constructed using FEM (Finite Element Method). The effectiveness of the proposed scheme was validated using FEM simulation combined with the proposed camber reducing algorithm.
The medium size bar, which will be sent to a finishing mill, is produced through rough rolling process in hot rolling process. This rough rolling process usually produces a bar that has longitudinal bending (camber) that may cause the bar to develop defects such as strip edge folds, scrapes and telescoped coils. A curved bar is also dangerous because it may strike and damage the side of the process line; such events can cause production stoppages. Therefore, the camber should be reduced. In many literatures, it is revealed that the main causes of the camber are bar wedge, temperature difference of the bar between drive-side (DS) and work-side (WS), side-slipping of the bar, and mill tilt. Moreover, it is also observed that the camber generation increases when two or more of these factors are combined.
Manual camber regulation, which generates a slight differential roll gap between DS and WS is usually adopted in most rough rolling processes, but this scheme needs skilled operators and cannot guarantee stability of the rolling process. Therefore, an automatic camber reducing scheme is required.
The process of designing a controller requires a simple but accurate mathematical model that can explain the behavior of the bar under rough rolling condition. Although a dynamic relation between strip and rolling system has been derived1) and various modern control schemes2,3,4,5) have been applied based on this model, most of the applications focused on reducing side-slipping for the finishing mill process. This focus was inevitable because the mathematical model describes the behavior of a finishing mill instead of that of actual roughing mill. Therefore, few papers have considered camber reducing schemes for a roughing mill.
An early study of the irregular longitudinal shape of the strip during the rolling process introduced by Nakajima et al.1) In this work, a mathematical model describing side-slipping of the strip was introduced. Although use of this model reduced the camber of the strip by preventing the occurrence of side-slipping, a strip that already had camber could not be corrected. A more-advanced camber reducing scheme that reduces the delivery-side strip curvature to zero was introduced6,7) based on the mathematical model. This scheme requires the wedge information of the incoming strip and is therefore suitable in a reversing mill because the wedge of an incoming strip or plate can be measured in the previous rolling pass, but this scheme cannot correct the camber generated during the first rolling pass. Therefore, it is easy to guess that the camber reducing scheme that can be applied in the first rolling pass is advantageous. Jeong et al.8) suggested a camber reducing scheme which can also be applied in the first rolling pass by adopting an output feedback fuzzy controller that uses simple empirical rules. In this study, a FEM simulation was combined with the fuzzy controller to verify the scheme’s effectiveness. A local bending of the bar, which is assumed to be measured, in the current rolling pass is used because obtaining an appropriate mathematical model for camber generation under rolling conditions is a very difficult task. Due to the nature of fuzzy logic, the controller must be designed carefully based on the results of repeated experiments before it can be applied to a real plant.
To our knowledge, the model in 7) seems to be a reasonable example that has been adopted in real commercial plants until now, so it is very interesting from a practical point of view. A delivery-side wedge is usually expressed by a somewhat complicated equation that includes various parameters such as rolling load at DS and WS, mill constant at DS and WS, roll-gap difference, work-roll crown, and side-slipping. This equation was modified to a function of several variables such as rolling load difference, roll-gap difference, side-slipping and an additional term with correction coefficients to describe the actual delivery-side wedge well. Because this delivery-side wedge can be affected by some factors that have not been considered, repeated experiments are required to obtain an accurate model. Although the entry-side wedge information should be available in determining the aimed delivery-side wedge that eliminates delivery-side curvature, the value obtained from the model for the delivery-side wedge in the previous rolling pass is used. After determining the aimed delivery-side wedge, only the roll-gap difference is adjusted using a simple PI controller to eliminate the error between aimed delivery-side wedge and the current wedge.
The accuracy of the above camber-reducing scheme is mainly dependent on the accuracy of the wedge observation model, which should be adjusted by repeated experiments. If this wedge observation could be obtained without adopting the complex equation which was derived based on the complex dynamic relation between the strip and the rolling system, this scheme can be more-easily applied to a real plant. To be more practical than the above case, the camber-reducing scheme should also be applied in the first rolling pass by providing the current entry-side wedge information.
In this paper, a new wedge estimation scheme that can also be applied in the first rolling pass is proposed. The current entry-side wedge is estimated based on a simple mathematical model with the aids of the tangent vector variation and curvature which can be obtained using the measured bar centerline. This estimated entry-side wedge information is used to adjust the differential roll gap between DS and WS to minimize the delivery-side curvature of the bar. The accuracy of the proposed camber-reducing scheme was validated using three-dimensional FEM simulation of a rough rolling process combined with the proposed controller.
The rest of this paper is organized as follows. A method to reconstruct strip centerline using curvature information is suggested in Section 2. A method to estimate the entry-side wedge of the strip and a simple control rule for camber reduction based on the entry-side wedge information are introduced in Section 3. The configuration of the FEM simulator is described in Section 4. Simulation results are given in Section 5, and a conclusion is represented in Section 6.
Figure 1 shows top view of the rough rolling process with the cross section of the strip at entry and delivery side. The strip is fed into the roll at constant speed v1 at the entry side; the delivery-side speed is v2. The longitudinal direction, transversal direction of the strip, and center of the roll are designated as x-axis, y-axis, and origin, respectively. The head end part of the bar has largest x direction value whereas the tail end part has smallest x direction value. Side-slipping is represented as an off-center value which is defined as the distance between the centerline of the strip and the center of the roll. On the other hand, camber is defined in various ways. In this paper, camber is defined as the maximum distance between the centerline and the line that connects its two ends (Fig. 1).
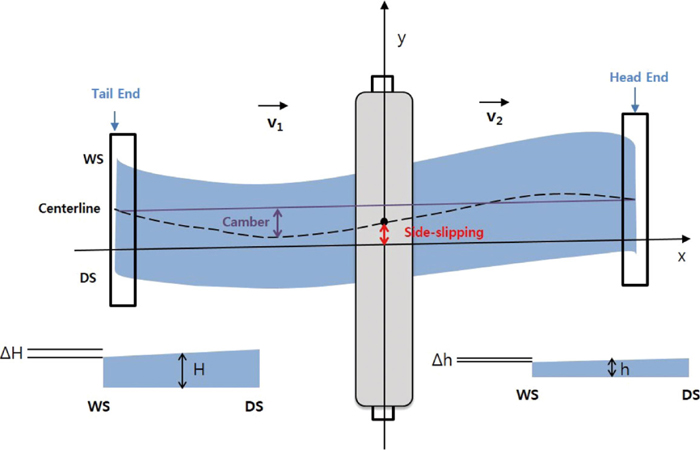
Definitions of side-slipping and camber. (Online version in color.)
A curve can be reconstructed if curvatures at all points on it, the initial tangent vector, and the initial normal vector are known. Assuming that the longitudinal shape of the bar can be represented as its centerline, the shape of the bar after rolling can be estimated using a mathematical model that predicts curvature at the delivery side.
The Frenet-Serret9,10) formula shows how the tangent and the normal vector at each point are correlated. If the outgoing bar curves due to asymmetric factors such as uneven temperature distribution and an entry-side wedge, then the centerline of the bar at time t is represented by the trajectory γ(t). Then, γ(t) = (x(t), y(t)), where x(t), y(t) represent 2D coordinates such that the first and second derivatives exist and are continuous. Figure 2 shows trajectory of γ(t), unit tangent vector and normal vector at arbitrary time t. The arc length of the trajectory γ(t) from t0 to t is defined as
| (1) |
| (2) |
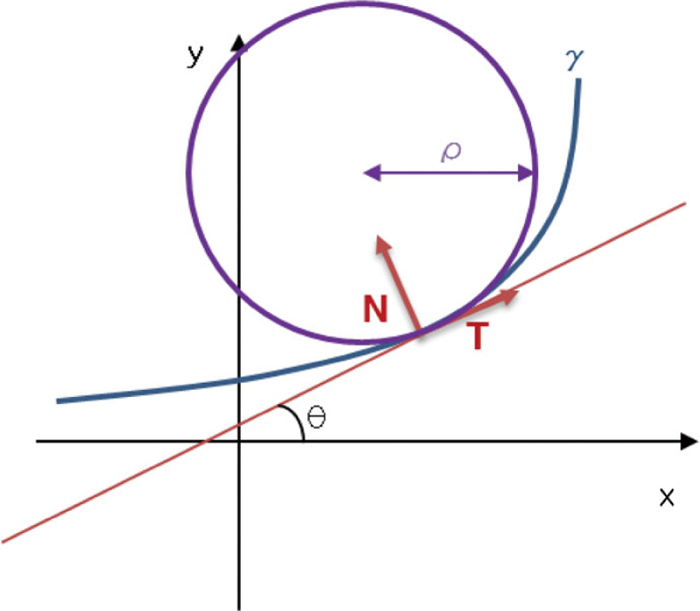
Tangent T and normal N vectors of centerline. (Online version in color.)
When the curve is represented as γ(t), the instantaneous velocity at the particular point is given by a unit vector and called tangent vector. It can be found as
| (3) |
The unit vector that points out the direction of the tangent vector change is called normal vector and defined as
| (4) |
| (5) |
The curvature κ
| (6) |
When θ≈0 tangential angle and curvature can be approximated as
| (7) |
| (8) |
The Frenet-Serret formulas (Eq. (9)) describe how the tangent and normal vector of the curve change due to curvatures
| (9) |
The purpose of camber control during rough rolling process is to ensure that the bar is straight at the delivery side. The tangent vector of the centerline of the bar is the slope, which determines the location of the next point. Therefore, to make a straight bar, the tangent vectors of all points should be the same. From the definition
The mathematical model of delivery-side curvature 1/ρ2 depends on entry-side curvature 1/ρ1 and wedge ratio Δψ as7)
| (10) |
| (11) |
Eqs. (10) and (11) both include entry-side curvature and wedge ratio. When there is no front or back tension, ξ is 1/λ2 and the two equations are identical. In this paper, Eq. (10) is used as the basis of a control algorithm that eliminates curvature at the delivery side.
Tanaka et al.7) proposed a control algorithm for reversing type mill which makes roll gap difference based on Eq. (10). Aimed delivery-side wedge that eliminates delivery-side curvature zero is calculated. Although the entry-side wedge of the bar is essential information for the control algorithm, this wedge is difficult to measure because the measurement device is usually located behind the last rolling mill. This algorithm eliminates this problem by using a wedge observation model that calculates delivery-side wedge from roll gap difference, rolling load difference, side-slipping, additional term with correction coefficients. This model must be obtained by conducting repeated experiments. The delivery-side wedge calculated in the previous rolling pass is regarded as entry-side wedge in the current rolling pass.
However, this idea cannot be adopted in a typical rolling process because acquiring information of entry-side wedge is very difficult. For example, if the rough rolling process uses sizing press in front of the first rolling mill, entry-side wedge is generated due to temperature difference between DS and WS at the sizing press, so the control algorithm is not applicable because there is no way to guess entry-side wedge. Therefore, in this paper, an alternative on-line algorithm that estimates entry-side wedge from the measured tangent vector change was designed.
Figure 3 shows the configuration of the rough rolling process. Two measurement devices are assumed to be located at entry and delivery side 1 m away from the roll. Measurement is conducted using machine vision.12,13,14) The measurement devices consist of CCD cameras that take photographs of a fixed region of the run-out table. An image processing algorithm is used to extract the centerline of the bar from the photographs. Because the measurement devices are located away from the roll, the measured centerline of the delivery side is the one that passed hundreds of milliseconds before.
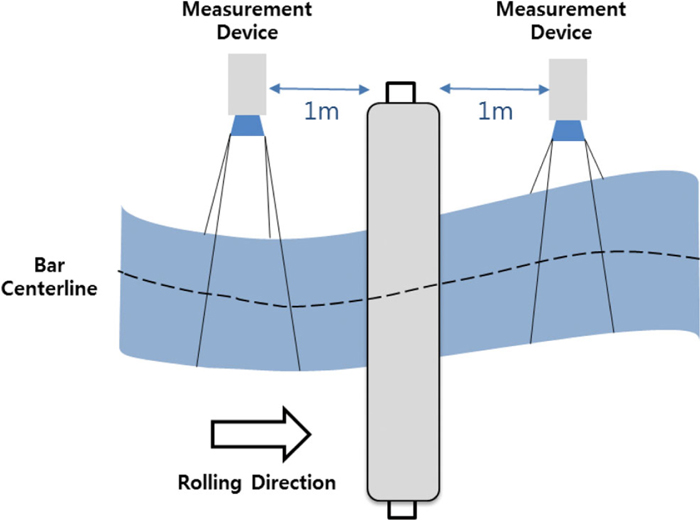
Configuration of roughing mill process. (Online version in color.)
The relationship between curvature and the time derivative of tangential angle dθ/dt can be represented as
| (12) |
Among factors that affect the longitudinal shape of the bar, only its curvature is changed during rolling process. The tangent vectors of the points on the curve can be represented using entry-side and delivery-side curvatures (Eq. (9)) because the curvature at the rolling point is changed due to rolling.
Tangent vectors of the points on the curve change when curvature at a specific point on the curve changes (Fig. 4). If the centerline of the bar is composed of k points then the tangent vector at the jth point on the centerline could be represented as
| (13) |
| (14) |
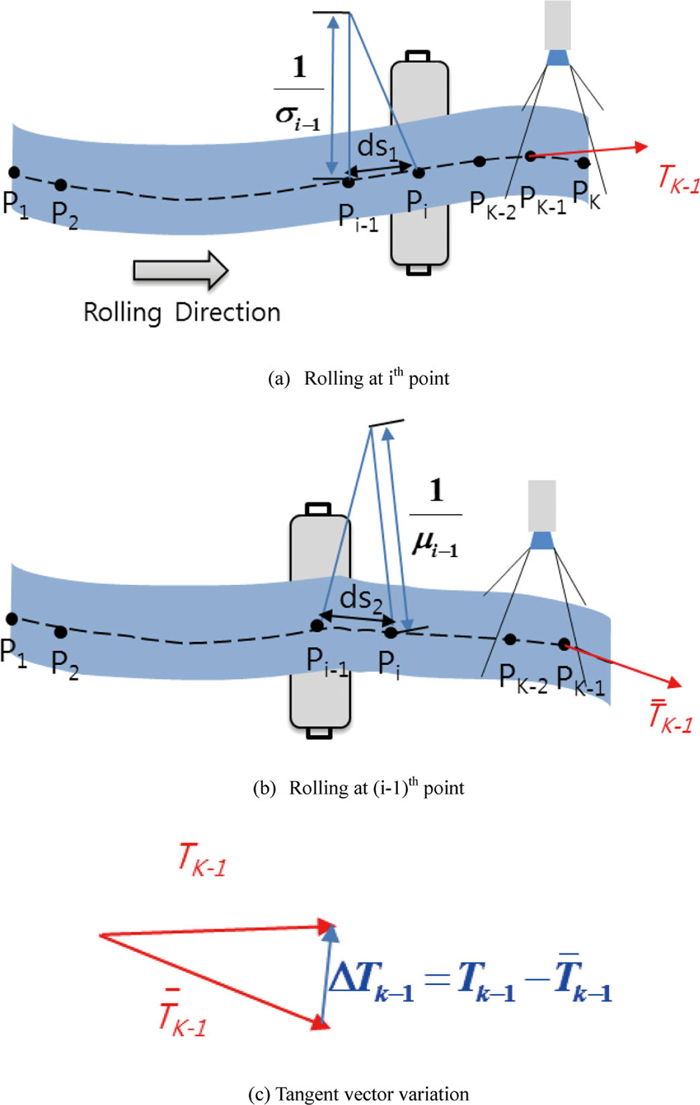
Effect of rolling to tangent vector. (Online version in color.)
In addition, curvature change due to rolling at the (i–1)th point changes the tangent vector at the (k–1)th point of the bar (Fig. 4(b)):
| (15) |
As a result, the y component of tangent vector change due to rolling at the (i–1)th point is
| (16) |
Given the information of curvature before rolling, Eq. (16) can be used to directly calculate the curvature at the delivery side by measuring the change in the tangent vector due to rolling. 1/ρ1 and 1/ρ2 in Eq. (10) can be replaced by σ and μ, respectively in Eq. (16). After substitution, the entry-side wedge can be estimated by rearranging Eq. (10) to
| (17) |
In practice, a camber measurement device observes a fixed region of the centerline at the delivery side away from the roll. Thus, we cannot use measured delivery-side curvature in the estimation method because it has measurement time delay. However, tangent vector change can be directly calculated from the measured centerline of the bar, which is away from the roll.
The best policy for camber control is to eliminate curvature at the delivery side at all times. Although information of the entry-side wedge of the bar is not available, we can estimate this wedge using measured tangent vector change and Eq. (17). As a result, aimed wedge at the delivery side that minimizes delivery-side curvature can be obtained as
| (18) |
An FEM simulator was constructed using commercial FEM software DEFORM 3D (Scientific Forming Technologies, Inc.), which is known as powerful simulation system, especially for complex metal forming processes. DEFORM 3D supports commands based on a DOS interface so that information can be extracted and settings can be changed during simulation. As a result, extracted simulation results can be used to calculate control inputs in MATLAB, which can be applied to change the roll gap difference in the FEM simulation at each time step.
The FEM simulator for the hot rolling process was composed of three objects: roll, bar, and pusher; to reduce simulation time, the lower side of bar was assumed to be mirror-symmetric, and only one lateral half of the bar was considered (Fig. 5(a)), and unnecessary components of the rough rolling process (e.g., mill housing, back up rolls, side guides, cooling machine, and run out table) were omitted because deformation of the bar is mainly due to the interaction between bar, work rolls and back up rolls. The bar was assumed to be rigid plastic steel because the effect of the elasticity can be neglected when the bar is thick enough. The roll was assumed to be rigid steel; therefore, the roll was not deformed, so the thickness of the bar was almost equal to the roll gap.
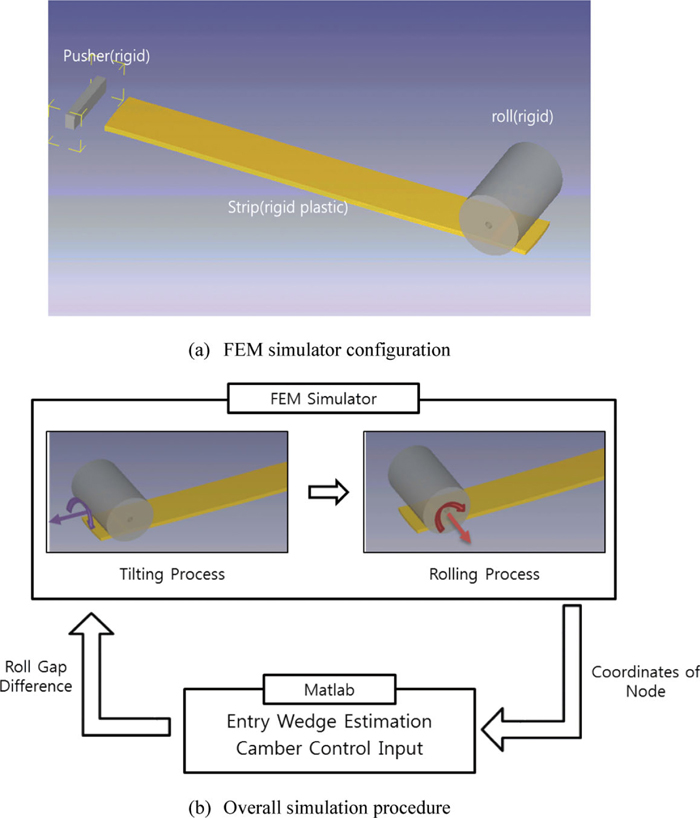
FEM simulator configuration. (Online version in color.)
The shear friction coefficient between the bar and the roll was set as 0.7. The temperature of the bar was set as 1200°C and the temperature of the roll was set as 20°C. The bar was considered to be AISI 1015 steel. The pusher pushed the bar until it was bitten by the roll. Specifications of bar and roll (Table 1) were obtained from the actual rough rolling process in a steel company (POSCO).
| Quantity | Value |
|---|---|
| Entry-side strip thickness | 105 mm |
| Delivery-side strip thickness | 85 mm |
| Entry-side strip velocity | 1500 mm/s |
| Delivery-side strip velocity | 1853 mm/s |
| Length of the strip before rolling | 9166 mm |
| Length of the strip after rolling | 11113 mm |
| Width of the strip | 1200 mm |
| Number of nodes of cross section | 138 |
| Number of nodes along length direction | 301 |
| Radius of roll | 650 mm |
| Width of roll | 2080 mm |
The bar was composed of 33000 hexahedral elements, and 41538 nodes with 301 layers of cross sections which are each composed of 138 nodes; 301 nodes in the mid-width of the bar on its upper side were chosen as the points that defined the centerline of the bar. Least squares regression was used to fit a 10th-order polynomial to the centerline. This polynomial was used to calculate the curvatures and tangent vectors.
To make test bars that had curved entry-side wedge, a straight rectangular bar was rolled with time-varying roll gap difference. To verify the effectiveness of the proposed control algorithm, two test bars were produced in this way: The Test Bar 1 had ‘S’ shape (Fig. 6(a)) with 2.5 mm maximum entry-side wedge (Fig. 7(a)). The Test Bar 2 had ‘C’ shape (Fig. 6(b)) and 3.5 mm maximum entry-side wedge (Fig. 7(b)).
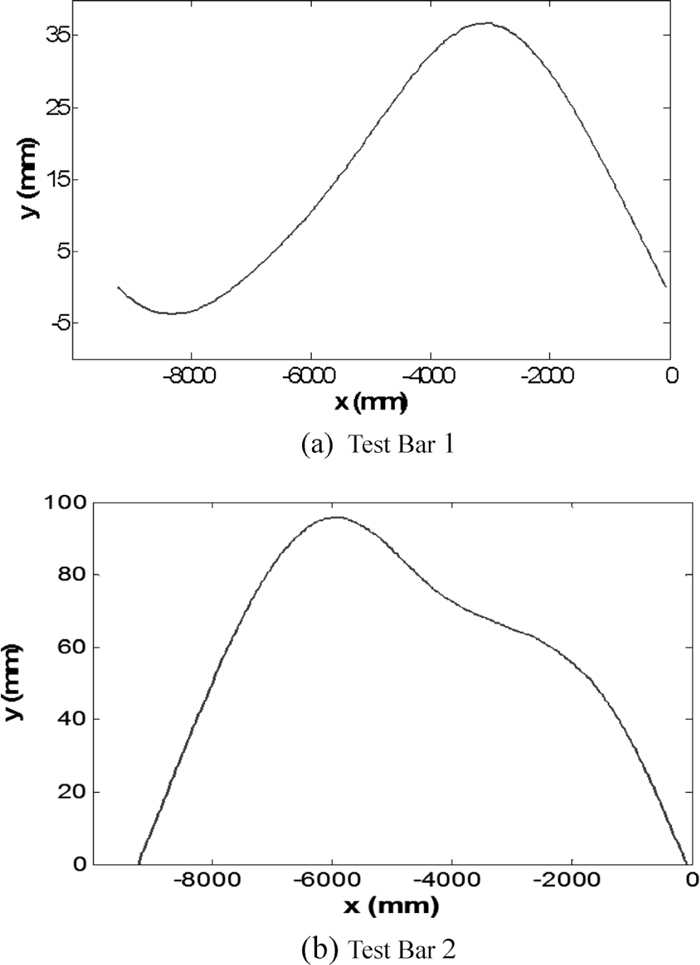
Centerline of test bars before rolling.
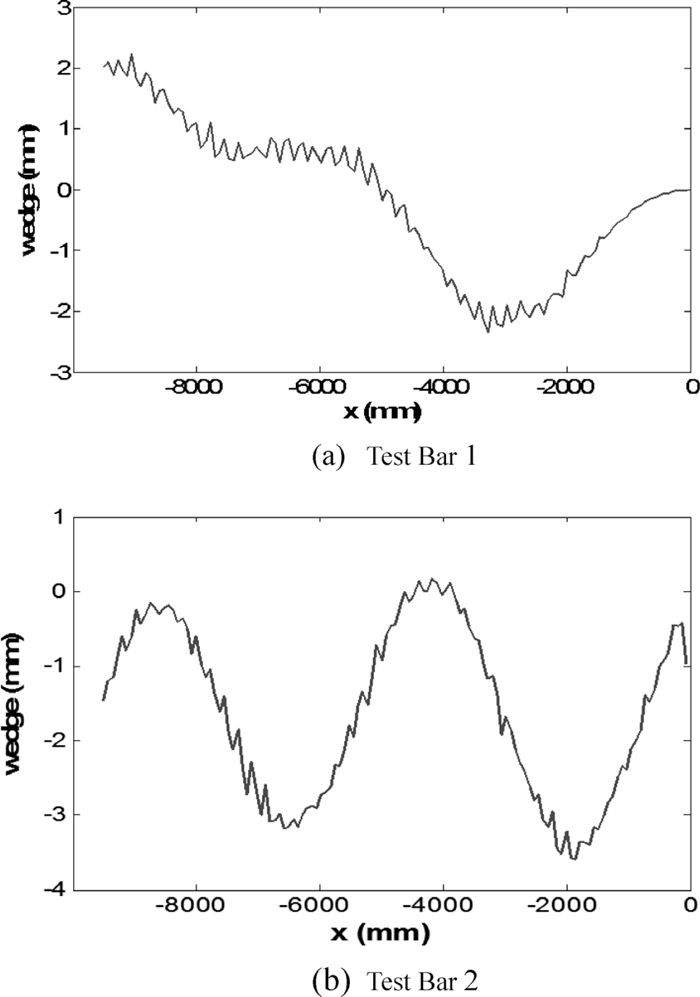
Entry-side wedge of the test bars.
The device to measure camber was assumed to photograph a fixed region 1 m after rolling point (Fig. 3); consequently, no measured information for centerline of the bar at the delivery side is obtained until the head end part of the bar arrives at the point 1 m after the roll. During this time, the entry-side wedge to calculate the corresponding control input is assumed to be zero. Because the measurement device photographs a fixed region, we measured tangent vector change in the region in which the measurement device is assumed to be located.
Overall simulation consisted of 130 steps: each described 0.05 s of a rolling process with linear roll speed 1700 mm/s. Each step included a tilting process and a rolling process (Fig. 5(b)). During the tilting process, the roll gap difference was adjusted according to the control signal from MATLAB; during this process, the roll was not rotating. During the rolling process, rolling was performed for 0.05 s with an altered roll gap difference. After the rolling process, information of coordinates of nodes was extracted to calculate the camber, curvature, and tangent vector. The estimation of entry-side wedge (Eq. (17)) and controller input (Eq. (18)) is generated with the aid of these measured information in MATLAB. The controller input was used to change the roll gap difference in the next tilting process to minimize generation of camber.
Camber generation is minimized when curvature at the delivery side is zero. The ideal control algorithm adjusts the roll gap difference to eliminate curvature at the deliver side with the aid of Eq. (10). Although the proposed control algorithm also adjusts the roll gap difference based on Eq. (10), it uses the estimated entry-side wedge of the bar instead of the real one.
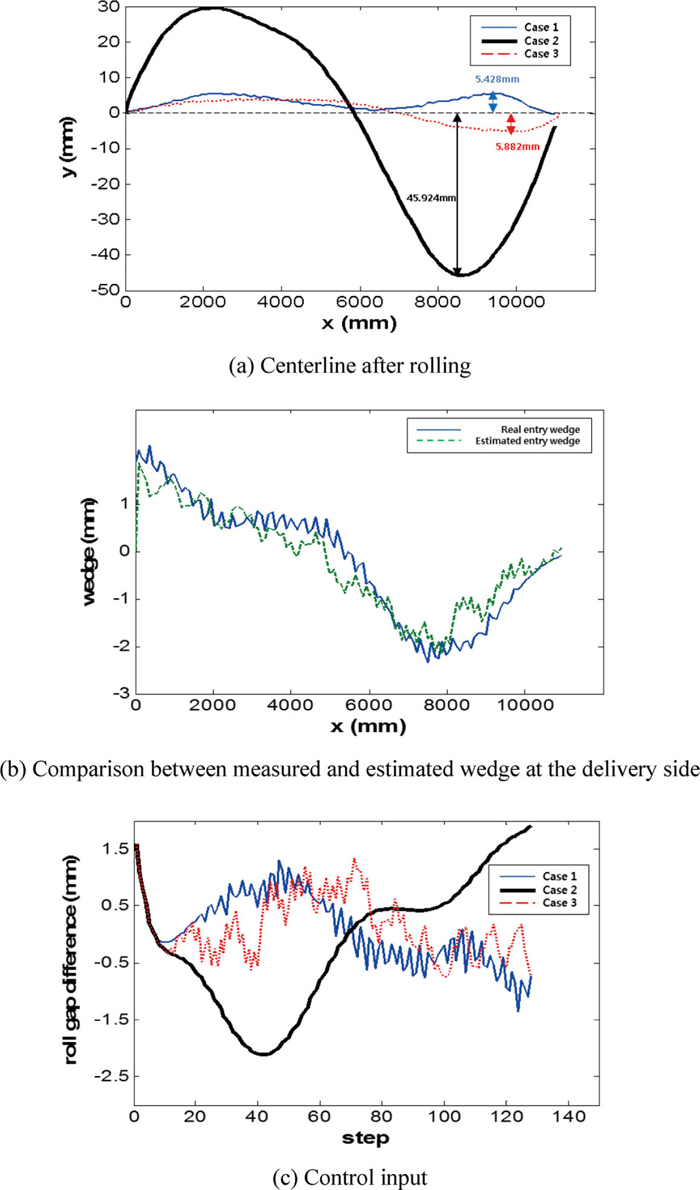
Three cases were compared by simulation for each test bar. Case 1 was ‘Control with real entry-side wedge’ that applied Eq. (10) using the exact value of the entry-side wedge. Case 2 was ‘Control without real entry-side wedge’ based on Eq. (10) without knowing entry-side wedge of the bar, i.e., the entry-side wedge was assumed to be zero. Case 3 was ‘Control using estimated entry-side wedge’ based on Eq. (17) with measured tangent vector change.
The three controller cases were applied to Test Bar 1 that had 35.736 mm camber (Fig. 6(a)) with ‘S’ shape and 2.5 mm maximum entry-side wedge (Fig. 7(a)). Camber was reduced to 5.428 mm when the controller of Case 1 is adopted. Likewise, camber was reduced to 5.882 mm when the controller Case 3 is adopted (Fig. 8(a)). However, centerline of Case 2 deviated by up to 45.924 mm from the center of the roll, and also formed serious ‘S’ shape (Fig. 8(a)). Because the estimated entry-side wedge in Case 3 was very similar with the real entry-side wedge (Fig. 8(b)), camber reduction by the control algorithm of Case 3 was similar to that of Case 1 (Fig. 8(c)).
Simulation results for Test Bar 1 after rolling. (Online version in color.)
Test Bar 2 which had 95.751 mm camber (Fig. 6(b)) with ‘C’ shape and maximum 3.5 mm entry-side wedge deviation (Fig. 7(b)) was also simulated according the above three cases. The centerlines of the bar for the Case 1 and Case 3 had camber 15.177 mm and 14.872 mm respectively. However, for the Case 2, centerline of the bar deviated by up to 128.011 mm (Fig. 9(a)). Figure 9(b) shows the estimated entry-side wedge which was similar to real entry-side wedge. As a result, control input of Case 3 showed similar tendency with the one of Case 1 (Fig. 9(c)).
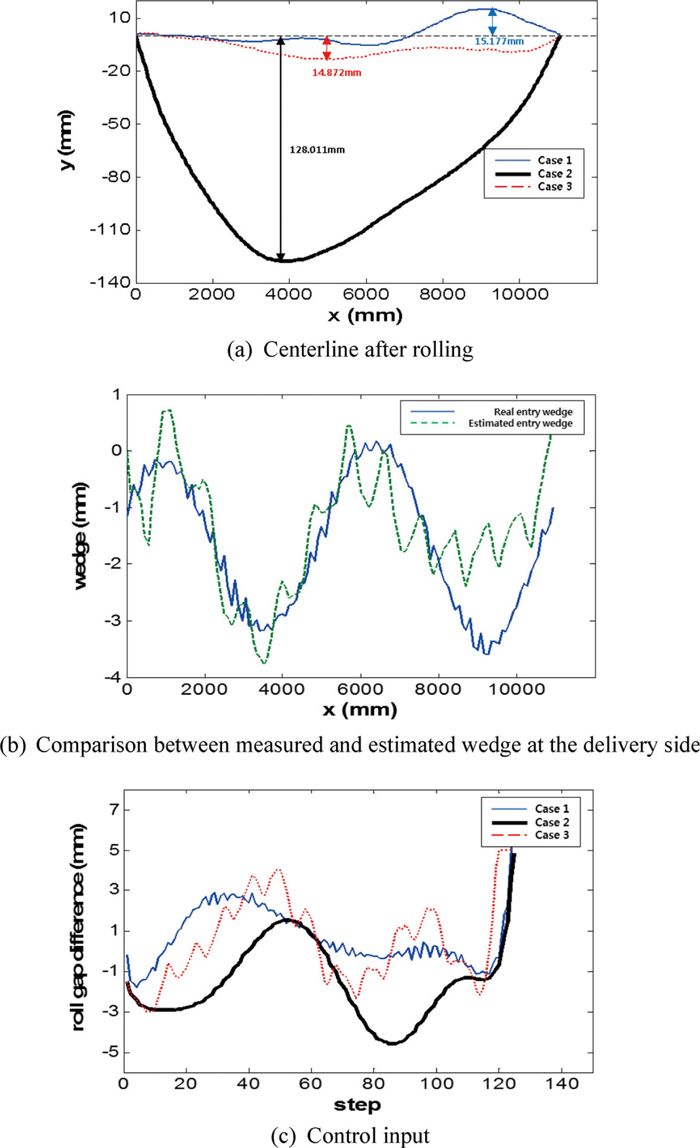
Simulation results for Test Bar 2 after rolling. (Online version in color.)
Only the head parts of centerlines were different; this is due to the estimation before simulation step 40 (Figs. 8(c), 9(c)) was inaccurate. Because the head end part which was rolled first didn’t arrive in the region that measurement devices are located, until 10 steps were passed, no measurement data was obtained during this time. As a result, estimates were inaccurate during this period.
A control algorithm that uses estimated entry-side wedge information to reduce camber generation was proposed for the rough rolling process in steel making. The wedge estimation scheme based on a simple mathematical model with the aids of the tangent vector variation and curvature of the bar was introduced.
To evaluate the effectiveness of the proposed control algorithm, an FEM rolling simulation combined with the proposed control scheme was conducted. FEM simulation results showed that the proposed method estimated the entry-side wedge of the bar successfully, and the control algorithm based on the estimated entry-side wedge reduced camber by almost as much as the algorithm that uses real information about the entry-side wedge.