Abstract
Increased gas utilization and improved permeability have been desired in order to achieve low RAR (Reducing Agent Rate) operation of blast furnace. Coke mixed charging in the ore layer is one effective measure for realizing these improvements. In this research, burden distribution control technique for mixing small coke at a parallel type bell-less top and at a center feed type bell-less top were developed and investigated in an experiments with scale models of two actual blast furnaces at JFE Steel. The mixed coke ratio was controlled by the discharge pattern of the mixed small coke and the mixing position. With the center feed bell-less top, the optimum patterns was discharge of the small coke from the coke bin after discharge of the ore, and the parallel type bell-less top, the optimum pattern was discharge of the small coke on the ore at the front of an overlapped quarter part. These patterns were applied to two actual blast furnaces, and improvement of permeability was confirmed as a result of increased mixed small coke ratio.
1. Introduction
In recent years, reducing the amount of CO2 generated in the ironmaking process has become an important problem from the viewpoint of preventing global warming. Low reducing agent rate (RAR) operation of the blast furnace is an effective measure for reducing CO2 generation,1) but in addition, demand for low coke rate (low CR) operation is also growing from the viewpoints of cost competitiveness and extension of coke oven life. High productivity operation with low RAR (low CR) will seem to be a target in the near future, as sings of increased production have been seen since the Lehman Shock in 2008.
In low RAR (low CR), high productivity operation, in addition to controlling the heat balance in the blast furnace, preserving gas permeability is also important. Particularly, however, the largest issue is improvement of the gas permeability in the cohesive zone, where the largest pressure drop in the blast furnace occurs. Highly precise burden distribution control has been applied as a measure for improvement of gas permeability in the cohesive zone. Examples include improvement of the high temperature quality of the raw materials and reducing agent, improvement of the particle size of the raw materials,2,3,4) control of the ratio of the ore layer thickness and coke layer thickness (Lo/Lc) and control of the radial particle size distribution with the aim of controlling the radial distribution of the cohesive zone,5,6) and mixed charging of coke in the ore layer.7,8,9,10,11,12,13,14) Recently, discrete element model (DEM) is applied to the development of the burden distribution control by the improvement of the ability of computing machinery.15,16,17) Where future raw material quality is concerned, high quality iron ore has been largely depleted, and atomization, high SiO2, and high Al2O3 of iron ore are predicted.18,19,20) Although sintering machine operation will be adjusted to cope with declining raw material quality, decreased raw material reducibility, increased slag rate, and similar problems are considered at the blast furnace. Similarly, decreases in the particle size and strength of the coke are predicted against the background of depletion of caking coal, which is indispensable to the manufacture of good quality coke,21,22) and deterioration of coke ovens with age.
In coping with these changes, the development of a highly precise burden distribution control technology is considered indispensable. In control of the radial distribution of raw materials, the particle size change of the raw materials discharged from the top bunker is important. For example, as shown by measurements result in a filling investigation of Chiba No. 6 blast furnace,23) methods of controlling the particle size change of discharged raw materials according to the tilting direction of the rotating chute have substantially been established for every type of top bunker.23,24,25) In mixed charging of coke into the ore layer, mixing under-size coke (small coke) into the ore layer is considered to be the general method in the present blast furnace operation. However, the amount of mixed coke is thought to depend on the small coke generation rate, and the mixing method is also presumed to differ at each company and blast furnace. There are few examples of systematic investigation of the discharge behavior of mixed small coke from top bunker and mixing condition of small coke in the ore layer at the furnace top. Therefore, in the present research, scale model experiments and studies with mathematical models of a bell-less type charging system with a parallel type bunker and with a center feed type bunker were conducted to investigate the influence of the mixing position and mixing method of small coke on the mixing condition at the timing of discharge from the top bunker and after charging to the furnace top. The following presents the results of these scale model experiments and mathematical model studies, together with the results of application of the developed mixed small coke ratio control techniques to two commercial blast furnaces.
2. Study of Blast Furnace with Parallel Type Bunker
2.1. Experimental Procedure
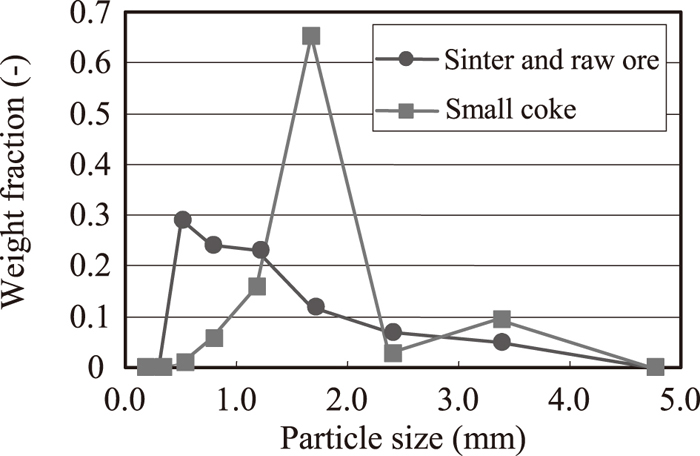
Figure 1 shows a schematic illustration of the experimental apparatus used in the study of the parallel type bunker. It is a 1/17.8 scale model of Chiba No. 6 blast furnace, which has a bell-less type charging system equipped with three parallel top bunkers.14) To examine the discharge behavior from the top bunker, a roller conveyor and a belt conveyor were set under the top bunker, and the discharged materials were collected in sampling boxes set on the conveyors, while the conveyors were moving at a constant speed. The experimental conditions and the size of the burden materials were decided based on the scale factor of the experimental apparatus. Crushed sinter and crushed coke were used in the experiment. The particle size distributions of each material are shown in Fig. 2. The data of the particle size distributions of the sinter and the coke sampled at the actual plant were used as reference in deciding the particle size distributions of the sinter and the coke used in the experiment.

The effect of the small coke mixing position and mixing method on the change in the mixed coke ratio discharged from the top bunker was investigated by using the experimental apparatus shown in Fig. 1. The coke rate was 380 kg/t. The charging weight and charging time of each batch were as shown in Table 1. As shown in left part of Fig. 1, the experimental conditions of the mixing position were discharge from the ore bin, discharge from the charging belt conveyor and simultaneous discharge from the two top bunkers. The experimental conditions of conventional tilting and reverse tilting were added because the set angle of the segregation control plate was changed by the tilting direction of the rotating chute. As shown in right part of Fig. 1, the tilting direction in conventional tilting is from the periphery to the center. Conversely, the tilting direction in reverse tilting is from the center to the periphery. Segregation control plate in the top bunker are set an angle like a solid line for the case of conventional tilting and an angle like a dashed line for the case of reverse tilting. As shown in Fig. 3, the small coke mixing methods were overlapped discharge of the small coke, overlapped discharge of the ore, discharge of the small coke before discharging the ore and discharge of the small coke after discharging the ore. The ore and the small coke were uniformly lapped in the overlapped discharging. Table 2 shows the experimental conditions. In this experiment, the ore and the small coke were collected by sampling boxes moving at a constant speed set to the discharge time shown in Table 1. The collected ore and coke were screened after separation by a gravity separation method using a sodium solution.14) The particle size distribution, the harmonic average diameter of the ore and the small coke ratio, defined as the ratio of the small coke weight and ore weight, were examined. The average value of the small coke mixing ratio was 0.08.
Table 1. Charging conditions.
| Actual BF | Experiment (1/17.8) |
|---|
| Sinter weight | 85.1 t/ch | 15.1 kg/ch |
| Mixed coke weight | 6.9 t/ch | 1.22 kg/ch |
| Rotation speed | 10 rpm | 42 rpm |
| Charging time | 48 sec | 11.4 sec |
Table 2. Experimental conditions.
| Mixing position of small coke | Discharging method of small coke | Tilting direction of rotating chute |
|---|
| Case 1 | Ore bin | Uniformly ore overlapped | Conventional |
| Case 2 | Charging BC | Uniformly coke overlapped | Conventional |
| Case 3 | Ore bin | Small coke-first discharge | Conventional |
| Case 4 | Ore bin | Ore-first discharge | Conventional |
| Case 5 | Charging BC | Uniformly ore overlapped | Conventional |
| Case 6 | Ore bin | Uniformly ore overlapped | Reverse |
| Case 7 | Charging BC | Uniformly coke overlapped | Reverse |
| Case 8 | Ore bin | Small coke-first discharge | Reverse |
| Case 9 | Ore bin | Ore-first discharge | Reverse |
| Case 10 | Charging BC | Uniformly ore overlapped | Reverse |
| Case 11 | Rotating chute | Simultaneous discharge from two bunkers | Reverse |
BC: Belt-conveyor
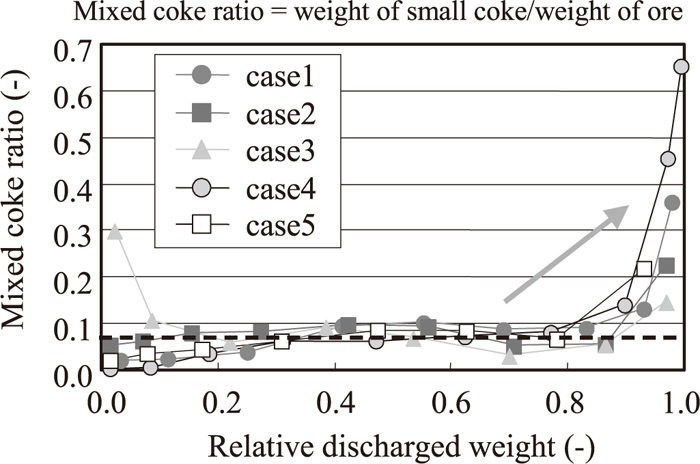
Figure 4 shows the relationship between the relative discharged weight and the dimensionless harmonic average diameter. The change in the discharged particle diameter of the ore showed a gradually increase tendency from the initial stage to the final stage of discharge independent of the small coke mixing method. Figure 5 shows the relationship between the relative discharged weight and the mixed coke ratio. The change in the mixed coke ratio differed depending on the mixing method. The mixed coke ratio increased after the relative discharged weight of 0.8 in each case. The mixed coke ratio in the final stage of the discharge in case 4 was the largest of all the cases. The mixed coke ratio in the initial stage of the discharge in case 3 was the largest of all the cases, but the mixed coke ratio in the final stage of the discharge also increased. Comparing case 1 and case 5, case 5 showed a relatively uniform mixed coke ratio. The mixed coke ratio in the final stage of the discharge in case 3 was the smallest of all the cases. Comparing case 2 and case 5, the effect of overlapping of the small coke was small. As a result, the effect of the mixing position of the small coke was large. Figure 6 shows the relationship between the relative discharged weight and the mixed coke ratio in cases 6–11. The change in the discharged particle diameter of the ore showed a tendency to decrease gradually from the initial stage to the final stage of the discharge, independent of the small coke mixing method. Figure 7 shows the relationship between the relative discharged weight and the mixed coke ratio. As in case 1–5, the change in the mixed coke ratio was different depending on the mixing method. The mixed coke ratio increased after the relative discharged weight of 0.8 in each case except case11. However, in comparison with cases 1–5, the mixed coke ratio distributions were near the average mixed coke ratio. The mixed coke ratios of case 6 and case 9 increased in the middle part of the discharge. The mixed coke ratio in the initial stage of the discharge of case 8 was larger than that of case 6 and case 9, and the mixed coke ratio in the relative discharged weight of 0.5–0.8 in case 8 was smaller than the average mixed coke ratio. The mixed coke ratio of case 11 was near the average mixed coke ratio of 0.08 during the entire discharge.

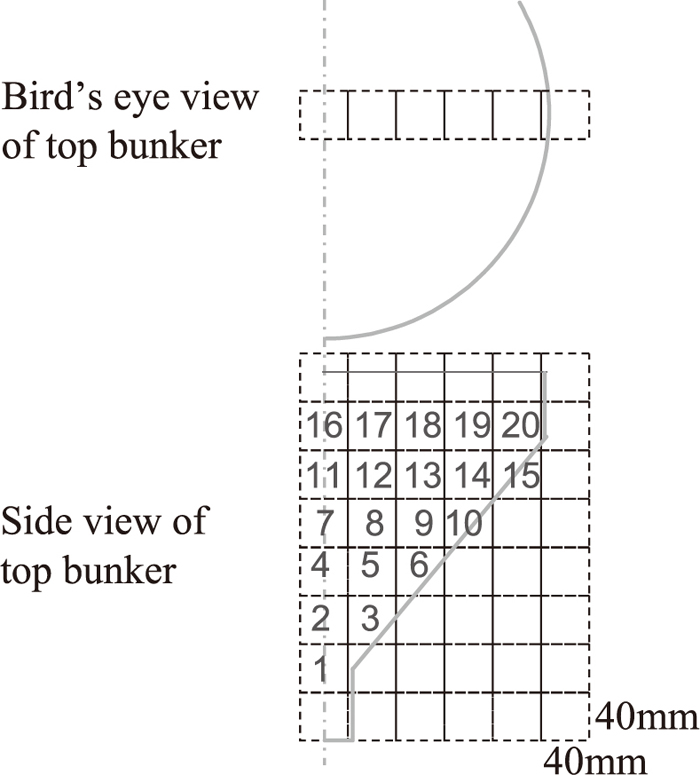
An experiment concerning the discharge order of the material in a top bunker was conducted by using tracer particles to quantify the material discharge behavior from a parallel type top bunker. As shown in Fig. 8, 2.0–2.8 mm ore was charged into the bunker, and 20 numbered alumina balls (particle diameter 4.0 mm) were arranged in the bunker as tracers. In this experiment, the balls were arranged in a lattice shape with a spacing of 40 mm in the longitudinal and width directions. Temporal sampling of the ore discharged from the top bunker was performed by using a sampling box, as in the above-mentioned discharge experiment, and the discharge order of each position in the bunker was determined from the number of the sampled alumina ball. The result is shown in Fig. 9. The burden material, which is located in directly above the bunker outlet, was discharged in the initial stage, the discharged order is toward the peripheral part of the bunker, and the last discharged part was that at the bunker peripheral wall. Based on this result and the segregation behavior due to the difference of particle size between the ore and small coke,23) the relationship between the small coke mixing condition in the top bunker and the temporal change of the small coke discharged from the top bunker was considered. The behavior of the small coke mixing condition in the top bunker in conventional tilting is shown in Fig. 10. The deposition pattern of the burden material in the bunker is shown as 10-1 in Fig. 10. This is why the angle of the segregation control plate in the top bunker is set for discharge of large particles in the end of discharge from the top bunker. In this case, the part of directly above the bunker outlet is the position of the master stream in the timing of charging the burden material from the charging belt conveyor to the top bunker. As a result, the large particles segregate and collect around the peripheral wall of the top bunker, which is the part of final discharge.


Since the discharge order is as shown in Fig. 9, fine materials are discharged in the initial stage of discharge (stage I), small materials are discharged in the middle stage of discharge (stage II), and coarse materials are discharged in the final stage of discharge (stage III). The deposition condition in case small coke is overlapped with the same length of ore (images of cases 1, 2, 5) is shown in 10-2. As shown in Fig. 2, if the burden materials under 1.0 mm are defined as fine particle materials, the burden materials of about 1.0–2.0 mm are defined as small particle materials or small coke, and the materials over 2.0 mm are defined as coarse materials or middle coke, the small coke mixing ratio is presumed to increase toward the final stage of discharge because it is thought that the small coke segregates by the same behavior as the small materials and the middle coke segregates by the same behavior as the coarse materials at the peripheral part of the bunker. The experimental result coincided with this trend. The deposition condition in case of small coke-first discharge (case 3) is shown in 10-3. It is presumed that the small coke mixing ratio is high in the stage I, the middle coke mixing ratio is high in the stage III, and the small coke mixing ratio is low in the stage II because the amount of segregation in the first stage of discharge is small. The experimental result coincided with this trend. The deposition condition in case of ore-first discharge (case 4) is shown in 10-4. It is presumed that there is almost no small coke in the stage I, and the small coke mixing ratio in the stage II and the middle coke mixing ratio in the stage III are high. Again, the experimental result coincided with the trend.
The behavior of the mixing condition of small coke in the top bunker in case of reverse tilting is shown in Fig. 11. The deposition pattern of the burden materials in the bunker is shown in 11-1. This is why the angle of the segregation control plate in the top bunker is set for the discharge of large particles in the beginning of discharge from the top bunker. In this case, the peripheral part of the top bunker is the position of the master stream in the timing of charging the burden material from the charging belt conveyor to the top bunker, and the large particles segregate and collect around the part directly above the top bunker outlet, which is the part where discharge begins.

The discharge order from the top bunker is the same order as in the case of conventional tilting. Therefore, coarse materials are discharged in the stage I, small particle materials are discharged in the stage II, and fine particle materials are discharged in the stage III. The deposition condition in case of small coke overlapped with the same length of ore (cases 6, 7, 10) is shown in 11-2. If the particle size distribution of the burden materials and small coke is considered to be as shown in Fig. 10, it is presumed that the increase in the small coke mixing ratio toward the final stage of discharge decreases in comparison with conventional tilting, because it is thought that the small coke segregates in the same manner as the small particle materials and the middle coke segregates in the same manner as the coarse materials in the middle and center of the bunker. This presumption coincided with the experimental results, as the small coke mixing ratio in the final stage of discharge decreased by about half in comparison with conventional tilting. The deposition condition in case of small coke-first discharge (case 8) is shown in 11-3. It is presumed that the small and middle coke mixing ratio is high in the stage I, the small coke mixing ratio is high in the stage III, and the small and middle coke mixing ratio is low in the stage II, because segregation is small in the initial stage of charging to the bunker. The experimental result coincided with the trend. The deposition condition in case of ore-first discharge (case 9) is shown in 11-4. It is presumed that there is almost no small and middle coke in the stage I, and the middle coke mixing ratio in the stage II and the small coke mixing ratio in the stage III are high. The experimental results coincided with the trend.
2.2.4. Examination of Mixing Method for Improvement of Small Coke Discharge Condition and Results of Application to Commercial Plant
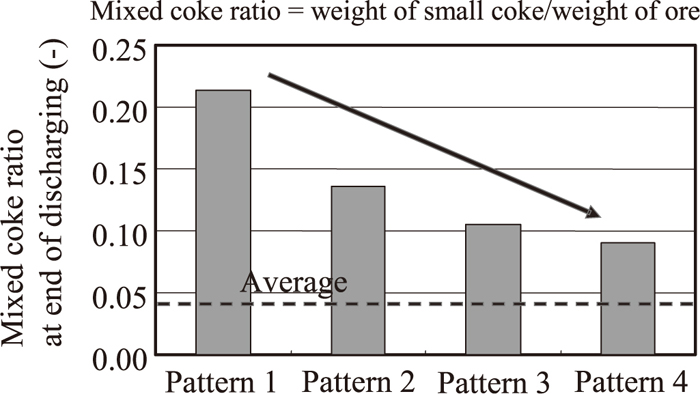
As shown in Fig. 5, in the case of conventional tilting, the tendency that small coke mixing ratio tended to increase at the end of discharge. This increase means an increase in the charging amount of small coke near the central part of the blast furnace. According to Shimizu et al.,26,27) coke charged at the center of the blast furnace by techniques for charging coke to furnace center is effective for stabilizing the center gas flow and controlling the structure of the deadman. It is also thought that an increase in the small coke mixing ratio at the central part of the blast furnace leads to destabilization of the center gas flow and inflow of small coke to deadman, which causes inactivation of the deadman. A model experiment was conducted to decrease the small coke mixing ratio at the end of discharge in conventional tilting. The experimental conditions are shown in Table 3, and the mixing method is shown in Fig. 12. The coke overlapping length was the same as the ore layer length in pattern 1. The coke was overlapped at the front half of the ore layer in pattern 2, and the coke was overlapped at the front one-quarter of the ore layer in pattern 3. The small coke was discharged first in pattern 4. A comparison of the small coke mixing ratio in the final stage of discharge is shown in Fig. 13, and a comparison of the small coke mixing ratio in the initial stage of discharge is shown in Fig. 14. The average small coke mixing ratio approached 0.04 by overlapping small coke gradually on the front of the ore layer in patterns 1 to 3, or completely on the front of the ore layer. On the other hand, because the small coke mixing ratio is high in the beginning of discharge in pattern 4, as shown in Fig. 14, it was suggested that decreasing the length of the coke layer overlapping the ore layer is effective for approximating the average small coke mixing ratio in the beginning of discharge and end of discharge. The change in the small coke mixing condition at the furnace top when the small coke discharge condition changes was studied with a burden distribution model.28,29) The small coke discharge situation was studied by using the experimental results of pattern 1 and pattern 3 in Fig. 12. Here, the bell-less mode was constant. Figure 15 shows the relationship between the non-dimensional radial position and the small coke mixing ratio obtained by calculation. The small coke mixing ratio increased near the central part of the blast furnace because the small coke mixing ratio at the end of discharge in pattern 1 increased. On the other hand, the small coke mixing ratio increased at the periphery over non-dimensional radial position 0.6 and decreased near the central part of the blast furnace under non-dimensional radial position 0.1 because the small coke mixing ratio decreased at the end of discharge and increased at the beginning of discharge in pattern 3 compared to pattern 1. As a result, the overall average mixing coke ratio approached 0.04 in the radial direction in pattern 3. An examination of changing the small coke mixing method was conducted at Fukuyama No. 5 blast furnace based on the above-mentioned experimental results. The mixing method was changed from pattern 1 to pattern 2 in Fig. 12. The data in Figs. 16 and 17 are hourly data. The data for two days before changing a mixing method were compared with the data for two days after changing a mixing method in a period when the operational conditions and burden material conditions were constant. The relationship between PCR and the permeability index K is shown in Fig. 16. When PCR increased, the index K also increased, but the index K in pattern 2 decreased about 5% at the same PCR compared to the index K in pattern 1. The relationship between the index K and gas availability ηCO is shown in Fig. 17. Although the index K in pattern 2 was lower than the index K in pattern 1, ηCO improved about 0.4%. From these results, the amount of small coke in the final stage of discharge decreased as a result of changing the small coke mixing method from pattern 1 to pattern 2 so that the amount of small coke discharge increased from the initial stage of discharge to the middle stage of discharge. As a result, it is thought that the mixing condition in the radial direction improved more uniformly and the mixed coke ratio improved as shown in Fig. 15.
Table 3. Charging conditions.
| Actual BF | Experiment (1/17.8) |
|---|
| Sinter weight | 59.3 t/ch | 10.5 kg/ch |
| Mixed coke weight | 2.3 t/ch | 0.41 kg/ch |
| Rotation speed | 10 rpm | 42 rpm |
| Charging time | 66 sec | 15.6 sec |
3. Study of Blast Furnace with Center Feed Type Bunker
3.1. Experimental Procedure and Conditions
A scale model experiment was carried out to investigate the effect of the discharge pattern of mixed small coke onto the ore belt conveyor on the mixed coke ratio distribution at the blast furnace top in the case of a center feed type bell-less top. Figure 18 shows a schematic illustration of the experimental apparatus. The experimental apparatus is a 1/18.8 scale model of JFE Steel’s Keihin No. 2 blast furnace, which has a bell-less type charging system with a center feed type bell-less top. The change in the mixed coke ratio discharged from the bell-less top and the radial mixed coke ratio distribution at the furnace top were measured to investigate the effect of the discharge pattern of the mixed small coke onto the ore belt conveyor on the mixed coke ratio distribution. The change in the mixed coke ratio discharged from the bell-less top was measured by same way in the experiment of parallel type bunker. The radial mixed coke ratio distribution at the furnace top was measured by collecting the mixed materials (ore and small coke) in cylinders 30 mm in diameter, which were inserted the surface into the burden after charging the mixed materials to furnace top by rotating chute. The collected materials were separated by same way in the experiment of parallel type bunker.14) The average value of the small coke ratio was 0.028.

As in the parallel type bunker experiment, the experimental conditions and the size of the burden materials were decided based on the scale factor of the experimental apparatus.24)
The particle size distributions of the ore and coke used in this experiment were as shown in Fig. 19.
The charging weight, rotation speed and charging time were as shown in Table 4. Figure 20 shows the experimental conditions. In this study, the discharge pattern of the ore and mixed small coke on the ore belt conveyor was investigated. In case 12, the ore and the small coke were discharged simultaneously, and the small coke was overlapped on the ore during the first quarter of the discharging. In case 13, after first discharging the small coke, the ore was discharged. Conversely, in case 14, the small coke was discharged after completely discharging the ore.
Table 4. Charging conditions.
| Actual BF | Experiment (1/18.8) |
|---|
| Sinter weight | 95.9 t/ch | 14.4 kg/ch |
| Mixed coke weight | 2.8 t/ch | 0.42 kg/ch |
| Rotation speed | 9 rpm | 39 rpm |
| Charging time | 86.6 sec | 19.9 sec |
Figure 21 shows the change in the mixed coke ratio discharged from the bell-less top. In case 12, the mixed coke ratio was high and constant from the initial stage to the middle stage of discharge, and then gradually decreased toward the final stage of discharge. In case 13, the mixed coke ratio in the initial stage of discharge increased compared with that in the initial stage of discharge in case 12. However, the tendency of the mixed coke ratio to decrease from the middle stage to the final stage was the same. In case 14, the mixed coke ratio in the initial stage of discharge decreased compared with the mixed coke ratio in the initial stage in case 12, and the mixed coke ratio increased in the middle stage of discharge. Again, however, the tendency of the mixed coke ratio to decrease from the middle stage to the final stage of discharge was the same. As a result, the mixed coke ratio in the initial stage of discharge could be controlled by changing the discharge pattern of the small coke on the ore belt conveyor.
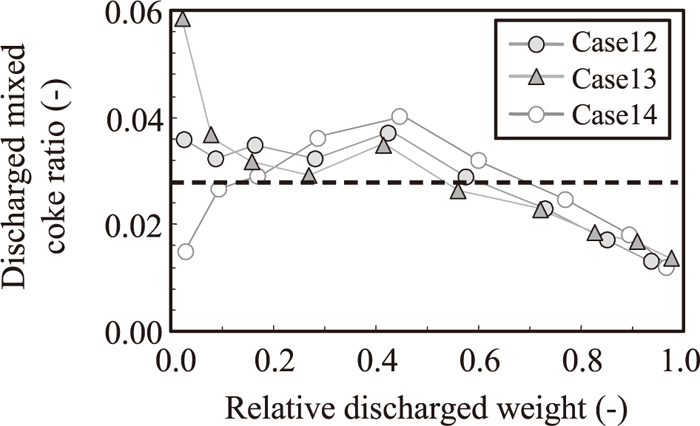
In case of coke mixed charging, reverse tilting of the rotating chute was effective to restrain the segregation of the mixed coke after charging the mixed materials.14) As shown in Fig. 21, controlling the mixed coke ratio in the initial stage of discharge from the bell-less top was effective for controlling the mixed coke ratio distribution at the furnace top in reverse tilting, because the mixed coke ratio at the central part of the furnace top could be controlled. In this experiment, reverse tilting was selected. Case 12 and case 14, in which the mixed coke ratio in the initial stage of discharge from the top bunker was lower, were selected and an experiment was carried out to estimate the mixed coke ratio distribution in the furnace top.
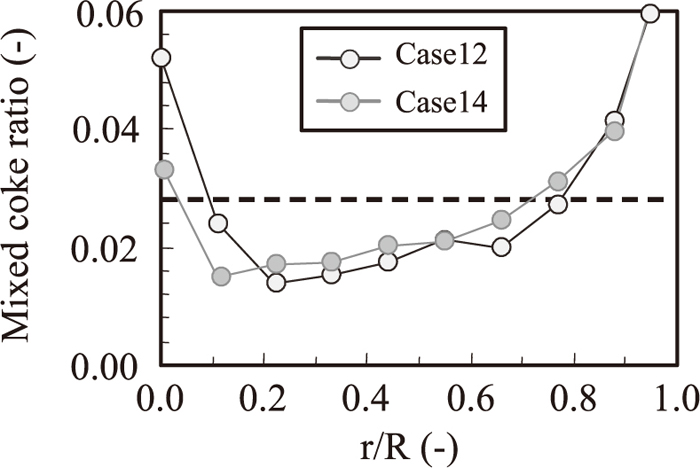
Figure 22 shows the effect of the discharge pattern on the mixed coke ratio distribution at the furnace top. In each condition, the mixed coke ratio at the central part was high compared with the average mixed coke ratio of 0.028. However, in case 14, in which the mixed coke ratio in the initial stage of discharge from the bell-less top was low, the mixed coke ratio at the central part decreased in comparison with case 12, and the mixed coke ratio at the middle part was higher than that in case 12. As a result, it was predicted that the mixed coke ratio was improved so as to restrain the segregation of the mixed coke at the central part.
The mixed coke ratio was also estimated. Here, this ratio was defined as the ratio of the mixed coke collected from the furnace top to the mixed coke charged in the furnace top. The mixed coke ratio in case 14 was higher than that in case 12. The value increased approximately 4%, from 61.3% to 65.2%.
3.3. Application to Commercial Blast Furnace
An examination of the change in the small coke mixing method was conducted at Keihin No. 2 blast furnace based on the knowledge described above. The mixing method was changed from case 12 to case 14 in Fig. 20.
The permeability index in the upper part of the blast furnace is almost same between case 12 (0.889) and case 14 (0.897). The permeability index in the lower part of the blast furnace is much lower in case 14 (1.381) than in case 12 (1.413).
It is estimated that the reduction efficiency of the ore and the permeability in the cohesive zone improved because the mixed coke ratio was improved by the change in the discharge pattern of the mixed coke at the stockhouse.
Shaft efficiency was estimated from the change in RAR by using a heat and mass balance model based on a Rist diagram.30) In the commercial plant test, RAR in case 14 was confirmed to be 1.5 kg/t lower than that of in case 12, and the shaft efficiency in case 14 (87.76%) was estimated to be 0.27% higher than that in case 12 (87.49%).
4. Conclusions
The effects of the small coke mixing position and mixing method on the change in the discharge pattern of mixed coke from the top bunker and on the radial mixed coke distribution at the furnace top were studied with the aim of improving the small coke mixing condition and establishing low RAR (low CR), high productivity operation. Scale model experiments and calculations by burden distribution models were carried out for a parallel type bunker and for a center feed type bunker. Based on the results, techniques for mixed coke ratio control were developed and applied to two commercial plants. The following results were obtained.
4.1. Study of Blast Furnace with Parallel Type Bunker
(1) In case of conventional tilting, the mixed coke ratio distribution at the end of discharge tends to increase. A more uniform coke mixing ratio can be obtained by mixing at the charging belt conveyor. In case of reverse tilting, the mixed coke ratio distribution at the end of discharge also tends to increase, but is more uniform than that in conventional tilting. As in the case of conventional tilting, a more uniform coke mixed ratio is obtained by mixing at the charging belt conveyor.
(2) To prevent an increase in the mixed coke ratio at the end of discharge in the case of conventional tilting, shortening of the overlapped length of small coke is effective under the condition of mixing at the charging belt conveyor.
(3) Based on the experimental results, a commercial plant test was conducted. Improvements of approximately 5% in the permeability index and approximately 0.4% in the gas utilization ratio were confirmed.
4.2. Study of Blast Furnace with Center Feed Type Bunker
(1) To decrease the mixed coke ratio in the initial stage of discharge from the top bunker, discharging mixed coke after first discharging the ore is effective.
(2) When the mixed coke was discharged after discharging the ore at the stockhouse, and charging is performed by reverse tilting, the mixed coke ratio was improved approximately 4%.
(3) Based on experimental results, a commercial plant test was conducted. Decreasing RAR by 1.5 kg/t and improvement of shaft efficiency by 0.27% were confirmed.
References
- 1) T. Ariyama and M. Sato: ISIJ Int., 46 (2006), 1736.
- 2) K. Mochizuki, T. Murai, Y. Kawaguchi and Y. Iwanaga: Tetsu-to-Hagané, 72 (1986), 1855.
- 3) T. Ariyama, M. Sato, T. Sato, S. Watakabe and R. Murai: Tetsu-to-Hagané, 92 (2006), 114.
- 4) Y. Terada, T. Ino, K. Inoguchi, K. Kurihara, H. Baba and K. Saito: Tetsu-to-Hagané, 73 (1987), S5.
- 5) K. Kurita, T. Inada, K. Takada and A. Koike: Tetsu-to-Hagané, 73 (1987), S2.
- 6) T. Sato, M. Sato, K. Takeda and T. Ariyama: Tetsu-to-Hagané, 92 (2006), 1006.
- 7) Y. Shimomura, K. Kushima, F. Sato and S. Arino: Tetsu-to-Hagané, 62 (1976), S404.
- 8) M. Gono, K. Iwatsuki, M. Takasaki, K. Noshima and T. Miwa: Tetsu-to-Hagané, 68 (1982), S709.
- 9) T. Sato, T. Sumigama, A. Yamaguchi, K. Kimura, A. Shimomura and S. Furuya: Tetsu-to-Hagané, 70 (1984), S777.
- 10) K. Okuda, S. Amano, N. Ishioka, H. Ono, T. Furukawa and T. Inoue: Tetsu-to-Hagané, 69 (1983), S731.
- 11) K. Okuda, K. Yamaguchi, N. Ishioka, T. Furukawa and H. Endo: Tetsu-to-Hagané, 70 (1984), S102.
- 12) Y. Uenaka, Y. Yuzukubo, R. Hori, F. Noma, K. Okimoto and T. Funabiki: Tetsu-to-Hagané, 73 (1987), S790.
- 13) Y. Yamano, S. Banno, M. Tanaka, T. Tagawa and M. Sawayama: CAMP-ISIJ, 23 (2010), 1012, CD-ROM.
- 14) S. Watakabe, K. Takeda, H. Nishimura, S. Goto, N. Nishimura, T. Uchida and M. Kiguchi: ISIJ Int., 46 (2006), 513.
- 15) T. Ariyama, S. Nastui, T. Kon, S. Ueda, S. Kikuchi and H. Nogami: Tetsu-to-Hagané, 100 (2014), 198.
- 16) H. Mio, S. Komatsuki, M. Akashi, A. Shimosaka, Y. Shirakawa, J. Hidaka, M. Kadowaki, S. Matsuzaki and K. Kunitomo: ISIJ Int., 48 (2008), 1696.
- 17) H. Mio, S. Komatsuki, M. Akashi, A. Shimosaka, Y. Shirakawa, J. Hidaka, M. Kadowaki, S. Matsuzaki and K. Kunitomo: ISIJ Int., 49 (2009), 479.
- 18) T. Haga, S. Kasama, T. Kozono and N. Ogata: Tetsu-to-Hagané, 82 (1996), 981.
- 19) T. Higuchi, Y. Iwami, Y. Kuriki, K. Nushiro, M. Sato and N. Oyama: Tetsu-to-Hagané, 98 (2012), 583.
- 20) Y. Terakawa, J. Okazaki, T. Orimoto and S. Nomura: CAMP-ISIJ, 26 (2013), 719, CD-ROM.
- 21) K. Yanagihara: J. Jpn. Inst. Energy, 73 (1994), 795.
- 22) R. Ashida, M. Morimoto, Y. Makino, M. Pattarapanusak, K. Miura, K. Kato and K. Ota: Tetsu-to-Hagané, 96 (2010), 240.
- 23) T. Sato, T. Nouchi, K. Takeda and H. Kamano: Tetsu-to-Hagané, 86 (2000), 648.
- 24) S. Miyagawa, K. Takeda, S. Taguchi, T. Morimoto, M. Fujita and H. Fujimori: Kawasaki Steel Giho, 23 (1991), 130.
- 25) Y. Kashihara, A. Murao, Y. Sawa, M. Sato and K. Yamamoto: 30th Journees Siderurgiques Internationales, FFA, Paris, (2012), 5.4.
- 26) M. Shimizu, Y. Kimura, S. Inaba and C. H. E. Chuanren: Tetsu-to-Hagané, 73 (1987), S754.
- 27) Y. Kimura, M. Isobe, M. Shimizu, S. Inaba and C. H. E. Chuanren: Tetsu-to-Hagané, 73 (1987), S755.
- 28) T. Sato, T. Nouchi, K. Takeda, T, Kawai, M. Nomura and N. Nishimura: CAMP-ISIJ, 11 (1998), 897.
- 29) T. Nouchi, T. Takeda and H. Itaya: Tetsu-to-Hagané, 86 (2000), 293.
- 30) A. Rist and N. Meysson: J. Met., 19 (1967), 50.