Regular Article
Effect of the Reduction of Calcium Ferrite on Disintegration Behavior of Sinter under High Hydrogen Atmosphere
2015 Volume 55 Issue 6 Pages 1197-1205
Details
2015 Volume 55 Issue 6 Pages 1197-1205
The utilization of H2 gas as a reducing agent in blast furnaces is one potential method to reduce CO2 emissions from the iron and steel industry. In order to maintain stable operation of the blast furnace under a high H2 concentration, it is necessary to understand the effects of H2 and H2O gases on the disintegration of the iron ore sinter by reduction under various conditions. In this study, the effect of the reduction of calcium ferrite on the disintegration of sinter was examined.
Reduction experiments were carried out under N2 – 20% CO – 20% CO2 (CO reduction) and N2 – 12% CO – x% CO2–8% H2 – (20-x)% H2O (CO–H2 reduction) at temperatures from 773 to 973 K. The reduction of hematite to magnetite mainly proceeds at 773 K. However, longer reduction time is necessary for acicular calcium ferrite as 5.4 ks by CO reduction and 3.6 ks for CO–H2 reduction, while columnar calcium ferrite is not reduced at such temperature. The reduction of acicular calcium ferrite begins after 1.8 ks at 873 K and accelerates disintegration of sinter. At 973 K, on the other hand, disintegration is inhibited because the volume expansion of skeletal hematite becomes small and the cracks formed in the sinter seem to be mended.
Reduction of CO2 emissions from the ironmaking process is an urgent issue. One of the effective methods to achieve this reduction is utilization of H2 as the reducing agent in blast furnace ironmaking. To realize it, a constant and secure source of H2 and a better understanding of the H2 effects on the blast furnace operation are required. However, Nogami et al. reported by mathematical simulation1) that an increase in H2 would lead to a significant change in the temperature profile in the blast furnace because the reduction of iron oxide by H2 is an endothermic reaction. In particular, the low temperature zone from 673 to 873 K becomes wider than that under conventional conditions. The permeability of the blast furnace is also subjected to influences of the reduction disintegration behavior of the sinter.
The reduction disintegration of sinter at low temperature is one of important factors to maintain the stable operation of the blast furnace. The authors reported the effects of the concentration of H2 on the reduction disintegration behavior of the sinter reduced under a N2–CO–CO2–H2–H2O gas at 773 K.2,3) While reduction under CO gas proceeds topochemically, the large cracks formed at reduced skeletal hematite grow together with net-like fine cracks near the reduced hematite. As a result, the amount of fine cracks formed in sinter reduced under CO–H2 gas is lesser than the amount formed under CO gas. For a longer reduction time, additional weight change was found except in the reduction from hematite to magnetite, and structural changes occurred in the structure of calcium ferrite phase, although the reason was not clear. Furthermore, there is no data at other temperature ranges. Sato et al. reported that the disintegration of sinter by CO reduction is caused by hematite reduction at temperatures from 773 to 873 K and by calcium ferrite reduction at temperatures from 923 to 1073 K.4) However, no report was made on the reduction of calcium ferrite by H2 and disintegration of sinter caused by its reduction. In this study, therefore, the disintegration behavior of sinter reduced by N2–CO–CO2–H2–H2O gas was examined at temperatures from 773 to 973 K.
The sinter sample used in this study was supplied by a Japanese steel mill and had the composition listed in Table 1. The sample was crushed and sieved to grain sizes of 6.7–9.5 mm before use, and its RDI (Reduction Disintegration Index, ISO 4696-2) and RI (Reduction Index, ISO 7215) values were 37.6 and 73.5, respectively. The compositions of hematite and magnetite in this sinter were determined to be 32.4% and 14.1%, respectively, by an internal standard method based on XRD using NaF reagent as a standard.
| T–Fe | FeO | CaO | SiO2 | Al2O3 | MgO | P | S |
|---|---|---|---|---|---|---|---|
| 57.0 | 6.9 | 10.1 | 5.0 | 1.9 | 1.5 | 0.05 | 0.01 |
Twenty-five sinter particles were randomly collected to achieve a sample weight of 25±1 g were used in the experiment. The experimental apparatus for the reduction of sinter has been explained in the previous report.5) The sample was set in the holder with the inner diameter of 28 mm, and it was set in the furnace. Then, it was heated up to a target temperature between 773 and 973 K, which was controlled at ±10 K, in a N2 stream with a flow rate of 21.5 cm3/s and kept for 300 s. Subsequently, the gas was changed to a reducing gas, keeping constant the flow rate, and the reduction experiment was carried out for selected times, varying from 1.2 to 9.0 ks. Table 2 shows the reduction temperature and reducing gas composition. Two reducing gases were used: N2–20%CO–20%CO2 (CO reduction) and N2–12%CO–x%CO2–8%H2–(20–x)%H2O (CO–H2 reduction). In the latter case, the concentrations of CO2 and H2O gas were determined by the equilibrium conditions of the water–gas–shift reaction at each temperature, after fixing the concentrations of CO and H2 gas. The gas composition was controlled near the equilibrium conditions of metallic iron and magnetite at 773 K and in the stable area of wüstite above 873 and 973 K based on the phase diagram of Fe–O system. At 773 K, it can be estimated that the conditions is in the stable area of magnetite because the reduction reaction from magnetite to metallic iron does not proceed unless the partial pressure of CO gas is higher than 0.6.6)
| Case | Temperature (K) | N2 (vol.%) | CO (vol.%) | CO2 (vol.%) | H2 (vol.%) | H2O (vol.%) |
|---|---|---|---|---|---|---|
| 1-1 | 773 | 60.0 | 20.0 | 20.0 | 0.0 | 0.0 |
| 1-2 | 12.0 | 19.0 | 8.0 | 1.0 | ||
| 2-1 | 873 | 60.0 | 20.0 | 20.0 | 0.0 | 0.0 |
| 2-2 | 12.0 | 18.1 | 8.0 | 1.9 | ||
| 3-1 | 973 | 60.0 | 20.0 | 20.0 | 0.0 | 0.0 |
| 3-2 | 12.0 | 17.3 | 8.0 | 2.7 |
The reduction degree, R.D.W, was calculated from the weight change before and after reduction, using the equation:
| (1) |
Disintegration tests were conducted on the reduced samples on the basis of the ISO 4696–2, using a tumbling drum at a rotation speed of 30 rpm for 1.8 ks. Then, the sample was sieved with a 2.8 mm mesh to determine the weight of the particles in the sample which were larger than 2.8 mm. Finally, the RDI value was calculated using the following equation:
| (2) |
Sinter contains several types of calcium ferrites having different compositions and structures such as acicular and columnar.5) Typical microstructures of calcium ferrite phases detected in the sinter used in this study are shown in Fig. 1. Acicular calcium ferrite phases, as shown in Figs. 1(a) and 1(b), are observed in the sinter. The former calcium ferrite (acicular calcium ferrite–A, ACF–A) is surrounded by skeletal hematite, and the latter (acicular calcium ferrite–B, ACF–B) is not. Columnar calcium ferrite (CCF), as shown in Fig. 1(c), is also observed. Figure 2 shows the composition of each calcium ferrite phase plotted on the pseudo-ternary phase diagram of SiO2 – (CaO + MgO) – (Fe2O3 + Al2O3). The square, triangle, and rhombus symbols represent ACF–A, ACF–B, and CCF, respectively. ACF–A and ACF–B have wide composition ranges, and it is possible that these include various calcium ferrite phases. The amount of SiO2 in ACF–A is higher than that in the other calcium ferrite phases. In contrast, CCF has a small composition range. Kawaguchi et al. reported on the existence of fine calcium ferrite phase which has finer structure than that of the acicular phase and a higher CaO composition.7) This may be the reason that acicular calcium ferrite has various compositions. A few relatively rare phases actually have compositions of approximately 60 mass% (CaO + MgO).
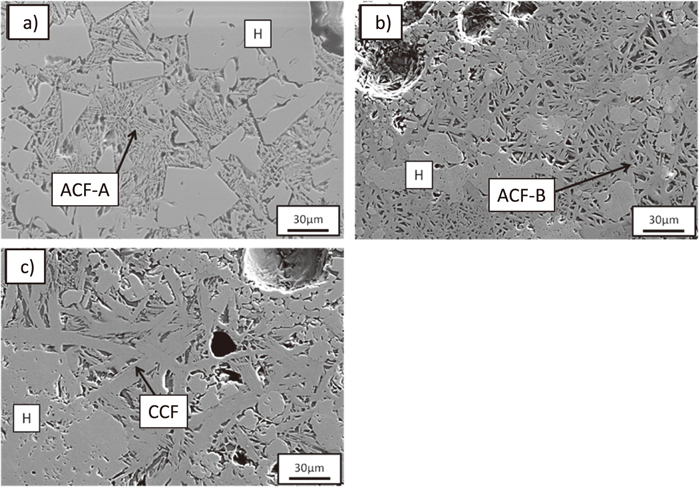
SEM images of a) acicular calcium ferrite A, b) acicular calcium ferrite B, and c) columnar calcium ferrite in sinter. H: Hematite, ACF: Acicular calcium ferrite, CCF: Columnar calcium ferrite.

Chemical compositions of different kinds of calcium ferrites on the (Al2O3+Fe2O3) – (CaO+MgO) – SiO2 system. (Online version in color.)
In actual sinter, the formed calcium ferrite phase is multiple, for example, silico-ferrite of calcium and aluminum (SFCA). However, its identification is very difficult. In this study, phase identification of these calcium ferrite phases was performed based on the simplified binary system reported by Taguchi et al.,8) but with certain improvements.
a) The basic system is p CaO – q FeO – r Fe2O3, with possible ternary compounds of (p q r = 3 1 7, 4 1 4, 1 1 1, 1 3 1, Hereafter these are described as C3WF7, C4WF4, CWF, and CW3F).
b) It is assumed that SiO2 solutes in the calcium ferrite phase and that Al2O3 and MgO can displace Fe2O3 and CaO, respectively.
c) The compound is selected based on the ratio of (Ca+Mg) / (Fe+Al) determined by EDX from the reported phase described above. If this ratio is similar to 0.2, which has C3WF7 and CW3F as its two compounds, XRD analysis should be used to distinguish. Only C3WF7 has a strong peak of 10.59.
The calcium ferrite phase results before reduction are shown in Table 3. In both ACF–A and ACF–B, the CF and CF2 phases were identified as major compounds. In addition, the C4WF4 and CWF phases are also present. In CCF, on the other hand, the major compounds are CF2 and C3WF7. The sinter used in this study has 6.9mass%FeO as Fe2+. If this ferrous ion constitutes magnetite (Fe3O4), the amount of magnetite will be 22.2 mass%. However, the analytical value of magnetite is 14.1 mass%. This difference implies that a certain amount of ferrous ions was contained within calcium ferrite phases such as CWF and C4WF4.
| Phases (Ca/Fe) | CF (0.5) | CF2 (0.25) | C3WF7 (0.20) | C4WF4 (0.44) | CWF (0.33) | CW3F (0.20) | FexO (~0.15) |
|---|---|---|---|---|---|---|---|
| Acicular CF–A | ○ | ○ | ○ | ○ | |||
| Acicular CF–B | ○ | ○ | ○ | ○ | |||
| Columnar CF | ○ | ○ |
The reduction behavior of hematite in this sinter at 773 K was already reported in the previous research.3) Therefore, reduction of the CF phase was focused on. Table 4 shows the composition of the CF phase (ACF–A and ACF–B) in the sinter reduced by CO and CO–H2 gas for 1.8, 3.6, and 5.4 ks. The calcium ferrite phase of C3WF7 that has a (Ca + Mg) / (Fe + Al) ratio of 0.2 forms for 5.4 and 3.6 ks reduction by CO and CO–H2, respectively. The formation of this phase indicates that reduction of calcium ferrite phase proceeds. Figures 3 and 4 show the microstructures of the sinter reduced by CO and CO–H2 gas, respectively, at 773 K for 1.8, 3.6, and 5.4 ks. A part of ACF–A which is surrounded by magnetite formed by the reduction of skeletal hematite was broken in both samples after reduction by CO for 1.8 ks and by CO–H2 for 5.4 ks and fell out the sinter during polishing for the observation as indicated by arrows in Figures. This behavior may be related to the reduction of calcium ferrite because it cannot be observed from the sample after shorter reductions, such as 1.8 ks, as will be described in detail.
| Phases (Ca/Fe) | CF (0.5) | CF2 (0.25) | C3WF7 (0.20) | C4WF4 (0.44) | CWF (0.33) | CW3F (0.20) | FeOx (~0.15) | ||
|---|---|---|---|---|---|---|---|---|---|
| ACF–A | Sinter | ○ | ○ | ○ | ○ | ||||
| Reduced by CO | 1.8 ks | ○ | ○ | ○ | ○ | ||||
| 3.6 ks | ○ | ○ | ○ | ||||||
| 5.4 ks | ○ | ○ | ○ | ○ | ○ | ||||
| Reduced by CO–H2 | 1.8 ks | ○ | ○ | ○ | |||||
| 3.6 ks | ○ | ○ | ○ | ○ | ○ | ||||
| 5.4 ks | ○ | ○ | ○ | ○ | |||||
| ACF–B | Sinter | ○ | ○ | ○ | ○ | ||||
| Reduced by CO | 1.8 ks | ○ | ○ | ○ | ○ | ||||
| 3.6 ks | ○ | ○ | ○ | ||||||
| 5.4 ks | ○ | ○ | ○ | ○ | ○ | ||||
| Reduced by CO–H2 | 1.8 ks | ○ | ○ | ○ | |||||
| 3.6 ks | ○ | ○ | ○ | ○ | ○ | ||||
| 5.4 ks | ○ | ○ | ○ | ○ | |||||

SEM images of (a) acicular calcium ferrite A and (b) acicular calcium ferrite B in the sinter reduced by CO at 773 K for (1) 1.8 ks, (2) 3.6 ks, and (3) 5.4 ks. H: Hematite, M: Magnetite, ACF: acicular calcium ferrite.

SEM images of (a) acicular calcium ferrite A and (b) acicular calcium ferrite B in the sinter reduced by CO–H2 at 773 K for(1) 1.8 ks,(2) 3.6 ks, and (3) 5.4 ks. H: Hematite, M: Magnetite, ACF: acicular calcium ferrite.
In case of ACF–B, just like in ACF–A reduction, the C3WF7 phase forms for 5.4 and 3.6 ks reduction by CO and CO–H2 gas, respectively. The microstructures of ACF–B when this change is observed are also shown in Fig. 3. There is no shape change in ACF–B while reduction of ACF–B proceeds. Furthermore, the reduction by CO–H2 proceeds faster than that by CO in both acicular calcium ferrite phases. On the other hand, CCF undergoes no phase and shape changes after reduction by CO and CO–H2 gas at 773 K for 5.4 ks. These results correspond to the previous reports9) that CCF has less reducibility than acicular calcium ferrite – which has a fine structure and many pores – because CCF exists with a slag phase and has few pores.
Figure 5 shows the change with time of the reduction degree of sinter reduced by CO and CO–H2 gas at 873 K. The reduction degree values, R.D.W and R.D.XRD, were respectively calculated from the weight change and from the intensity change of the hematite XRD peak between before and after reduction, as was explained in detail by the previous report.3) R.D.W indicates that the reduction only involves a transformation from hematite to magnetite. The plots show the average values, and the dashed line indicates the reduction degree expected if the hematite in the sinter is completely reduced to magnetite. The value of R.D.W is larger in the case of CO–H2 reduction than that of CO reduction. The major reason is as follows. It has been reported that there is no significant difference in the chemical reaction rate of the reduction from hematite to magnetite in a single particle ore between CO/CO2 and H2/H2O atmospheres.10) The interdiffusion coefficient, De of H2/H2O gas in the sinter particle is higher than that of CO/CO2.11) The increase in the R.D.W value of sinter reduced by CO becomes less significant as the reduction time increases from 3.6 to 7.2 ks, and that for the sinter reduced by CO–H2 gas decreases near 3.6 ks and after 5.4 ks. On the other hand, R.D.XRD shows consistently lower values than does R.D.W, while it increases with increasing reduction time. Finally, it approaches a constant value after 3.6 ks of reduction time, for both CO and CO–H2. This behavior implies that the reduction of hematite to magnetite is nearly complete by this time. Under all conditions at this temperature, no formation of wüstite was confirmed by XRD analysis, though the oxygen potential was in the thermodynamically stable region for wüstite. This result indicates that the reduction reaction of hematite and calcium ferrite at 873 K proceeds in the same manner as in the reaction at 773 K, as described in the previous study3) and the difference between R.D.W and R.D.XRD is caused by the reduction of calcium ferrite.

Changes in reduction degrees obtained from weight changes and XRD profiles for reduction of the sinter by CO and CO–H2 at 873 K.
Table 5 shows the phase changes of ACF–A with reduction time in sinter reduced by CO and CO–H2 gas at 873 K. In both gas conditions, the C3WF7 phase has already formed after a 1.8 ks reduction time. The phase for which the (Ca + Mg) / (Fe + Al) ratio is less than 0.15 forms in ACF–A by CO gas reduction after 7.2 ks and by CO–H2 reduction after 3.6 ks. These times are consistent with when the reduction rates re-ascended after having temporarily decreased, as shown in Fig. 5. Since the quantitative analysis of oxygen is difficult by EDX, it is estimated that this phase is magnetite formed through the calcium ferrite reduction. It is supported by the XRD analysis showing no peak corresponding to wüstite and the increase in the intensity of the magnetite peak even after completion of the hematite reduction. From microstructure observation, the structural changes as the destruction of ACF–A phase was observed after a 1.8 ks reduction same as the case at 773 K. Similarly to the ACF–A results, the ACF–B results also confirmed the formations of the C3WF7 phase after reduction for 1.8 ks in both conditions and of the magnetite phase originating from calcium ferrite with a ratio of less than 0.15 by CO gas reduction for 7.2 ks and by CO–H2 reduction for 5.4 ks. In contrast to the reduction of ACF–A, there was no structural change in the calcium ferrite phase while reduction proceeded. Further, there was no phase and shape changes for CCF after reduction by CO and CO–H2 gas at 873 K for 9.0 ks. From these results, it can be concluded that the reducibility of acicular calcium ferrite is higher than that of columnar calcium ferrite at low temperatures such as 773 and 873 K and that the reducibility of the phase surrounded with skeletal hematite is higher than that of the phase without it. This behavior agrees with the previous report that the reducibility of calcium ferrite is influenced by the diffusivity of reducing gas in the sinter.3) Furthermore, calcium ferrite surrounded with skeletal hematite was broken by the stress caused by a volume change during the reduction of hematite to magnetite, and many cracks formed as shown in Fig. 6. Therefore, the reducibility of calcium ferrite surrounded with hematite is increased.
| Phases (Ca/Fe) | CF (0.5) | CF2 (0.25) | C3WF7 (0.20) | C4WF4 (0.44) | CWF (0.33) | CW3F (0.20) | FeOx (~0.15) | |
|---|---|---|---|---|---|---|---|---|
| Sinter | ○ | ○ | ○ | ○ | ||||
| Reduced by CO | 1.8 ks | ○ | ○ | ○ | ○ | |||
| 3.6 ks | ○ | ○ | ○ | ○ | ||||
| 5.4 ks | ○ | ○ | ○ | |||||
| 7.2 ks | ○ | ○ | ○ | ○ | ○ | |||
| 9.0 ks | ○ | ○ | ○ | |||||
| Reduced by CO–H2 | 1.8 ks | ○ | ○ | ○ | ○ | ○ | ||
| 3.6 ks | ○ | ○ | ○ | ○ | ○ | ○ | ||
| 5.4 ks | ○ | ○ | ○ | ○ | ○ | |||
| 7.2 ks | ○ | ○ | ○ | ○ | ○ | |||
| 9.0 ks | ○ | ○ | ○ | ○ | ||||

SEM images of acicular calcium ferrite A reduced a) by CO gas for 1.8 ks and b) by CO–H2 gas for 1.8 ks at 873K. M: Magnetite, ACF: Acicular calcium ferrite.
Figure 7 shows the change in the reduction degree of sinter reduced by CO and CO–H2 gas at 973 K. The reduction by CO–H2 gas is accelerated compared to that by CO gas. Furthermore, the reduction degree increases higher than that at 873 K, as shown in Fig. 5. The changes in hematite, magnetite, and wüstite compositions as calculated from an internal standard method based on XRD are shown in Fig. 8. This figure shows that hematite has been reduced completely by CO gas after 5.4 ks and by CO–H2 gas after 3.6 ks. In addition, the magnetite composition increases with passing reduction time. It reaches a peak value, and then decreases gradually. Wüstite forms after reduction for 1.8 ks under both gas conditions. This behavior explains the increase in reduction degree above that at 873 K. The changes of each calcium ferrite phase in sinter reduced by CO and CO–H2 gas are listed in Table 6. The behavior of ACF-A is similar to that at 873 K, and the formation of wüstite is confirmed.

Changes in reduction degrees obtained from weight changes and XRD profiles for reduction of the sinter by CO and CO–H2 at 973 K.

Changes in mass fractions of iron oxides in the sinter reduced by CO and CO–H2 at 973 K (Estimated by XRD profile).
| Phases (Ca/Fe) | CF (0.5) | CF2 (0.25) | C3WF7 (0.20) | C4WF4 (0.44) | CWF (0.33) | CW3F (0.20) | FeOx (~0.15) | ||
|---|---|---|---|---|---|---|---|---|---|
| ACF–A | Sinter | ○ | ○ | ○ | ○ | ||||
| Reduced by CO | 1.8 ks | ○ | ○ | ○ | ○ | ○ | ○ | ||
| 3.6 ks | ○ | ○ | ○ | ○ | |||||
| 5.4 ks | ○ | ○ | ○ | ○ | ○ | ||||
| Reduced by CO–H2 | 1.8 ks | ○ | ○ | ○ | ○ | ||||
| 3.6 ks | ○ | ○ | ○ | ○ | |||||
| 5.4 ks | ○ | ○ | ○ | ○ | |||||
| ACF–B | Sinter | ○ | ○ | ○ | ○ | ||||
| Reduced by CO | 1.8 ks | ○ | ○ | ○ | ○ | ○ | ○ | ||
| 3.6 ks | ○ | ○ | ○ | ||||||
| 5.4 ks | ○ | ○ | ○ | ||||||
| Reduced by CO–H2 | 1.8 ks | ○ | ○ | ○ | |||||
| 3.6 ks | ○ | ○ | |||||||
| 5.4 ks | ○ | ○ | ○ | ||||||
| CCF | Sinter | ○ | ○ | ||||||
| Reduced by CO | 1.8 ks | ○ | ○ | ||||||
| 3.6 ks | ○ | ○ | |||||||
| 5.4 ks | ○ | ○ | |||||||
| Reduced by CO–H2 | 1.8 ks | ○ | ○ | ||||||
| 3.6 ks | ○ | ○ | |||||||
| 5.4 ks | ○ | ○ | |||||||
In both gas conditions shown in Figs. 3 and 4, the formation of magnetite originating from a part of skeletal hematite is observed after reduction for 1.8 ks. After 5.4 ks, almost all skeletal hematite has been reduced. The destruction of calcium ferrite is observed after reduction by CO gas for 5.4 ks and by CO–H2 gas for 1.8 ks,3) whose calcium ferrite is identified as ACF–A. This result corresponds closely to the beginning of ACF–A reduction. This behavior may also be the reason why the RDI value of the sinter increased during these time periods even though the reduction of skeletal hematite did not proceed.3) On the other hand, there is no structural change in ACF–B though the reduction of ACF–B proceeds at that time. Different aspects of the structures were observed to change during the reductions of ACF–A and ACF–B because the stress to which ACF–A is subjected by the surroundings is larger than that to which ACF–B is subjected, due to the volumetric expansion of skeletal hematite in the sinter following the reduction to magnetite.9) This behavior may also lead to the destruction of the ACF–A phase. Furthermore, this destruction of ACF–A occurred after ACF–A reduction had progressed. Therefore, it is possible that the ACF–A phase was destroyed by the aforementioned compressive stress after the strength of the phase originating from ACF–A decreased by the phase change of calcium ferrite into such compounds as C3WF7.
Figure 9 shows the change in the RDI value with time for sinter reduced by CO and CO–H2 gas at 873 K. In both gas conditions, the RDI value rapidly increases for 3.6 ks, but further increasing the reduction time does not increase the RDI value. This rapid increase corresponds to the reduction progress of hematite and calcium ferrite, as described above. No change in the RDI value is found after the reduction of calcium ferrite by CO gas for 7.2 ks and by CO–H2 gas for 3.6 ks. Therefore, the increase in RDI value of sinter reduced at 873 K must result from the reduction of skeletal hematite to magnetite and that of CF in ACF–A to C3WF7. The changes in microstructure show similar behavior to those at 773 K.

Changes in RDI of the sinter reduced by CO and CO–H2 gas at 873 and 973 K.
To clarify the effect of calcium ferrite reduction on the disintegration of sinter, two sinter samples were compared which had the same values of R.D.XRD and different reduction extents of calcium ferrite. The samples compared were the sinter reduced by CO–H2 gas for 1.8 ks at 773 K (sample A) and that reduced by CO–H2 gas for 1.8 ks at 873 K (sample B). The difference between these samples is thus assumed to result from the calcium ferrite reduction. The values of R.D.XRD, the reduction degree caused by calcium ferrite, R.D.CF, and RDI value of sample A are 2.3%, 0.3%, and 34.0%, respectively. And, those of sample B are 2.1%, 1.8%, and 45.2%. Both samples have similar R.D.XRD values, but the R.D.CF of sample B is larger than that of sample A. Similarly, the RDI value of sample B is 11.2 higher than that of sample A. Low-temperature reduction disintegration of sinter is especially prominent at 798 K,12) and the RDI value drastically decreases with further increases in temperature. Therefore, the difference of the RDI values should be caused by the reduction of not hematite but calcium ferrite.
It is expected that the increase in RDI value following calcium ferrite reduction resulted from the increase in the amount of fine particles caused by the destruction of ACF–A, as shown in Figs. 3 and 4. The fine particles with the sizes of less than 45 µm were selected by sieving the particles formed during the drum test. These appearances observed by SEM are shown in Fig. 10. Many more acicular materials with sizes of approximately a dozen micrometers are observed in sample B than in sample A. The composition of these materials was similar to that of the CWF which was detected from ACF–A. Therefore, it is concluded that reduced ACF-A is very brittle and that loss of particles easily occurs during the drum test.

SEM images of fine particles in samples (a) A and (b) B after drum test. Samples A and B were reduced by CO–H2 gas for 1.8 ks at 773 and 873 K, respectively.
Figure 11 shows the change with reduction temperature of the weight ratio of particles smaller than 2.8 mm formed after the drum test, which is another means of comparison between samples A and B. The vertical axis is the value obtained by dividing the particle weight within each size range, W, by the sample weight after reduction, W1. Therefore, the sum of the W values is the RDI value. From the results observed by SEM, it is expected that the weight ratio of the particles smaller than 0.1 mm obtained from sample B is larger than that from sample A because ACF–A has a size of a dozen micrometers. Actually, however, the former is insignificantly smaller than the latter. On the other hand, the weight ratio of the particles larger than 0.25 mm obtained from sample B is greater than that from sample A. This result implies that the destruction of ACF–A has only minor effects on the change in the RDI value. The reason may be that the fine particles formed from ACF–A are very small and not very numerous.

Comparison of weight ratio of particles formed after drum test between samples A and B.
The reason why the RDI value increases is the increase in the amount of formed particles larger than 0.25 mm. Figure 12 shows the surface view of particles of sample A with sizes between 0.5 and 1.0 mm. Two major structures are observed. These compositions on the surface of the particles were analyzed by EDX. One is the smooth surface covered with calcium ferrite, with pores several dozen micrometers in size, as shown in Fig. 12(a). This structure is caused by the crack formation due to the volume expansion and its extension to the calcium ferrite phase, as shown in Fig. 4(b)-1. The reason why the pores are observed is that the crack passes through the pores. The other structure is iron oxide, which may be magnetite, as shown in Fig. 12(b). It seems that the crack extension reaches to the magnetite phase formed by the reduction. Figure 13 shows the major surface appearance of the particles of sample B. There are acicular phases in the magnified area of the surface. This structure results from the large crack formation due to the destruction of calcium ferrite.

SEM images of small particles in sample A after drum test with the size of 0.5–1.0 mm.

SEM images of calcium ferrite particle of sample B.
The change with time in the RDI value of the sinter reduced by CO and CO–H2 gas at 973 K is also shown in Fig. 8. The RDI value is much lower in this figure than that at 773 and 873 K. In spite of the increasing reduction degree during the first 1.8 ks of reduction by CO and CO–H2 gas, as shown in Fig. 10, the RDI value does not change. Figure 14 shows the microstructures originating from a) ACF–A, b) ACF–B, c) CCF, and d) skeletal hematite in the sinter reduced at 973 K. The rounding off and connections between phases are observed. Furthermore, points where the cracks appear to repair are observed, as indicated by the circles in Fig. 14. These contribute to the decrease in the RDI value. It has a possibility that the crack density and the amount of ACF-A loss decreases because increasing the reduction temperature leads to decreasing the stress caused by the reduction of hematite.13)

SEM images of (a) acicular calcium ferrite A (ACF–A), (b) acicular calcium ferrite B (ACF–B), (c) columnar calcium ferrite (CCF), and (d) iron oxide (FeOx) in the sinter reduced at 973 K.
To clarify the effect of the reduction of calcium ferrite on the disintegration behavior of sinter by N2–CO–CO2–H2–H2O gas in the temperature range from 773 to 973 K, reduction disintegration tests of sinter were carried out under various reduction conditions. The following results were obtained:
(1) In the sinter used in this study, calcium ferrites of acicular and columnar structures existed. There are two types of acicular calcium ferrites. One is surrounded by skeletal hematite, and the other is not. These phases have wide composition ranges, while the former has a relatively higher composition of SiO2, and they include many compounds which are mainly CF and CF2, described as a CaO–Fe2O3 binary system. The composition range of columnar calcium ferrite is smaller than that of acicular calcium ferrite, and the dominant compounds are CF2 and C3WF7.
(2) At 773 K, a long reduction time leads to the progress of acicular calcium ferrite reduction, which is observed after a shorter time in case of reduction by H2 containing gas, and the reduction of hematite to magnetite in the sinter mainly proceeds. On the other hand, columnar calcium ferrite is not reduced at this temperature. It seems that the diffusion of the reducing gas is difficult compared with the case of acicular calcium ferrite coexisted with small pores, because the surrounding area of columnar calcium ferrite is not pores but dense slag phases.
(3) At 873 K, the acicular calcium ferrite is reduced for a shorter time than that at 773 K. Acicular calcium ferrite surrounded by skeletal hematite becomes fragile by the reduction, and it is broken. This behavior is caused by the stress due to the volume expansion during skeletal hematite reduction. At the same time, fine acicular particles with sizes of a dozen micrometers form, but the direct effect of this powder formation on the RDI value is small. However, cracks form due to the connection of pores caused by this falling, and the sinter becomes weak. Therefore, the formation of the particles larger than 0.25 mm accelerates. Accordingly, the RDI value increases.
(4) At 973 K, the RDI value is much smaller than that at 773 and 873 K. Further reduction for 1.8 ks does not increase the RDI value; instead, it remains constant. The reason is that, at higher temperature, the volume expansion of skeletal hematite becomes small, and the cracks formed in the sinter repair.