Abstract
Thermomechanical treatments for manipulating grain boundary microstructure in 10 wt%Cr ferritic-martensitic steel SUH3 have been studied. Material with a high fraction of coincidence site lattice (CSL) boundaries was successfully produced and subjected to steam oxidation tests to demonstrate the utility of grain boundary engineering. Introducing a high fraction of twin boundaries in austenite resulted in a significant increase in the number of CSL boundaries along the prior austenite grain boundaries in martensite. In addition, grain boundary engineering introduced a high density of subblock structures in martensite, which resulted in a homogeneous distribution of fine precipitates in tempered martensite. Steam oxidation tests demonstrated that grain boundary engineering for SUH3 steel can achieve enhanced oxidation resistance.
1. Introduction
More than 30% of the total CO2 gas is emitted from thermal power plants in the world. In the face of worldwide environmental challenges such as climate change, it is critical to increase the conversion efficiency of thermal power plants to decrease gas emissions. The latest generation of thermal power plants is running with a conversion efficiency of 43% at operating temperature of 893 K. It is essential to increase operating temperatures to further reduce CO2 gas emission from the thermal power plants. Ferritic steels with a tempered martensitic microstructure are usually used as heat-resistant materials for boilers, turbines and pipework in thermal power plants, which operate between 723 K and 893 K under steam oxidation conditions. Extensive studies have reported that prior austenite grain boundaries (PAGB) behave as preferential sites for creep fracture when the prior austenite grains are coarse.1,2) In addition, the PAGB act as preferential sites for the precipitation of coarse carbides and void nucleation, and for recovery of high-density dislocations that promotes the formation of coarse subgrains near PAGB.3,4,5,6,7) Thus, if we can control the properties of PAGB and reduce the frequency of these phenomena, we can expect superior heat-resistant ferritic steels that are able to withstand higher operating temperature to increase thermal efficiency.
Grain boundary engineering, which can be used to enhance material properties,8,9) is not commonly applied to materials with body-centered cubic structures. This is likely because of the difficulty of introducing coincidence site lattice (CSL) boundaries, particularly Σ3 twins and their related CSL boundaries, such as Σ9, into materials with a high stacking fault energy. Gupta et al.10) applied a thermomechanical processing route consisting of cold-rolling with several reduction ratios and subsequent annealing at 1323 K for 3.6 ks to manipulate the grain boundary character distribution in a 9 wt% Cr steel T91, and found that this processing route could increase the fraction of CSL boundaries. Subsequently, Was et al.11) and Gupta and Was12) demonstrated that the creep resistance of the ferritic steel T91 was improved by increasing the density of subgrain boundaries. Recently, one of the authors of current study proposed a new processing route for controlling grain boundary microstructure in 12 wt% Cr ferritic steel with a combination of thermomechanical treatments, including hot-rolling and subsequent annealing, and found that the fraction of CSL boundaries along PAGB in martensite increased with the increasing fraction of prior austenite CSL boundaries.13) The microstructure resulting from this processing for a 10 wt% Cr ferritic steel SUH3 is the topic of the present study, with the aim of confirming the effect of grain boundary control on the steam oxidation resistance.
2. Experimental Procedures
The material used in this study was a 10 wt% Cr ferritic steel SUH3 with chemical composition 10.13Cr-0.41C-1.88Si-0.25Mn-0.28P-0.09S-0.21Ni-0.71Mo-0.10Cu (wt%). This as-received material was austenized at 1303 K for 2.7 ks and oil quenched, and then tempered at 1003 K for 3.6 ks. To introduce a high fraction of annealing twins in the austenite phase, the as-received samples were austenized at 1373 K for 2.7 ks, and then hot-rolled to reduction ratios from 5 to 30%. These hot-rolled samples were subsequently annealed at 1373 K for 2.7 ks and then air-cooled. Thereafter, the samples were subjected to tempering at 1003 K for 3.6 ks. These samples are hereafter referred as to grain boundary engineered samples.
Quantitative evaluation of grain boundary microstructure was performed using scanning electron microscopy (SEM) and electron backscatter diffraction (EBSD) using a Hitachi S-4200 FE-SEM equipped with the TSL’s OIM system, operating at accelerating voltage of 20 kV, beam current of 10 μA, and a step size of 0.25–0.30 μm. For EBSD observation, samples were electro-polished at a voltage of 10 V and a current density of 0.2×10⁻² A/mm2, at 277 K using a solution of acetic acid 0.77: perchloric acid 0.23. The presence of PAGB and twin boundaries in the austenite phase was crystallographically determined using SEM/EBSD analysis, assuming the Kurdjumov-Saches orientation. The details of this procedure have been outlined in a previous publication.13) In addition, SEM and transmission electron microscopy (TEM) were used to observe the morphology and distributions of M23C6 carbides in the tempered conventionally processed and grain boundary engineered samples. TEM observations were conducted using a JEOL JEM-2000FX operating at 200 kV. The thin foils suitable for TEM observations were prepared by a twin-jet electropolishing in the mixture of acetic acid 0.90: perchloric acid 0.10: methanol 0.10, working at 278 K, 20 V, and 0.05 A/mm2.
Steam oxidation tests were performed at temperatures ranging from 873 to 1073 K under 100% H2O, and the resultant samples were subjected to SEM observation and electron probe microanalysis (EPMA). The samples for the steam oxidation tests were mechanically polished with #600 SiC waterproof paper and then chemically etched with 10% oxalic acid to remove surface strain. EPMA was performed using a Shimadzu EPMA-1720H operating at an accelerating voltage of 15 kV.
3. Results and Discussion
3.1. Microstructure Characterization
Figures 1(a) and 1(b) show SEM micrographs of the cross-section and surface, respectively, of as-received material. These micrographs show a typical lath martensitic microstructure with several PAGB visible and formation of many precipitates on the grain boundaries. Figure 2 shows SEM micrographs of the samples that were hot deformed at 1373 K using reduction ratios (a) 0%, (b) 5%, (c) 10%, and (d) 20%, and subsequently annealed at 1373 K for 2.7 ks. These micrographs also show a typical lath martensitic microstructure with several PAGB. The prior austenite grains increase with increasing reduction ratio but decrease at a 20% reduction ratio. Figure 3 shows the change in the average prior austenite grain size with the reduction ratio. For comparison, the prior austenite grain size in as-received materials is also shown in Fig. 3. The average size of prior austenite grains increased with increasing reduction ratio up to 10%, then decreased at the reduction ratio of 20%. The strain introduced by hot-rolling may have promoted grain boundary migration in material with a reduction ratio of less than 10%, and then induced recrystallization when the reduction ratio reached 20%. In a previous experience, we found that the grain boundary migration is often accompanied by formation of annealing twins in materials with low stacking fault energy.13) Therefore, we can expect that a high fraction of twin boundaries, which correspond to the {111} Σ3 grain boundary, would be introduced into the austenite phase for the sample rolled at a 10% reduction ratio.


Figures 4 and 5 present the EBSD micrographs for the as-received samples and for the sample hot-rolled at 1373 K with a 10% reduction ratio and subsequently annealed at 1373 K for 2.7 ks, respectively. Figures 4(a) and 5(a) display the image quality (IQ) maps showing the character of individual grain boundaries in the martensite phase, while Figs. 4(b) and 5(b) present the inverse pole figure (IPF) maps showing the PAGB, twin boundaries, and Σ3n boundaries in the austenite phase. In Figs. 4(a) and 5(a), low angle, Σ3, Σ5–Σ29b, and random grain boundaries are displayed by blue, red, white, and black lines, respectively. In Figs. 4(b) and 5(b), PAGB, prior austenite Σ3 boundaries (twin boundaries), and prior austenite Σ3n boundaries are shown by black, red and green lines, respectively. Comparing these maps, we find that the number of low-angle grain boundaries, which likely correspond to subblock boundaries in martensite, is significantly increased by hot-rolling and subsequent annealing. There is also an increase in prior austenite grain size following hot-rolling and annealing. Figure 6 shows the length fraction of low-angle, CSL, and random grain boundaries in the as-received samples and in the sample hot-rolled at 1373 K with a 10% reduction ratio and subsequently annealed at 1373 K for 2.7 ks. In the as-received samples, the fractions of random grain boundaries, low-angle grain boundaries, and CSL boundaries were found to be 0.50, 0.22, and 0.28, respectively. The fraction of low-angle grain boundaries in the sample hot-rolled at 1373 K with 10% reduction ratio (0.50) was high in comparison with that of the as-received samples. Conversely, the fraction of random grain boundaries decreased following hot-rolling and annealing. In addition, the Σ3 grain boundaries (twin boundaries) in the austenite phase appear to increase following this thermomechanical treatment. Annealing twin boundaries are typically very straight-sided. However, twin boundaries identified often have an irregular-shaped interface. This is because, at coherent twin boundaries in austenite, the martensite variants formed are often the variants “sheared” between the twin-related austenite grain and the parent austenite grain, giving a continuous packet across the prior austenite twin boundary. Thus, it is difficult to determine precisely the position of the twin boundary, and experimentally identified twin boundaries can have an irregular-shaped interface.

Figure 7 shows the relationship between the fraction of the prior Σ3n grain boundaries and the reduction ratio. The fraction of twin-related boundaries in prior austenite
f
(Σ
3
n
)
(γ)
is given by
|
f
(Σ
3
n
)
(γ)
=
L
(Σ
3
n
)
(γ)
L
(total)
(γ)
,
| (1) |
where
L
(Σ
3
n
)
(γ)
is the total length of Σ3
n grain boundaries in austenite and
L
(total)
(γ)
is the total length of all grain boundaries in prior austenite. Changes to the fraction of Σ3
n grain boundaries in austenite with the reduction ratio follow a similar trend to that of prior austenite grain size. The fraction of Σ3
n grain boundaries increased with increasing reduction ratio and showed the maximum value of 0.7 at a 10% reduction ratio. This fraction decreased at a 20% reduction ratio. This suggests that grain boundary migration may be accompanied by twin formation.
Figure 8 shows the relationship between the fraction of CSL boundaries along the PAGB in martensite and the reduction ratio. The fraction increased up to 0.33 at a 10% reduction ratio. These results indicate that the 10% reduction ratio is the optimal condition for introducing a high fraction of CSL grain boundaries along PAGB in martensite. Hereafter, the sample thermomechanically treated with this reduction ratio is described as grain boundary-engineered (GBEed) material.
Figure 9 shows the relationship between the fraction of Σ3
n grain boundaries in austenite and the fraction of CSL boundaries along the PAGB in martensite. For comparison, data obtained from 12 wt%Cr steel
13) is also shown in
Fig. 9. As expected, the fraction of CSL boundaries along the PAGB increases monotonously with the increasing fraction of Σ3
n grain boundaries in austenite, irrespective of the grade of steels.
3.2. Carbide Particles
SEM micrographs presented in Figs. 10(a) and 10(b) show the distribution of precipitates in as-received and GBEed material tempered at 1003 K for 3.6 ks, respectively. We confirmed that these precipitates were Cr23C6 carbide from the selected-area electron diffraction pattern as shown in Fig. 11. Grain boundary engineering of SUH3 steel can significantly enhance the fraction of subblock boundaries, which act as preferential nucleation sites of Cr23C6 carbides, and lead to finely dispersed precipitates. Furthermore, a high fraction of CSL boundaries along PAGB is responsible for preventing precipitates on these boundaries from coarsening, as the diffusivity of CSL boundaries is generally lower than that of random boundaries.


Figure 12 presents the size distribution of precipitates on the PAGB (Figs. 12(a) and 12(b)) and in the grain interior (Figs. 12(c) and 12(d)). These distributions in Figs. 12(a) and 12(c) were obtained from the as-received sample and those in Figs. 12(b) and 12(d) were obtained from the GBEed material. The average sizes of precipitates on the PAGB and in the grain interior were 441 nm and 324 nm, respectively, in the as-received sample, and 163 nm and 114 nm, respectively, in the GBEed material. In addition, the number of precipitates per unit of area was estimated to be 1.10/μm2 in the as-received material and 5.35/μm2 in the GBEed material. This indicates that the precipitates were dispersed more densely in the GBEed material than in the as-received one. This result suggests that grain boundary engineering of SUH3 steel could achieve enhanced high-temperature strength. Experimental measurement of the high-temperature strength is necessary to quantify any improvement made by grain boundary engineering.

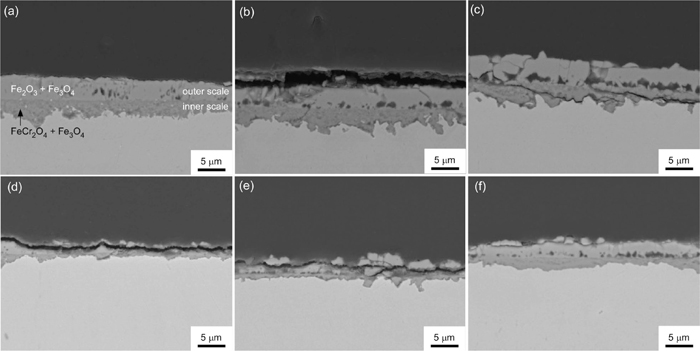
High-temperature steam oxidation tests were carried out from 873 K to 1073 K for the GBEed and the as-received materials. Figure 13 presents SEM micrographs that show the formation of oxide scales at the surfaces of the (a, b, c) as-received and (d, e, f) GBEed materials after the steam oxidation tests at different temperatures for 86.4 ks. These micrographs reveal that two distinct oxide scales were formed, that is, an outer scale and an inner scale, for both materials. Previous studies14,15,16) suggest that the outer and inner scales should comprise Fe2O3+Fe3O4 and FeCr2O4+Fe3O4, respectively. One interesting observation from the SEM micrographs is that the oxide scales in the GBEed material is thinner than the as-received material, which suggests that grain boundary engineering is useful for enhancing the steam oxidation resistance. Figures 14(a) and 14(b) shows changes in the average thickness of the outer and inner oxide scales, respectively, with temperature. Because there was a large variation of the thickness of oxide scales formed in the GBEed material, whereas the thickness of the oxide scales in the as-received materials was approximately homogeneous, the thickness of the oxide scales in the GBEed materials was distinctively evaluated at the areas with thin and thick oxide scales. The thickness of the inner oxide scale in the as-received material decreased with increasing temperature, whereas the inner oxide scale thickness in the GBEed material slightly increased with increasing temperature. Thickness of the outer scales increased up to 973 K, then decreased at 1073 K in both as-received and GBEed materials. Formation of outer and inner oxide scales is governed by outward diffusion of Fe ions and by inward diffusion of O ions, respectively. The diffusivity of O ions in Fe3O4 is reported to be much lower than that of Fe ions,17) so that the thickness of the inner oxide scale may decrease as the thickness of the outer oxide scale increases at temperatures between 873 K and 973 K. However, the thickness of both the outer and inner oxide scales decreased at 1073 K compared with the thicknesses at 973 K. This could be attributed to quick formation of a Cr- and Si-enriched layer, which would act as barrier for diffusion of Fe and O ions as described below.

Results of chemical analysis of the oxide scales formed at 973 K using the EPMA is shown in Fig. 15(a) as-received material and 15(b) GBEed material. The EPMA chemical maps reveal that the outer and inner oxide scales are likely composed of Fe3O4 and (Fe,Cr)3O4, respectively, which is consistent with previous reports.14,15,16) Moreover, Cr and Si enrichment is observed at the interface between the inner scale and the base material in the both samples. Formation of a Cr- and Si-enriched layer would cause a decrease in the oxidation rate because such a layer would act as a barrier for the outward diffusion of Fe ions and the inward diffusion of O ions. The enrichment of Cr and Si at the interface should occur more readily with increasing temperature. This could explain why the thickness of the outer oxide scale formed at 1073 K was less than the thickness at 973 K. The enhanced oxidation resistance observed in the GBEed material could be attributed to the increase in the fraction of subblock boundaries in martensite, as well as the increase in the fraction of CSL boundaries along PAGB. The subblock boundaries can act as short-circuit diffusion paths for Cr and Si atoms towards the surface. Thus, the Cr- and Si-enriched layer at the scale/base material interface would form more readily in the GBEed material than in the as-received material. Consequently, the GBEed materials may demonstrate enhanced oxidation resistance compared with the conventionally processed as-received material.

4. Conclusions
The effect of grain boundary engineering of SUH3 ferritic steel on the steam oxidation resistance was investigated. The primary results obtained are as follows.
(1) The fraction of CSL boundaries along the PAGB in martensite increased with the increasing reduction ratio. A maximum fraction of 0.33 was obtained at a 10% reduction ratio, suggesting that the 10% reduction ratio would be the optimal condition for introducing a high fraction of CSL grain boundaries along PAGB in martensite for SUH3 ferritic steel.
(2) The fraction of CSL boundaries along PAGB was found to increase monotonously by increasing the fraction of Σ3n grain boundaries in austenite, irrespective of the grade of steels.
(3) The precipitates were dispersed more densely in the GBEed material than in the as-received material.
(4) The GBEed material may have achieved enhanced oxidation resistance compared with conventionally processed as-received material.
Acknowledgments
The authors thank Dr. T. Yamamuro (Kumamoto Univerisity) for his help with the experimental work. This study was supported by the Iron and Steel Institute of Japan Research Promotion Grant and by the Japan Society for the Promotion of Sciences KAKENHI for Basic Research (A) (Grant No. 24246125). These supports are greatly appreciated.
References
- 1) S. H. Hong and J. Yu: Scr. Metall., 23 (1989), 1057.
- 2) K. Kimura, N. Ohi, K. Shimazu, T. Matsuo, R. Tanaka and M. Kikuchi: Scr. Metall., 21 (1987), 19.
- 3) C. R. Brooks and F. Bogni: Mater. Charact., 38 (1997), 103.
- 4) M. Matsui, M. Tabuchi, T. Watanabe, K. Kubo, J. Kinugawa and F. Abe: ISIJ Int., 41 (2001), S126.
- 5) F. Abe, T. Horiuchi, M. Taneike and K. Sawada: Mater. Sci. Eng. A, 378 (2004), 299.
- 6) F. Abe: Sci. Tech. Adv. Mater., 9 (2008), 013002.
- 7) F. Abe: Mater. Sci. Eng. A, 510–511 (2009), 64.
- 8) T. Watanabe: Res Mechanica, 11 (1984), 47.
- 9) T. Watanabe and S. Tsurekawa: Acta Mater., 47 (1999), 4171.
- 10) G. Gupta, B. Alexandreanu and G. S. Was: Metall. Mater. Trans., 35A (2004), 717.
- 11) G. S. Was, B. Alexandreanu, P. Andresen and M. Kumar: Mater. Res. Soc. Symp. Proc., Vol. 819, Material Reserch Society, Warrendale, Pennsylvania, (2004), N2.1.1.
- 12) G. Gupta and G. S. Was: Metall. Mater. Trans., 39A (2007), 150.
- 13) Y. Kinoshita, V. A. Yardley and S. Tsurekawa: J. Mater. Sci., 46 (2011), 4261.
- 14) S. Hayashi, M. Fukumoto, S. Maeda and T. Narita: Zairyo-to-Kankyo, 51 (2002), 115.
- 15) Y. Yutaka, Y. Yi, T. Kondo, K. Suzuki and K. Kano: Zairyo-to-Kankyo, 50 (2001), 50.
- 16) I. G. Wright and R. B. Dooley: Int. Mater. Rev., 55 (2010), 129.
- 17) M. Backhaus-Ricoult and R. Dieckmann: Ber. Bunsenges. Phys. Chem., 90 (1986), 690.


