Abstract
In this paper, microstructural evolution under creep deformation was investigated by using a simple 0.2%C-9%Cr steel to reveal effects of dislocation substructure on creep strength in addition to creep deformation behavior in high Cr martensitic steels. Whereas strain versus creep rate curves are composed of simple primary and tertiary creep stages on the steel tested at higher applied stress condition, complicated variation in creep rate are found on the curves examined at lower stress levels under a temperature of 873 K. Formation of cellular dislocation network substructure is observed in the early periods of the primary creep stage on the steel tested at a lower stress. Such substructure is stable until onset of acceleration creep. The degradation of the substructure is due to coarsening and condensation of the carbides existing along the lath boundaries. An increase in yield stress at elevated temperature and internal back stress in the whole course of the transient creep region are provided by the cellular dislocation network substructure having highly dense dislocation walls where intralath dislocations move and integrate in the early periods after loading. The complicated variation in creep rate at the lower stress conditions is caused by accumulation and partial disappearance of dislocations at cell and lath boundaries. It can be concluded from above results that dislocations act a key role for strengthening against creep deformation.
1. Introduction
9–12% Cr martensitic heat resistant steels have been developed and widely utilized as boiler and turbine components in high temperature steam condition power plants with highly thermal and power generating efficiency.1,2) Those steels show a tendency to decrease in long-term creep strength, which the rupture time is lower than that estimated from the short-term data,3,4,5) and microstructural investigations have been consequently conducted to reveal the mechanism of premature failure.6,7,8,9,10,11,12)
Tempered martensite microstructure having some kind precipitates as well as packet, block and lath structure is obtained after conventional normalizing and tempering heat treatments in high Cr steels.13) It is generally recognized that the recovery of lath structure progresses during creep exposure and the widths of laths increase gradually with an increase in time. Change in the widths is a key parameter in estimation of microstructural damage degree, and those sizes have been therefore investigated and discussed by many researchers.6,7,8,9,10,11,12,13,14,15,16,17,18,19,20) Cell like dislocation substructure, so-called subgrain structure appears after the tempering heat treatment or in the course of the primary creep stage. Such substructure consists of hard walls in which dislocations cluster, together with precipitates such as M23C6 carbides, and soft cell inside regions having lower density dislocations.18,19) It is important to stabilize such subgrain structure during creep since the hard regions represent obstacles to dislocation motion and it retards the coarsening of lath widths during creep exposure.18,19,21) Carbides existing around the subgrain boundaries contribute the stability of the subgrain network structure, and therefore coarsening behavior of carbides have been mainly discussed in most papers. On the other hand, dislocation cells produced with cold rolling promote the onset of acceleration creep much more than the high density of dislocations introduced during martensitic transformation in 9%Cr-1%W steel.22) Long-term creep rupture strength, moreover, drops significantly on specimens subjected to lower temperature tempering heat treatment in the case of 12%Cr heat resistant steels for boiler because of an acceleration in softening and recovery by the higher density dislocations.23) The latter two papers are such that large amount of mobile dislocations promotes degradation of microstructure during creep exposure and thereby decreasing creep strength.
Dislocations forming subgrain substructure contribute to stabilize microstructure against creep deformation despite the results that they cause significant degradation of the microstructure during creep in high Cr heat resistant steels as mentioned above. Such inconsistency is due to that a role of dislocation substructure is still unclear in those steels. In this study, dislocation substructure evolution under creep deformation was investigated by using a simple 0.2%C-9%Cr steel to reveal effects of dislocation substructure on creep strength in addition to creep deformation behavior in high Cr martensitic steels.
2. Experimental Procedure
Chemical composition of steel examined in this study is shown in Table 1. The aim of 0.2%C addition is to avoid the formation of delta ferrite. A 50 kg ingot having the chemical composition was manufactured with vacuum induction melting followed by pouring into a mold. The ingot was forged at 1423 K and wrought into a bar having a square cross section of 85 mm on a side and a length of around 850 mm. Samples for heat treatments with a square cross section of 23 mm on a side and a length of 130 mm were cut from the bar annealed at 1023 K after forging process. The heat treatments consisted of solution treatment at 1423 K for 1.8 ks followed by cooling to a room temperature in water and tempering treatment at 923 K for 18 ks. Uninterrupted creep tests were carried out under the applied stress ranging from 60 to 140 MPa at a temperature of 873 K with specimens having a gauge diameter of 10 mm and a gauge length of 50 mm. Interrupted creep tests were also performed under the condition of 60 MPa and 873 K. Tensile tests at 873 K were conducted with an Instron type testing machine and the specimens having a gauge diameter of 10 mm and a gauge length of 50 mm. Stress strain curves were measured with clip type strain gauge up to around 0.004 under a strain rate of 5×10⁻⁵ s−1. Some of these specimens for the tensile tests were subjected to creep pre-strained treatments at 60 MPa and 873 K for various time up to 500 ks in the same way as the creep test. The durations of creep pre-strained were not so long that the heating changes nothing but color of specimen surface, and there was no influence of the surface condition on stress in the tensile tests.
Table 1. Chemical composition of steel studied (mass%).
| C | Si | Mn | P | S | Cr | N |
|---|
| 0.21 | 0.02 | 0.29 | 0.003 | 0.002 | 9.01 | 0.0017 |
Microstructure observations were carried out with an optical microscope, a transmission electron microscope (TEM) and a scanning transmission electron microscope (STEM). Samples for the microstructure observations were taken from a specimen subjected to the heat treatments and from the gauge portions of creep-interrupted and creep-ruptured specimens. A portion of 25 mm from the fracture surface was excluded on the ruptured specimen for microstructural observations. Thin foils were prepared for TEM observations. Dislocation density was measured by two methods of X-ray diffraction analysis24) and TEM observation.
3. Results and Discussion
3.1. Microstructure after Heat Treatments and Creep Deformation Behavior
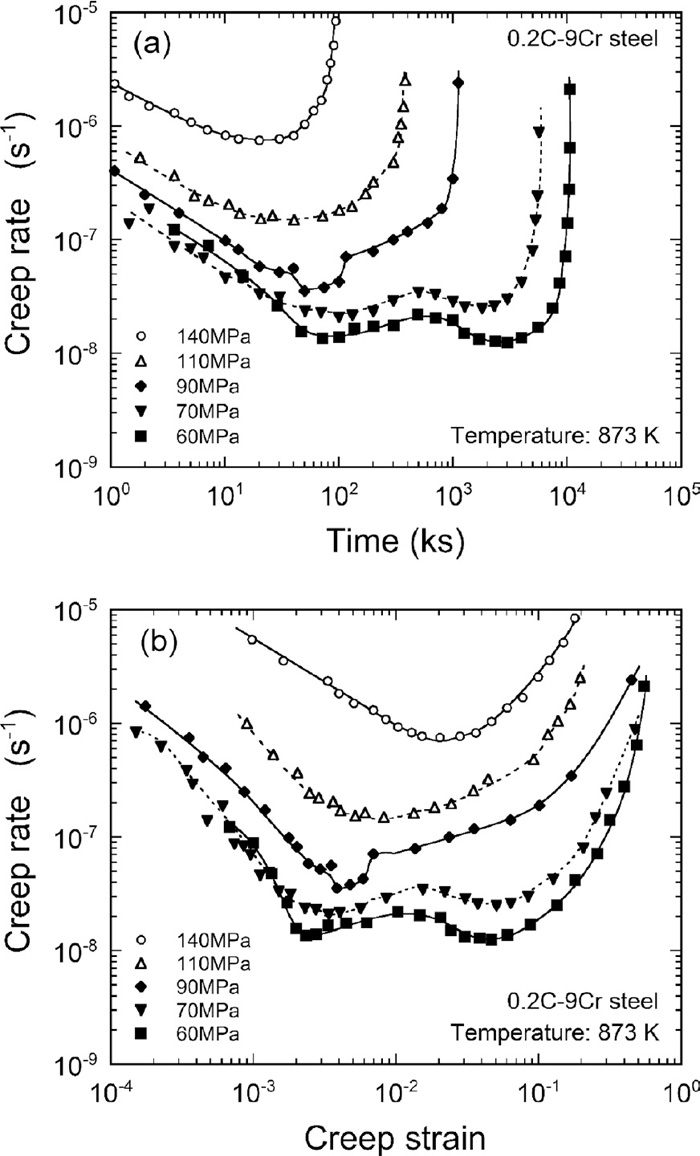
Figure 1 displays an optical micrograph (a) and a TEM image (b) of the steel studied after the heat treatments. The sample has tempered martensitic microstructure and the average prior austenite grain diameter of about 100 μm. Electron microscopic investigations reveal fine martensitic lath structure, dense dislocations inside the laths and spherical or oval shape carbides along the lath boundaries. Average lath width is roughly 280 nm and those particle sizes are in the range from 70 to 350 nm roughly. Although there are fine carbides inside the laths, the number density is extremely low and most of the precipitates exist at those boundaries. Figure 2 illustrates the time versus creep rates curves (a) and the creep strain versus creep rate curves (b) on the steel under the applied stress conditions ranging from 60 to 140 MPa at 873 K. Whereas the creep curves are composed of simple primary and tertiary creep regions on the samples tested at the higher stress conditions more than 110 MPa, the curves at the lower stresses show complicated variation in the creep rate and two minimal values of the creep rate seem to appear on each of them. For instance, under the lower stresses of 60 MPa, the creep rates reach first and second minimal values at the creep strains of around 3×10⁻³ and 5×10⁻², respectively. Similar fluctuation in creep rates under applied stress conditions have been recognized as to low alloy steels such as 2.25Cr-1Mo,25,26,27,28) 1.25Cr-0.5Mo-Si,29) 0.2C30) and 1Cr-0.5Mo31) steels but the 9Cr-1Mo steel boiler materials.32,33) Some of the papers have discussed the reasons why complicated creep curves appear. In the case of 2.25Cr-1Mo steel, such behavior is due to the influences of solution strengthening with Mo and C and precipitation hardening by Mo2C,25) and it is relevant to the disappearance of enhanced microstructural factors because of change in microstructure during creep on 0.2 steel.30) Most papers have pointed out that microstructure has influences on complicated creep rate curves, and the variation in creep rates found in the present steel also seems to have a relation to microstructural evolution during creep.

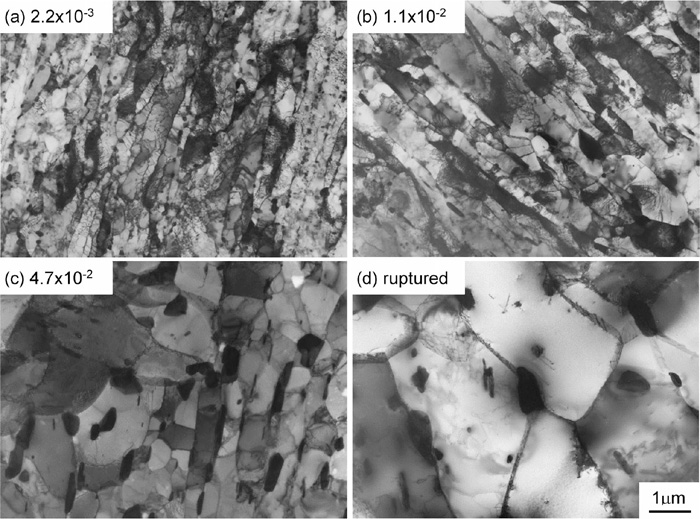
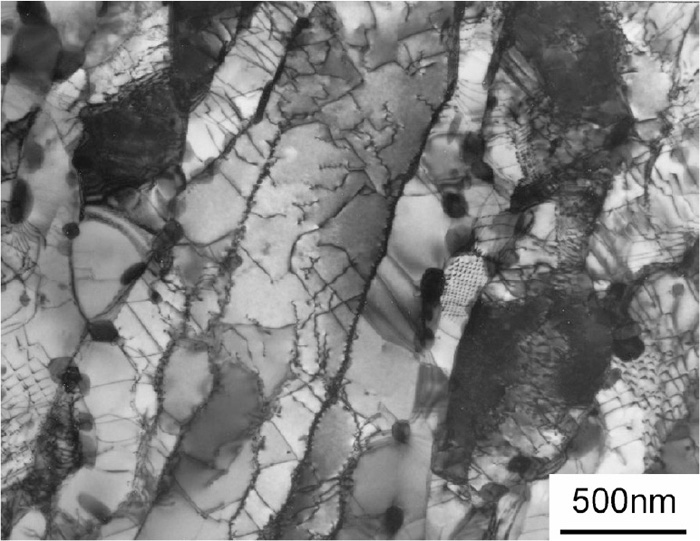
Figure 3 demonstrates the change in hardness of the gauge portions taken from the specimens creep-ruptured and creep-interrupted at various time under a temperature of 873 K and an applied stress of 60 MPa, together with the heat-treated sample. The hardness is around 220 after the tempering heat treatment and it decreases by only about 20 up to 1.0×10⁻², following which it diminishes drastically until rupture. The hardness is still at the higher levels in the early period of the primary creep stage, up to a creep strain of 5×10⁻³, in which the first minimal creep rate appears. This result implies that some microstructural variations have influences on the creep deformation behavior in the duration. Figure 4 displays the TEM images of specimens creep-interrupted at various periods under a stress condition of 60 MPa and a temperature of 873 K. Comparison in microstructure between Figs. 1(b) and 4 provides that the lath widths and carbides grow and the dislocation densities decrease gradually with an increase in creep deformation up to the strain of 4.7×10⁻² at which the creep rate reaches the second minimal value. In the fracture specimen, fine lath structure disappears and there are large carbides at the sites where the lath boundaries had existed as shown in Fig. 4(d). Figure 5 illustrates the enlarged TEM image of Fig. 4(a). Cellular network substructure with walls where dislocations integrate is found on the image. Such cellular substructure increases in area fraction with an increase in creep deformation and is maintained during the whole course of the primary creep stage as indicated in Figs. 4(a)–4(c). Coarsening of the substructure occurs significantly through acceleration creep, and carbides may have some influences on lath widths and cell sizes. Figure 6 shows the variations in the average values of lath widths (a) and carbide diameters (b) on the creep-interrupted and creep-ruptured specimens. The lath width is estimated to be about 280 nm after the heat treatments, and the sizes are almost unchanged up to about 1×10⁻². Coarsening of lath width happens dramatically after a strain of around 3×10⁻², which variation corresponds to significant increase in creep rate. Growth of carbides happens at the same time as the increases in lath widths and creep rate, hence coarsening of carbides leads to augmentation of lath widths, cell sizes and creep rates. Sawada et al.11) have mentioned on 9Cr-1Mo steel that the remarkable growth of subgrain structure and abrupt increase in creep deformation occur simultaneously, which is similar to change in microstructure observed in this study. It has been also reported that Ostwald growth of carbides causes an acceleration of creep deformation in 12%Cr-0.12%C steel, whereas the microstructure is martensite without tempering heat treatment.15) In addition, many papers have described that precipitates including carbides along lath boundaries restrain the movement of dislocations and it contributes to creep resistance.5,6,7,8,15,17,18,19) It is also recognized in this study that carbides act a key role as obstacles against coarsening of cellular dislocation network substructure.

Complicated creep deformation behavior appears on the creep rate curves as shown in Fig. 2. Temporary strong stress against creep deformation also seems to occur in the course of primary creep. We will next discuss reasons why creep rates fluctuate at lower applied stress levels through evaluations of strength and microstructure in the beginning of the creep deformation. Figure 7 illustrates the changes in tensile and proof stresses of the specimens heat-treated and pre-strained at various strain under a temperature of 873 K and an applied stress of 60 MPa. Tensile strength decreases monotonously with an increase in pre-strain, which corresponds to the reduction in hardness as shown in Fig. 3(b). On the other hand, 0.2 percent and 0.02 percent offset proof stresses rise slightly at a strain of 2.2×10⁻³, following which decrease with increasing pre-strain. Figure 8 is a comparison in nominal stress - nominal strain curves between the samples subjected to the heat treatments and a creep pre-strain of 2.2×10⁻³. The stress of the pre-strained specimen is higher than that of the as tempered sample in the strain region ranging from 1×10⁻³ to 3×10⁻³. This difference in the strain hardening rates leads to the temporary rise in yield stress and is presumed to be due to microstructural change under creep deformation.
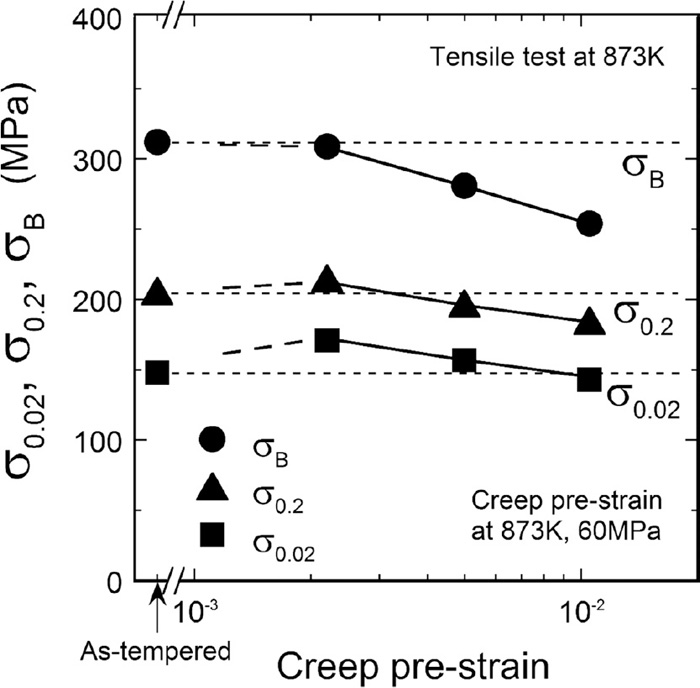

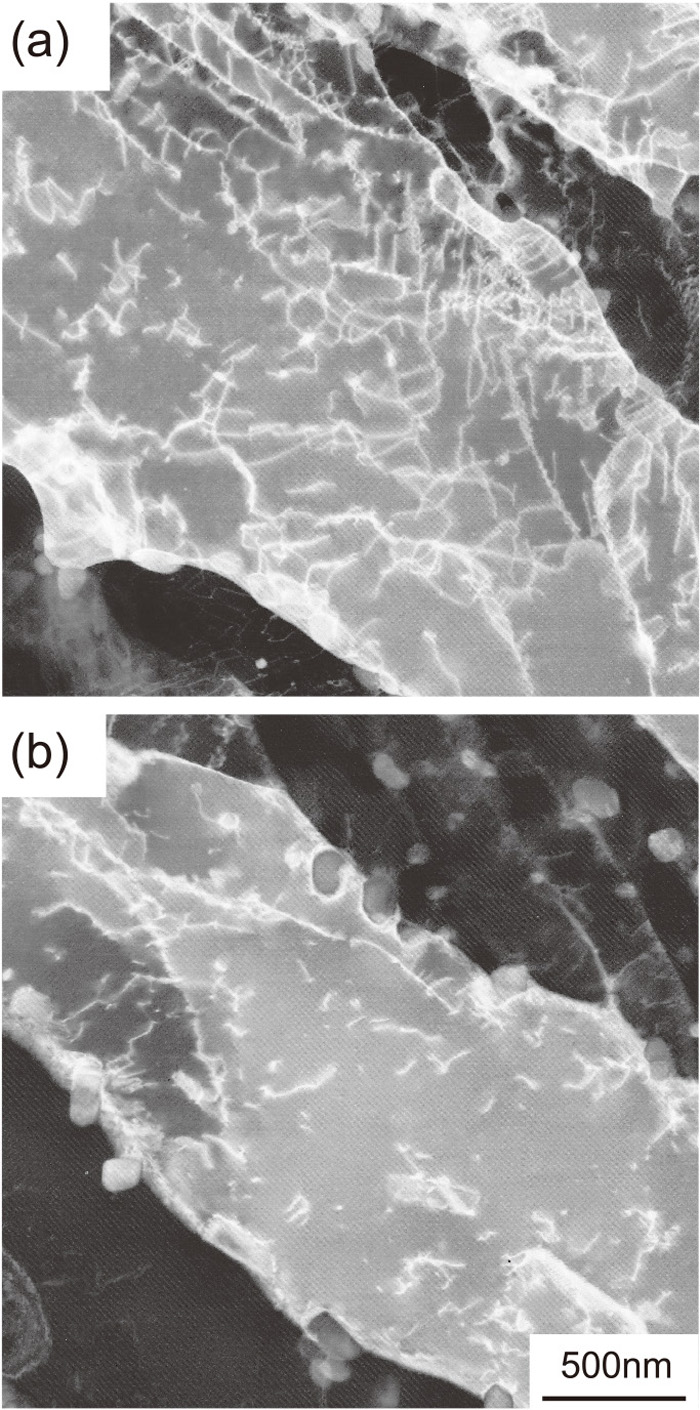
Figure 9 shows STEM dark field images of the specimens heat-treated and pre-strained by 2.2×10⁻³. Dislocations denoted as lines in white are distributed in the vicinity of lath boundaries and inside the laths on the as tempered specimen. The density of intralath dislocations on the pre-strained specimen is lower than that on the sample heat-treated, and those dislocations seem to disappear through dislocation reaction. Figure 10 demonstrates the change in dislocation densities of the specimens during creep exposure by means of XRD method. While dislocation density gradually decreases with an increase in strain, the density at a strain of 2.2×10⁻³ is almost the same level as that after the heat treatments, which behavior suggests that large reduction in the dislocation density does not occur under creep deformation up to around 2×10⁻³. Figure 11 displays STEM dark field images around the lath microstructure of the specimen creep-interrupted at 2.2×10⁻³ (a) and 5.0×10⁻³ (b). Although some dislocations still remain inside the laths, most of them seem to integrate into the lath or cell boundaries densely as indicated by arrows in Fig. 11(a). Here, we will estimate strain produced through intralath dislocation movement under creep deformation. The movement of dislocations induces plastic strain ε and there is a relationship between them as following equation:
where
x
¯
is an average distance of dislocation displacement. Putting
x
¯
=140 nm, a half of average lath width and
ρ=2.0×10
14 m
−2 measured on as tempered sample with TEM observation method in
Eq. (1), we can obtain
ε=3.5×10
−3. Considering the strain of the specimen shown in
Fig. 11(a) is 2.2×10
−3, above estimation implies that most intralath dislocations accumulate into lath and cell boundaries without disappearance through dislocation reaction in the early period after loading. Some dislocations around those boundaries, however, disappear through dislocation reaction during further progression on creep deformation as presented in
Fig. 11(b).
Cellular dislocation network substructure having highly dense dislocations wall formed in lower creep strain process is presumed to raise the strain hardening rate mentioned above. The Bailey-Hirsch relationship is expressed in the following equation:
where
α is a constant,
μ shear modulus, b length of Burgers vector and
ρ dislocation density. Suppose the values of
μ and b are unchanged under a small range of creep deformation, the equation provides that the proof stress after the heat treatments must be almost the same level as or slightly higher than that after the 2.2×10
−3 pre-strain, which estimation contradicts above tensile test results apparently. It is impossible to describe the difference with the relationship between strength and dislocations alone. In the case of 18%Ni martensitic steel, it have reported that 0.2% proof stress of the samples subjected to slight pre-straining is higher than that of the as-quenched specimen and this phenomenon is due to a microstructural change from randomly distributed intralath dislocations introduced through martensitic transformation to cellular tangled dislocations.
34,35) While there is a large difference in the dislocation cell sizes between the present steel formed under creep deformation and 18%Ni steel under pre-strain, both cases have similar features in cellular dislocation substructure and increasing the flow stress. We can therefore conclude that dislocations together with carbides existing around lath boundaries construct the cellular dislocation network substructure through creep deformation process, which microstructural variation causes the difference in the work hardening rate between the specimens with and without pre-strain. Such cell structure also produces internal stress against creep deformation. It is generally recognized in some non-ferrous alloys that the dislocations are homogeneously distributed just after creep loading, they re-arrange to produce a cell or subgrain structure in the course of primary creep, and such substructure leads to long range internal stresses.
36) In pure alpha iron, the formation of subgrain structure occurs in the course of primary creep and not only the total dislocation density but also the dislocation density at subgrain boundaries increase during creep despite a reduction in the density inside the subgrain.
37) The most dislocations generated by creep deformation are spent in the formation of sub-boundaries. In the case of present steel, dislocation cell structure also generates internal stress although dislocation cell structure intralath dislocations are piled up into the lath and cell boundaries in the early period of transient creep without a rise in total dislocation density. The cellular dislocation network substructure observed in this study also produces internal back stresses against deformation in the whole course of transient creep region.
Figure 12 illustrates the relationship between creep deformation behavior and microstructural evolution at the lower stress levels in this study. Dislocations remain densely and most carbides precipitate around lath boundaries after tempering heat treatments (Fig. 12(a)). The intralath dislocations move toward lath boundaries, tangle up carbides and form cellular dislocation network substructure after loading, which process produces internal back stress against creep deformation (Fig. 12(b)). That stress is not so large that complicated variation in the creep rates appears at the higher applied stress conditions. It is presumed that accumulation of dislocations into cell walls or lath boundaries lowers the material strength because of stress concentration around those boundaries and such phenomenon causes temporary increasing the creep rates. After that, some dislocations around those boundaries disappear through dislocation reaction and the others are rearranged (Fig. 12(c)). While those dislocation densities decrease, the boundaries are more stable since the stored energy is assumed to be low and carbides along the lath boundaries also constrain the dislocations from moving. Such microstructure provides higher internal stress and the creep rates decreases again (Fig. 12(d)). Carbides restrain the dislocations from moving effectively, and cellular network substructure is stably maintained. Coarsening and condensation of the precipitates, however, promote the movement of subgrain boundaries and leads to the augmentation of subgrain. This microstructure change causes transition to acceleration creep stage, and thereby increasing the creep rate in the end (Fig. 12(e)). The dislocations remaining after the tempering heat treatment move toward lath boundaries and form cellular dislocation network substructure in the early period after loading, which structure produces internal back stress in the whole course of the transient creep stage. Dislocations act a key role for strengthening against creep deformation by means of carbides. Such strengthening mechanism can be said to be one of dislocation hardening.

4. Conclusion
Dislocation substructure evolution under creep deformation was investigated by using a simple 0.2%C-9%Cr steel to reveal effects of dislocation substructure on creep deformation behavior and creep strength. Results obtained are as follows:
(1) Whereas the creep curves consist of simple primary and tertiary creep stages on the samples tested at higher stress condition, the curves at the lower stresses display complicated variation in the creep rate under a temperature of 873 K.
(2) Formation of cellular dislocation network substructure occurs in the early periods of the primary creep stage and the substructure is relatively stable until the onset of acceleration creep. Carbides existing along the lath boundaries contribute to stabilization of that network structure effectively, but condensation and coarsening of the particles causes the degradation of that structure.
(3) The dislocations remaining after the tempering heat treatment move toward lath boundaries, tangle up carbides and form cellular network substructure in the early period after loading, which process produces internal back stress against creep deformation and increase in the work hardening rate and yield stress in tensile test at 873 K. The complicated variation in creep rate at the lower stress conditions is due to integration and partial disappearance of dislocations around cell walls and lath boundaries. It can be concluded from above results that dislocations act a key role for strengthening against creep deformation by means of carbides.
Acknowledgement
The author would like to thank Professor Setsuo Takaki of the Kyushu University for his helpful discussion.
References
- 1) F. Masuyama: ISIJ Int., 41 (2001), 612.
- 2) K. H. Mayer and F. Masuyama: Creep-resistant Steels, eds. by F. Abe, T.-U. Kern and R. Viswanathan, Woodhead Publishing Ltd. Cambridge, England, (2008), 15.
- 3) K. Kimura, H. Kushima and K. Sawada: Proc. 6th Int. Chales Parsons Turbine Conf., Maney Publishing, London, (2003), 443.
- 4) F. Abe: Creep-resistant Steels, eds. by F. Abe, T.-U. Kern and R. Viswanathan, Woodhead Publishing Ltd. Cambridge, England, (2008), 279.
- 5) R. P. Chen, H. Ghassemi Armaki, K. Yoshimi, K. Maruyama, Y. Minami and M. Igarashi: Tetsu-to-Hagané, 96 (2010), 564.
- 6) H. Ghassemi Armaki, R.-P. Chen, K. Maruyama and M. Igarashi: Metall. Mater. Trans. A, 42A (2011), 3084.
- 7) K. Sawada, M. Takeda, K. Maruyama, R. Ishii, M. Yamada, Y. Nagae and R. Komine: Mater. Sci. Eng., A267 (1999), 19.
- 8) T. Endo, F. Masuyama and K.-S. Park: Tetsu-to-Hagané, 88 (2002), 526.
- 9) K. Sawada, K. Maruyama, Y. Hasegawa and T. Muraki: Key Eng. Mater., 171–174 (2000), 109.
- 10) Y. Kadoya and E. Shimizu: Tetsu-to-Hagané, 86 (2000), 189.
- 11) K. Sawada, H. Kushima, M. Tabuchi and K. Kimura: Mater. Sci. Eng. A, A 528 (2011), 5511.
- 12) K. Sawada, K. Kubo and F. Abe: Mater. Sci. Technol., 19 (2003), 732.
- 13) H. Nakashima: Tetsu-to-Hagané, 90 (2004), 73.
- 14) F. Abe, S. Nakazawa, H. Araki and T. Noda: Metal. Trans. A, 23A (1992), 469.
- 15) K. Iwanaga, T. Tsuchiyama and S. Takaki: Tetsu-to-Hagané, 84 (1998), 896.
- 16) K. Sawada, K. Maruyama, R. Komine and Y. Nagae: Tetsu-to-Hagané, 83 (1997), 466.
- 17) A. Orlova, J. Buršík, K. Kuchařová and V. Sklenička: Mater. Sci. Eng. A, A245 (1998), 39.
- 18) G. Eggeler, N. Nilsvang and B. Ilschner: Steel Res., 58 (1987), 97.
- 19) G. Eggeler: Acta Metall., 37 (1989), 3225.
- 20) W. Blum and G. Götz: Steel Res., 70 (1999), 274.
- 21) R. Vanstone: Materials for Advanced Power Engineering 1998, eds. by J. Lecomte-Beckers, F. Schubert and P. J. Ennis, Forschungszentrum Jülich, Jülich, Germany, (1998), 139.
- 22) F. Abe: Metall. Mater. Trans. A, 34A (2003), 913.
- 23) A. Iseda, H. Teranishi and F. Masuyama: Tetsu-to-Hagané, 76 (1990), 1076.
- 24) T. Ungár, I. Dragomir-Cernatescu, D. Louër and N. Audebrand: J Phys. Chem. Solids, 62 (2001), 1935.
- 25) R. L. Klueh: Mater. Sci. Eng., 35 (1978), 239.
- 26) R. L. Klueh: Metall. Trans. A, 9A (1978), 1591.
- 27) M. Sakamoto, K. Yagi, H. Morishita, K. Kubo, Y. Monma and C. Tanaka: J. Soc. Mater. Sci. Jpn., 39 (1990), 674.
- 28) H. Kushima, K. Kimura, F. Abe, K. Yagi, H. Irie and K. Maruyama: Tetsu-to-Hagané, 85 (1999), 848.
- 29) K. Kimura, H. Kushima, K. Yagi and C. Tanaka: Tetsu-to-Hagané, 77 (1991), 667.
- 30) K. Kimura, H. Kushima, F. Abe and K. Yagi: Tetsu-to-Hagané, 82 (1996), 713.
- 31) H. Kushima, K. Kimura, F. Abe, K. Yagi, H. Irie and K. Maruyama: Tetsu-to-Hagané, 86 (2000), 131.
- 32) NIMS Creep Data Sheet, Atlas of Creep Deformation Property, No. D-1, NIMS, Tsukuba, (2007).
- 33) NIMS Creep Data Sheet, Atlas of Creep Deformation Property, No. D-2, NIMS, Tsukuba, (2008).
- 34) K. Nakashima, Y. Fujimura, H. Matsubayashi, T. Tsuchiyama and S. Takaki: Tetsu-to-Hagané, 93 (2007), 459.
- 35) S. Takaki, K-L. Ngo-Huynh, N. Nakada and T. Tsuchiyama: ISIJ Int., 52 (2012), 710.
- 36) W. D. Nix and B. Ilschner: ICSMA 5, 1979, Strength of Metals and Alloys, ed. by P. Haasen, V. Gerold and G. Kostorz, Pergamon Press, Oxford, (1980), 1503.
- 37) A. Orlová and J. Čadek: Philos. Mag., 28 (1973), 891.