Abstract
To understand the growth mechanism of metallic iron phase an oolitic iron ore was reduced isothermally by coal under various experimental conditions to examine the metallization process. The microstructural characteristics of metallic iron were investigated using scanning electron microscope (SEM) and energy dispersive spectrometer (EDS). The grain size of metallic iron was measured by image analysis and the growth kinetics was analyzed based on the classical phenomenological kinetic theory. Experimental results showed that the metallization degree firstly increased and then gradually plateaued as reduction progressed. Metallic iron phase existed in the form of sphere-like grains inlaying in the slag phase. Reduction time and temperature had significant influence on the growth of metallic iron grain. The grain size of metallic iron increased with an increase in reduction time and temperature. The growth process of metallic iron grain was characterized by two stages with an inflection point at 30 min. The grain growth exponent and activation energy at the corresponding stage were determined, and the growth kinetics model was proposed to describe the metallic iron grain growth during coal-based reduction of oolitic iron ore. The metallic iron grain growth was controlled by chemical reaction of iron oxide minerals reduced to metallic iron at reduction time ≤30 min, and combined surface diffusion and metallic iron diffusion in the slag at reduction time >30 min.
1. Introduction
As the premium grade iron deposits are being gradually exhausted by the iron and steel industry,1,2) it is imperative to tap into some previously less desirable mineral resources. The oolitic iron ore is such a low grade mineral deposit with a huge reserve, and the ultrafine iron minerals are intimately disseminated in the gangue minerals forming a special concentric and layered oolitic texture.3,4) In addition, the phosphorus content of oolitic iron ore is usually high (0.4%–1.8%). Therefore, conventional mineral beneficiation processes are less effective in producing the concentrate from oolitic iron ores suitable for ironmaking. To address this challenge, coal-based reduction followed by magnetic separation has been recently proposed to recover iron directly from oolitic iron ore, where the iron minerals in the ore are directly reduced to metallic iron phase, which are subsequently liberated by grinding and separated from the slag by magnetic separation.
Several research efforts have been made in coal-based reduction, demonstrating that it is a feasible method to make use of oolitic iron ore as a mineral resource for ironmaking. The effects of reduction temperature, reduction time, particle size, coal type and additives on the iron metallization, iron recovery and dephosphorization have been investigated in detail.5,6,7,8,9) Under the optimum conditions, the metallic iron concentrate (>90% Fe, <0.1% P) can be obtained with an iron recovery >90%.5,7,8,9) It is to note that P is a detrimental impurity, and P can be enriched in the metal iron during the reduction. To understand the mechanisms of dephosphorization, the distribution behavior of phosphorus in the reduction process has been studied by Rao et al.,10) Cha et al.11) and Li et al.12) The kinetics and mechanisms of coal-based reduction of oolitic iron ore also have been well investigated.13,14,15) In our previous research, it was found that the reduced metallic iron existed in the form of spherical or ellipsoidal particles in the slag and larger particle sizes facilitated magnetic separation.16) A method was developed to measure the size of the metallic iron grains in coal-based reduced materials,17) and the growth and size distribution behavior of metallic iron was examined.18,19) However, the formation and growth mechanisms of the metallic iron have not yet been clearly elucidated.
This study was to gain a better understanding of the growth mechanisms of the metallic iron phase during coal-based reduction by examining their metallization process, microstructure and growth behavior using an oolitic iron ore as raw material. The growth kinetics of the metallic iron was evaluated based on the kinetic equation of grain growth.
2. Experimental
2.1. Materials
Representative oolitic iron ore sample was taken from Guandian, Hubei, China, and used for this study. Its chemical composition is presented in Table 1. The total Fe content of the oolitic iron ore is 42.21%, and other constituents include 21.80% SiO2, 5.47% Al2O3, 4.33% CaO and 1.31% P. The mineralogical analysis result is shown in Fig. 1, indicating that the iron ore is mainly consisted of hematite, quartz, chamosite, and apatite. A coal sample obtained from Jilin Province in China was used as the reductant. The results of its proximate analysis, ultimate analysis and chemical composition of ash are shown in Table 2. The coal contains 67.83% fixed carbon, 18.45% volatiles, 12.14% ash, and 1.58% moisture. From the ultimate analysis (dry ash free), the C and H contents of coal are 90.31% and 4.49%, respectively. The ash of the coal is mainly composed of 43.27% SiO2 followed by 33.42% Al2O3, 9.42% CaO, 5.16% Fe2O3 and 3.71% MgO. Both the oolitic iron ore and coal samples were crushed to 100% passing 2 mm.
Table 1. Main chemical compositions of the oolitic iron ore (wt%).
| TFe | FeO | SiO2 | Al2O3 | CaO | MgO | P | S | TiO2 | K | Mn |
|---|
| 42.21 | 4.31 | 21.80 | 5.47 | 4.33 | 0.59 | 1.31 | 0.03 | 0.19 | 0.41 | 0.20 |
Table 2. Analysis results of the coal used for oolitic iron ore reduction.
| Proximate analysis (wt%) | Ultimate analysis (daf, wt%) | Chemical composition of ash (wt%) |
|---|
| FC | Volatiles | Ash | Moisture | C | H | N | S | O | SiO2 | Al2O3 | Fe2O3 | CaO | MgO |
| 67.83 | 18.45 | 12.14 | 1.58 | 90.31 | 4.49 | 1.38 | 0.32 | 3.50 | 43.27 | 33.42 | 5.16 | 9.42 | 3.71 |
The reduction experiment was performed in a muffle resistance furnace. The iron ore and coal (mass ratio of 72:28) were thoroughly mixed to achieve a C/O molar ratio of 2.0 to ensure the reduction reaction. Then, 50 g of the mixture was put into an alumina crucible (60 mm in inner diameter and 58 mm in height), and the height of the mixed sample bed was 41 mm. When the furnace was preheated to the designated experimental temperature, the prepared crucible was placed into the furnace at the uniform temperature zone and directly below the thermocouple, and maintained at that temperature for the predetermined time. After that, the reduced sample was taken out and cooled to room temperature in water. The wet sample was subsequently filtrated and dried at 353 K in a vacuum oven. During the preheating and reduction process, N2 flow was maintained at a rate of 30 mL·min−1 as the protective gas in the furnace.
The reduced sample was divided into two portions. One portion was milled to 100% passing 0.074 mm for chemical analysis, and the other portion was used for microstructure and particle size analyses of the metallic iron phase. The metallization degree was calculated using the following equation:
where
η is the metallization degree (%),
wMFe is the metallic iron content in reduced sample (%),
wTFe is the total iron content in reduced sample (%).
To investigate the microstructure and growth characteristics of the metallic iron, the reduced samples, before and after polishing, were observed using scanning electron microscope (SEM) equipped with an energy diffraction spectrum (EDS).
The grain size of the metallic iron in reduced sample was measured using optical image analysis, which was described in details in our previous work.17,19) Briefly, the reduced samples were first embedded in a Bakelite block and polished to expose the metallic iron phase. Second, the polished samples were photographed using an Olympus BX41M metallographic microscope. Finally, after image analysis by Motic Images Advanced 3.2 software, the apparent size of each metallic iron phase was acquired. The sectioning effect on size of sphere has been adequately studied by Chayes,20) and the relation between the apparent size and real size was incorporated to correct the bias. In reduced sample, the metallic iron existed as sphere-like particles. Thus, the real size of each metallic iron grain can be calculated by the following equation:
where
d is the real size of each metallic iron gain (
μm), and
L is the apparent size measured by image analysis software (
μm).
The sizes of the reduced metallic iron phase measured by image analysis are not uniform. In order to understand the growth of metallic iron, the mean grain size was used to represent the size of the metallic iron phase under different experimental conditions, which was calculated by the following equation:
where
d is the mean grain size of the metallic iron,
N is the total number of metallic iron grains (dimensionless), and
di is the size of each metallic iron phase (
μm).
3. Results and Discussion
3.1. Metallization Process
Reduction of iron oxides in the oolitic ore to elemental iron is the prerequisite for the origination and growth of the metallic iron phase. The metallization degree of the oolitic iron ore at various experimental conditions is shown in Fig. 2. It was observed that the curves of metallization degree demonstrated a similar trend with respect to reduction time at all reduction temperatures. Based on the shape of the curves, the metallization process of oolitic iron ore in coal-based reduction could be characterized by two stages: an increasing stage (Stage I) followed by a stable stage (Stage II) with an inflection point at 30 min. At the increasing stage (time≤30 min), the metallization degree increased rapidly with reduction time, while it gradually plateaued at the stable stage (time>30 min).
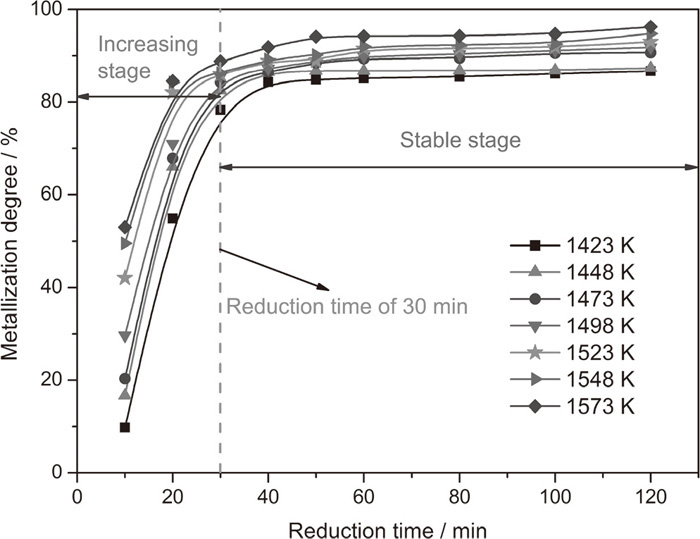
It also can be found that reduction temperature has obvious influence on the metallization degree (Fig. 2). At the same reduction time, the metallization degree increased with increasing reduction temperature, but the increase was more pronounced at the increasing stage. For instance, when the reduction temperature increased from 1423 K to 1573 K, the metallization degree at 20 min increased from 54.92% to 84.56%, as opposed to from 84.31% to 91.84% at 40 min (i.e., the stable stage). Moreover, the metallization degree at the end of all experiments was less than 100%, indicating the great difficulty in achieving a complete reduction of the iron oxides into metallic iron.
The mineral species being reduced were iron oxides at the early stage and iron complex compounds (Fe2SiO4, FeAl2O4) at a later stage.14) The iron complex compounds once formed were much more difficult to be reduced to metallic iron than iron oxides.11,21,22,23) Increasing reduction temperature can enhance the reduction of iron oxides and iron complex compounds. Thus, the metallization degree rapidly climbed with the increasing reduction time and temperature at the increasing stage, and gradually levelled off at the stable stage.
3.2. Microstructure Characterization
To take a closer look at the microstructure characteristics of metallic iron, the reduced oolitic iron ore at different reduction time and temperatures was observed by SEM-EDS as shown in Figs. 3 and 4. It was apparent that sphere-like grains existed in the reduced samples. From the EDS spectra, the composition of sphere-like grain was Fe, indicating it was the metallic iron phase. The other part of the reduced ore was composed by Ca, Fe, Si, Al and O, indicating it was the slag phase. These observations indicted that the reduced metallic iron grew into sphere-like grain and inlaid in the slag phase.

It was also found that the reduction time and temperature have significant influence on the growth of metallic iron grain. The number of metallic grain in large size increased with the increasing reduction time and temperature, indicating the size of metallic iron grain increased progressively. This is because the reduction time and temperature can stimulate the growth of metallic iron phase. With an increasing reduction time, more iron minerals were reduced to metallic iron (Fig. 2), and it provided more time for the growth of metallic iron grain. Increasing reduction temperature could accelerate the reduction of iron minerals and enhance the diffusion rate of metallic iron, benefit the growth of the iron grains.
3.3. Growth Behavior
To quantitatively describe and analyze the growth of metallic iron phase, the size of metallic iron grain at various temperatures for different time was measured using optical image analysis, and the mean sizes of metallic iron grain calculated by Eqs. (2) and (3), are presented in Fig. 5. It was observed that reduction time and temperature had a significant effect on the grain size of metallic iron. The grain size clearly increased as the reduction time and temperature increased. When the oolitic iron ore was reduced at 1573 K for 10 min to 120 min, the grain size of the metallic iron increased dramatically from 15.65 μm to 25.45 μm. As the reduction temperature increased from 1423 K to 1573 K, the grain size of metallic iron at a reduction time of 20 min increased moderately from 11.81 μm to 16.55 μm. Moreover, the degree of metallic grain size increase at the reduction time of <30 min was less than that at the reduction time of >30 min. For instance, at a reduction temperature of 1423 K, the grain size of metallic iron increased slightly from 11.51 μm to 12.11 μm with the reduction time increasing from 10 min to 30 min, while the grain size increased from 12.77 μm to 13.78 μm with the reduction time increasing from 40 min to 60 min (the same time interval). Therefore, the size growth rate of metallic iron grain varied in the reduction process, and the size growth rate at the increasing stage of the reduction was slower than that at the stable stage.

Growth kinetics of the metallic iron grain can help understand the growth mechanisms of grain. Although there are many studies on the grain growth kinetics, the classical phenomenological kinetic equation is widely used.24,25)
|
D
t
n
-
D
0
n
=
K
0
texp(
-
Q
RT
)
| (4) |
where,
Dt is the grain size at time
t (
μm),
D0 is the initial grain size at time
t=0 (
μm),
n is the kinetic grain growth exponent (dimensionless),
K0 is the pre-exponential constant (dimensionless),
Q is the activation energy for grain growth (kJ·mol
−1),
R is the gas constant (J/(mol·K)), and
T is the absolute temperature (K). This equation was previously used to describe the grain growth of alloys, ceramics and metals.
26,27,28,29,30,31) Given the similar situation, the grain growth of metallic iron phase in coal-based reduction of oolitic iron ore was analysed using
Eq. (4).
At the beginning of the reduction experiments, there was no metallic iron phase existing in the oolitic ore. Therefore, Eq. (4) can be rewritten as:
|
D
t
=
[
K
0
t⋅exp(
-Q
RT
)
]
1/n
| (5) |
By taking the natural log of both sides,
Eq. (5) can be expressed as:
|
ln(
D
t
)
=
1
n
ln(
K
0
)
+
1
n
ln(
t
)
-
1
n
Q
RT
| (6) |
Obviously, the values of
n and
Q can be determined from the slopes of linear regression of ln(
Dt) versus ln(
t) and 1/
T, respectively. Based on the obtained
n and
Q, the value of
K0 can be calculated, and the growth kinetics equation can be established.
The plots of ln(Dt) versus ln(t) are presented in Fig. 6. Evidently, the linearity between ln(Dt) and ln(t) was poor in the whole reduction time range, and thus the data should be analysed piecewise. According to the varying pattern of ln(Dt) versus ln(t), the plots were divided into Stage I (≤30 min) and Stage II (>30 min), which corresponded well with the two stages in Section 3.1. The linear regression analysis for each stage indicated that ln(Dt) versus ln(t) presented good linearity. From the corresponding slopes, the grain growth exponent n was calculated and presented in Table 3. Evidently, the n values at Stage I were much higher than Stage II. The average n value was 14.95 at Stage I and 4.08 at Stage II. The different n values hinted different growth mechanisms of metallic iron grain, which would be discussed in details in Section 3.5.

Table 3. Values of
n,
Q and ln(
K0) for metallic iron growth at different experimental conditions.
| Conditions | 1423 K | 1448 K | 1473 K | 1498 K | 1523 K | 1548 K | 1573 K | Average |
|---|
| ≤30 min | n | 19.25 | 18.43 | 12.67 | 15.41 | 14.06 | 12.53 | 12.30 | 14.95 |
| Q(kJ/mol) | 813.03 | 778.39 | 535.12 | 650.84 | 593.83 | 529.21 | 519.49 | 631.41 |
| ln(K0) | 88.32 | 88.04 | 86.59 | 87.38 | 87.13 | 86.76 | 86.60 | 87.26 |
| >30 min | n | 4.58 | 4.08 | 3.94 | 4.07 | 4.17 | 4.17 | 3.59 | 4.08 |
| Q(kJ/mol) | 206.38 | 183.85 | 177.54 | 183.40 | 187.91 | 187.91 | 161.77 | 184.11 |
| ln(K0) | 22.71 | 22.20 | 22.10 | 22.16 | 22.24 | 22.22 | 21.69 | 22.19 |
The dependence of ln(Dt) on 1/T is shown in Fig. 7. It was apparent that there was good linearity between ln(Dt) and 1/T. The activation energy Q is different from one other because the n values are diverse, and it can be calculated based on the following equation:
Where
S is the slope of ln(
Dt) versus ln(
t). Using the average values of slope at Stage I and II, the calculated activation energy
Q values are listed in
Table 3. It was observed that the
Q value at Stage I of the reduction was higher than that at Stage II. The formation and growth of metallic iron phase could be considered as a crystal nucleation and growth process. From crystal growth theory, the oversaturation concentration of solute is regarded as main driving force for grain growth.
32) As shown in
Fig. 2, the metallic iron content at Stage I was obviously less than that at Stage II, which would resulted in the greater grain growth driving force at Stage II. Meanwhile, the SEM micrographs of polished cross sections of reduced samples (
Fig. 8) also provide some useful information. At Stage I, metallic iron was formed and grew in the mixed phases of iron oxides and chamosite, and micropores were also observed around the metallic iron phase (
Fig. 8(a)). While at Stage II, the growth surroundings of metallic iron was change to uniform continuous slag phase of Fe–Si–Al–Ca–O (
Fig. 8(b)). Obviously, the iron diffusion in porous heterogeneous phase of minerals was more difficult than in homogeneous slag phase. Therefore, the growth of metallic iron was easier at Stage II, and the activation energy
Q was lower.
Using the estimated n, Q and intercept of ln(Dt) versus ln(t), the calculated values of ln(K0) at different reduction temperatures are presented in Table 3. The ln(K0) at the corresponding stages was relatively stable with an average value of 87.26 at Stage I and 22.19 at Stage II. From Table 3, even at the same stage, the calculated n, Q and ln(K0) varied at different reduction temperatures. However, these variations were within a controlled range. To predict the size growth of metallic iron grain, effort was made to develop a kinetic model to describe the metallic iron growth under different reduction temperatures using the average values of n, Q and ln(K0). The model can be expressed as follows:
|
At t≤30 min
D
t
=
[
7.88×
10
37
t⋅exp(
-
631.41×
10
3
RT
)
]
1/14.95
| (8) |
|
At t>30 min
D
t
=
[
4.34×
10
9
t⋅exp(
-
184.11×
10
3
RT
)
]
1/4.08
| (9) |
The comparison of estimated values calculated using Eqs. (8) and (9) with measurement data is shown in Fig. 9. It was observed that the estimated values uniformly distributed on the both sizes of equality line y=x, and presented good linearity, indicating good agreements between estimated values and measurement data. Therefore, the proposed growth kinetics model could be used to describe the growth of metallic iron grain during coal-based reduction of the oolitic iron ore.
3.5. Growth Controlling Mechanism Analysis
In general, the value of grain growth exponent n characterizes the mass transfer and controlling mechanisms for the grain growth.27,28,29,33) Based on the classical phenomenological kinetic theory, n=2 represents grain growth controlled by grain boundary diffusion, n=3 by volume diffusion or vapor transport, and n=4 by surface diffusion.28,29) As shown in Table 3, the obtained n values were mostly decimals, indicating that the growth of metallic iron in coal-based reduction of oolitic iron ore was more complex, which might involve more than one controlling mechanisms.
The n values of metallic iron grain during coal-based reduction at reduction time ≤30 min ranged from 12.30 to 19.25 (much more than 4), indicating the growth of metallic iron grain was not controlled by diffusion. From the metallization process of oolitic iron ore (Fig. 2), reduction time ≤30 min was the stage that the metallic iron was gradually produced from iron oxide minerals. In addition, iron oxides phase was clearly visible at Stage I (Fig. 8(a)). Thus, it was deduced that the metallic grain growth was mainly controlled by the chemical reaction of iron oxides reduced to metallic iron at this stage.
The calculated n values at reduction time >30 min varied around 4 (from 3.76 to 4.40), indicating the grain size growth was controlled by surface diffusion. As shown in the enlarged SEM image of metallic iron grain (Fig. 10), very fine protuberance was observed in the surface of metallic iron grain. In the meantime, the iron oxide minerals were almost completely reduced to metallic iron at Stage II, and only metallic iron and Fe–Si–Al–Ca–O slag phases were detected in the reduced sample (Fig. 8(b)). These phenomena indicated that the reduced metallic iron transferred from the slag phase to the surface of metallic grain, and then integrated into large grain. Therefore, it was concluded that the growth controlling mechanism of metallic iron grain at Stage II was combined surface diffusion and metallic iron diffusion in slag.
4. Conclusions
The microstructure characteristics and size growth kinetics of metallic iron grain in the reduction of oolitic iron ore using coal as a reductant were investigated, the growth controlling mechanism was discussed, and the following conclusions can be drawn:
(1) In all experimental conditions, the variations in metallization degree as a function of time exhibited a similar trend with a significant increase at reduction time ≤30 min, and gradual increase afterwards. The metallization process of oolitic iron ore could be characterized by two stages, namely, an increasing stage (Stage I) and a stable stage (Stage II).
(2) The metallic iron phase existed in the form of sphere-like grains, which inlaid in the slag phase. Both reduction time and temperature showed a pronounced effect on the size growth of metallic iron grain. As reduction time and temperature increased, the grain size of metallic iron increased significantly.
(3) The growth process of metallic iron grain could be characterized by Stage I and Stage II. At Stage I, the kinetic grain growth exponent n and activation energy Q were 14.95 and 631.41 kJ·mol−1, respectively. At Stage II, the calculated n and Q values were 4.08 and 184.11 kJ·mol−1, respectively. The growth kinetics models of metallic iron grain were described as
D
t
=
[
7.88×
10
37
t⋅exp(
-
631.41×
10
3
RT
)
]
1/14.95
(t≤30 min)
D
t
=
[
4.34×
10
9
t⋅exp(
-
184.11×
10
3
RT
)
]
1/4.08
and (t>30 min).
(4) The varying value of n at different stages indicated that the growth of metallic iron grain was complex, and the growth controlling mechanism changed during the reduction process. When the reduction time was ≤30 min, the metallic iron grain growth was mainly controlled by the chemical reaction of iron oxide minerals reduced to metallic iron. At reduction time >30 min, the combined surface diffusion and metallic iron diffusion in the slag was the growth controlling mechanism.
Acknowledgement
The authors gratefully acknowledge the financial support by National Natural Science Foundation of China (Grant No. 51134002 and No. 51604063) for this research effort.
References
- 1) L. Guo, J. T. Gao, Y. W. Zhong, H. Gao and Z. C. Guo: ISIJ Int., 55 (2015), 1806.
- 2) J. T. Gao, L. Guo and Z. C. Guo: Metall. Mater. Trans. B, 46 (2015), 2180.
- 3) H. Q. Tang, T. F. Qi and Y. Q. Qin: JOM, 67 (2015), 1956.
- 4) G. Li, S. Zhang, M. Rao, Y. Zhang and T. Jiang: Int. J. Miner. Process., 124 (2013), 26.
- 5) Y. S. Sun, Y. X. Han, P. Gao, Z. H. Wang and D. Z. Ren: Int. J. Miner. Metall. Mater., 20 (2013), 411.
- 6) H. Han, D. Duan, P. Yuan and S. Chen: Ironmaking Steelmaking, 42 (2015), 542.
- 7) W. Yu, T. C. Sun, J. Kou, Y. X. Wei, C. Y. Xu and Z. Z. Liu: ISIJ Int., 53 (2013), 427.
- 8) W. Yu, T. C. Sun, Z. Z. Liu, J. Kou and C. Y. Xu: ISIJ Int., 54 (2014), 56.
- 9) W. Yu, T. C. Sun, Q. Cui, C. Y. Xu and J. Kou: ISIJ Int., 55 (2015), 536.
- 10) M. J. Rao, C. Z. Ouyang, G. H. Li, S. H. Zhang, Y. B. Zhang and T. Jiang: Int. J. Miner. Process., 143 (2015), 72.
- 11) J. W. Cha, D. Y. Kim and S. M. Jung: Metall. Mater. Trans. B, 46 (2015), 2165.
- 12) G. H. Li, M. J. Rao, C. Z. Ouyang, S. H. Zhang, Z. W. Peng and T. Jiang: ISIJ Int., 55 (2015), 2304.
- 13) Y. S. Sun, Y. X. Han, X. C. Wei and P. Gao: J. Therm. Anal. Calorim., 123 (2016), 703.
- 14) Y. S. Sun, Y. X. Han, P. Gao, X. C. Wei and G. F. Li: Int. J. Miner. Process., 143 (2015), 87.
- 15) Y. S. Sun, Y. X. Han, P. Gao and G. F. Li: Ironmaking Steelmaking, 41 (2014), 763.
- 16) Y. S. Sun, P. Gao, Y. X. Han and D. Z. Ren: Ind. Eng. Chem. Res., 52 (2013), 2323.
- 17) Y. S. Sun, Y. X. Han, P. Gao and Y. F. Mu: Chem. Eng. Technol., 37 (2014), 2030.
- 18) Y. X. Han, Y. S. Sun, P. Gao, Y. J. Li and Y. F. Mu: Miner. Metall. Process., 31 (2014), 169.
- 19) Y. S. Sun, Y. X. Han, P. Gao and J. W. Yu: Miner. Process. Extr. Metall. Rev., 36 (2015), 249.
- 20) F. Chayes: J. Geol., 58 (1950), 156.
- 21) H. Park and V. Sahajwalla: ISIJ Int., 54 (2014), 49.
- 22) D. Q. Zhu, T. J. Chun, J. Pan and J. L. Zhang: Int. J. Miner. Process., 125 (2013), 51.
- 23) O. Kubaschewski: Metallurgical Thermochemistry, Pergamon Press, Oxford, (1979), 24.
- 24) F. A. Nichols: J. Appl. Phys., 37 (1966), 4599.
- 25) G. S. Li, L. P. Li, J. Boerio-Goates and B. F. Woodfield: J. Am. Chem. Soc., 127 (2005), 8659.
- 26) G. W. Yang, X. J. Sun, Q. L. Yong, Z. D. Li and X. X. Li: J. Iron Steel Res. Int., 21 (2014), 757.
- 27) A. J. Song, M. Z. Ma, R. Z. Zhou, L. Wang, W. G. Zhang, C. L. Tan and R. P. Liu: Mater. Sci. Eng. A-Struct., 538 (2012), 219.
- 28) R. Chaim: Mater. Sci. Eng. A-Struct., 443 (2007), 25.
- 29) Y. F. Zhang, A. J. Song, D. Q. Ma, X. Y. Zhang, M. Z. Ma and R. P. Liu: J. Alloy. Compd., 608 (2014), 304.
- 30) C. W. Kuo, K. C. Lee, F. L. Yen, Y. H. Shen, H. E. Lee, S. B. Wen, M. C. Wang and M. M. Stack: J. Alloy. Compd., 592 (2014), 288.
- 31) K. R. Kambale, A. R. Kulkarnin and N. Venkataramani: Ceram. Int., 40 (2014), 667.
- 32) J. W. Mullin: Crystallization, 4th ed., Elsevier Pte Ltd., Singapore, (2015), 226.
- 33) M. N. Rahaman: Ceramic Processing and Sintering, Marcel Dekker, Inc., NY, (2003), 603.


