3. Results and Discussion
3.1. Reduction Degree and Rate
Weight loss from hematite and CF reduction was chemically caused by the removed oxygen from iron oxide. Reduction degree, which is defined as the reaction proceed to a certain extent in terms of time, can be expressed as
where
α refers to the reduction degree, and ∆
mt and ∆
m0 represent the removed oxygen mass at a fixed time
t and the theoretically removed oxygen mass from iron oxide respectively. For hematite and CF, ∆
m0 accounts for 30% and 22.22% of the total mass, respectively.
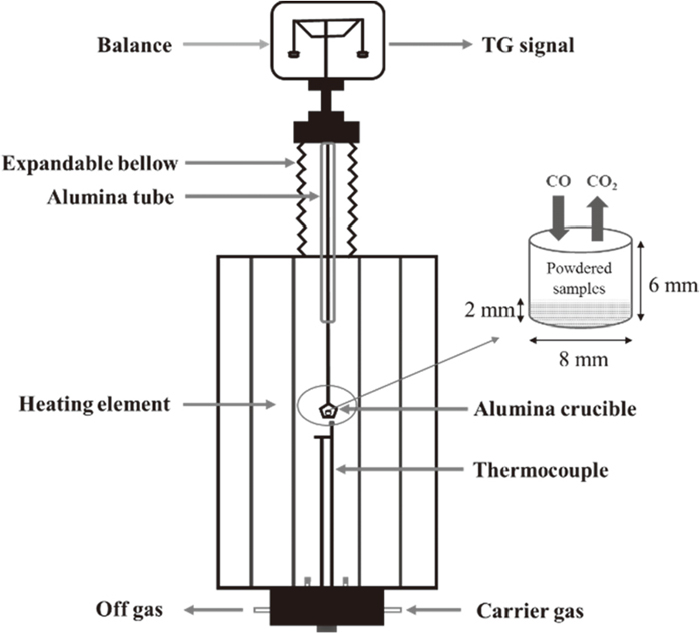
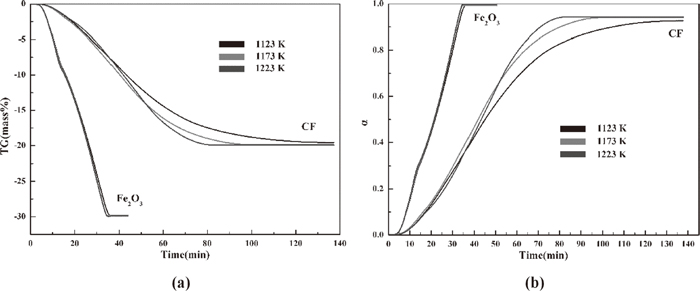
Two flow rates of gas mixtures was settle to exclude the effect of external diffusion on the reduction of hematite and CF as Fig. 4-a shows. The difference values of TG data reduced at 20 and 30 ml/min are not more than 2% and 1% for hematite and CF respectively. The results indicate the experimental schedule of samples reduced by gas mixtures at 20 ml·min−1 can nearly exclude the effect on the reduction process of hematite and CF. The weight loss data were easily gained by TG measurement. The changes in reduction degree with time for hematite and CF are described in Fig. 4-b. The oxygen removed from hematite and CF at 1123 K (850°C), 1173 K (900°C) and 1223 K (950°C) reaches almost 30 and 20 mass%, which are almost close to the theoretical values. For the whole hematite reduction process, the weight loss and reduction degree are not obviously different among the three temperatures, but different for that of CF especially during the middle and final stages. The samples show different weight loss behaviors at the same temperature for hematite and CF reduction. Clearly, CF reduction needs more time to complete than hematite reduction. That is, the completion of hematite reduction needs 35 min at 1123 K (850°C), 1173 K (900°C) and 1223 K (950°C), whereas that of CF reduction needs almost 140 min. Raising the temperature cannot obviously promote the hematite reduction process under the experimental conditions.

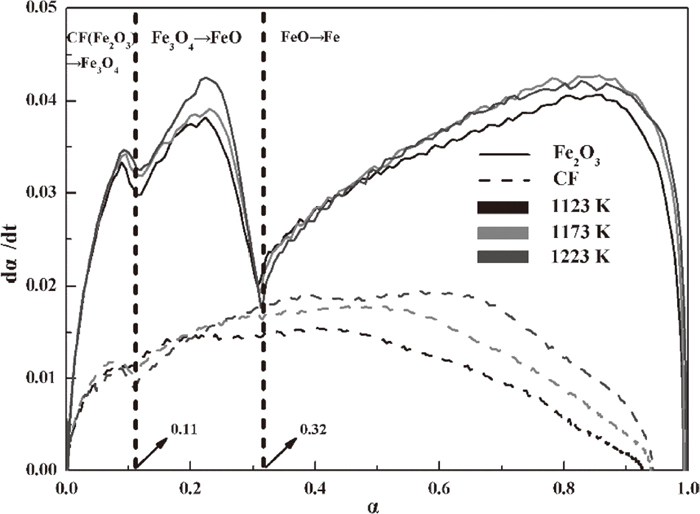
The calculation of the reduction rate dα/dt is shown in Fig. 5, in which the reduction rate of hematite is much faster than that of CF at the same reduction degree. This result indicates that the reduction of hematite is easier to achieve than that of CF and explains why the reduction degree of hematite could reach almost 1 but not that of CF when the time is extended.
The reduction steps of hematite and CF can be expressed as
|
F
e
2
O
3
(
CF
)
→F
e
3
O
4
→FeO→Fe.
| (2) |
The reduction of CF to magnetite is chemically essential to that of hematite to magnetite. Three rate peaks for hematite reduction corresponding to the three reduction steps are shown in
Fig. 5. The three reduction steps can be expressed as
|
3F
e
2
O
3
+CO=2F
e
3
O
4
+
CO
2
,ΔH=67 240J/mol
| (3a) |
|
F
e
3
O
4
+CO=3FeO+
CO
2
,ΔH=-22 400J/mol
| (3b) |
|
FeO+CO=Fe+
CO
2
,ΔH=13 190J/mol.
| (3c) |
it’s a typical “three-step” reduction process of hematite that the reduction degree lies in 0–11% for hematite to magnetite, 11%–33% for magnetite to wustite, and 33%–100% for wustite to iron, whereas a “two-step” reduction was observed that the reduction of CF from CF to magnetite occurs at reduction degree (0–11%), and the reduction from magnetite to wustite and the subsequent process from wustite to iron overlaps, showing a merging result, it can be explained by the simultaneous initiation of the wustite to iron reduction and the pending completion of the magnetite to wustite reduction.
3.2. Model Function Results
The kinetics basic equation13) that expresses the reduction rate as a function of temperature is shown as follows:
|
dα
dt
=k(
T
)
f(
α
)
,
| (4) |
where d
α/d
t is the reduction rate, and
k(
T) and
f(
α) are the rate constant and model function of the reduction reaction.
f(
α) is influenced by the reaction mechanism.
k(
T) is determined by the Arrhenius equation:
|
k(
T
)
=Aexp(
-E
RT
)
,
| (5) |
where
A is the pre-exponential factor,
E is the activation energy, and
R is the gas constant [8.314 J·(mol·K)
−1].
Equation (5) can be further expressed as
|
dα
dt
=Aexp(
-E
RT
)
f(
α
)
.
| (6) |
(
α) is usually not easily obtained, and
G(
α), which is the integral function of
f(
α), can be described as
|
G(
α
)
=
∫
0
α
dα
f(
α
)
=
∫
0
t
Aexp(
-E
RT
)
dt=k(T)t,
| (7) |
where
E,
A, and
G(
α) are called the “kinetics triplet.
14,15)”
E and
G(
α) are two parameters must be identified to analyze the reduction kinetics.
Two analysis methods may be applied to target G(α): ln-ln analysis4) and Sharp analysis.16)
According to the Avrami-Erofeev5,17,18) equation, the reduction degree α can be expressed as the relationship of time t and rate constant k:
where
n refers to the Avrami exponent. Obtaining the double natural logarithm on either side of the equal sign of
Eq. (8), we can formulate the following equation:
|
ln[
-ln(1-α)
]=nlnt+lnk.
| (9) |
The Avrami exponent
n can be obtained by the slope of the fitted line of ln[−ln(1−
α)] against ln
t,
i.e.,
|
n=
d{
ln[
-ln(1-α)
]
}
dlnt
.
| (10) |
The value of
n is directly related to
G(
α), which means that
G(
α) can be determined by first attaining the value of
n.
Table 1 shows the corresponding relationship between
G(
α) and
n. It worthy to say that functions A
2 and A
3 represent a 2D reaction with a plane-like mechanism and a 3D reaction with a spherulitic-type mechanism, respectively.
Table 1. Relationship between
G(
A) and
n for normal solid reactions.
| Functions | G(α) | n |
|---|
| D1(α) | α2=kt | 0.62 |
| D2(α) | (1−α)ln(1−α)+α=kt | 0.57 |
| D3(α) |
[
1-
(1-α)
1/3
]
2
=kt
| 0.54 |
| D4(α) | (1−2/3α)−(1−α)2/3=kt | 0.57 |
| F1(α) | −ln(1−α)=kt | 1 |
| R2(α) | 1−(1−α)1/2=kt | 1.11 |
| R3(α) | 1−(1−α)1/3=kt | 1.07 |
| A2(α) | [−ln(1−α)]1/2=kt | 2 |
| A3(α) | [−ln(1−α)]1/3=kt | 3 |
Sharp analysis defines a non-dimensional parameter y(α) as
|
y(
α
)
=
G(
α
)
G(
0.5
)
=
kt
k
t
0.5
=
t
t
0.5
,
| (11) |
where
G(0.5) refers to a fixed
G(
α) with
α=0.5, and
t0.5 is the time corresponding to
α = 0.5. The curves described by the plots of
y(
α) against
α are based on the normal solid reactions called standard curves. Experimental data [
αi,
ti/
t0.5(
i=
1,
2,
...l)] can be easily obtained through TGA. The corresponding
G(
α) can be identified when the experimental data match one of the standard curves.
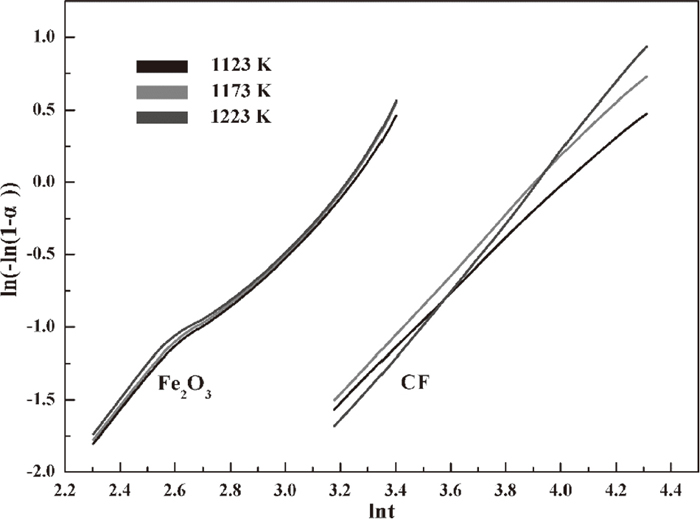
The relationship between ln[−ln(1−α)] and lnt for hematite and CF was determined through ln-ln analysis and is presented in Fig. 6. The Avrami exponents n can be calculated as the slope of the plots of ln[−ln(1−α)] against lnt shown in Fig. 7. The n values in Table 2 for hematite reduction can be divided into two stages. hematite reduction can be described by function A2 when the reduction degree α lies between 0.15 and 0.62 and by function A3 when α lies between 0.62 and 0.9. Meanwhile, CF reduction can be only expressed by function A2 as the n values for the entire process are approximately 2.
Table 2. Avrami exponent
n at 1123 K (850°C), 1173 K (900°C) and 1223 K (950°C) for hematite and CF (a: hematite, b: CF).
(a)
| Stages | α | n | Functions |
|---|
| 1 | 0.15–0.62 | 1–2.5 | A2(α) |
| 2 | 0.62–0.9 | 2.5–4 | A3(α) |
(b)
| T/K | 1123 | 1173 | 1223 |
|---|
| n | 1.31–2.03 | 1.48–2.17 | 1.87–2.63 |
| α | 0.15–0.8 | 0.15–0.87 | 0.15–0.9 |
| Function | A2(α) |
Sharp analysis is another method to confirm the ln-ln analysis result. The standard curves of the plots of y(α) against α and experimental data [α, y(α)] are shown in Fig. 8. The y(α) values for hematite reduction lie at the curve based on function A2 when α is less than 0.6 and then gradually tend to lie at the curve based on function A3. The experimental data y(α) values for CF reduction mostly lie at the standard curve corresponding to function A2. The Sharp analysis results markedly agree with the ln-ln analysis results.
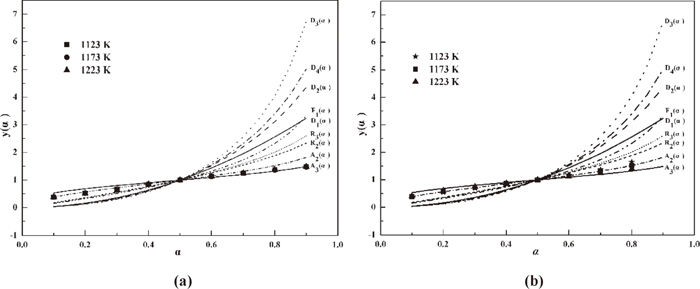
That is, the hematite reduction is controlled by a plane-like mechanism when the reduction degree values are lower than 0.62 and then determined by a spherulitic-type mechanism at the later stage. At the initial stage of hematite reduction, the hematite to magnetite reduction finishes as the reduction degree reaches 0.11 at a fast rate, and the CO content cannot increase up to the target value. Thus, the kinetics of this stage was not discussed in this study. Only the magnetite reduction was included in the discussion. The powdered samples were assumed to be the un-reacted layer, the magnetite layer appeared much larger than the periphery layers when the reaction occurred. As described in Fig. 9(a), the radius of the magnetite layer R is much higher than the distance of the CO diffusion d, and the decreased radius r from the magnetite to wustite reduction is still much less than R. This result indicates that the reduction process occurs in a 2D plane compared with the much larger unreacted layer (magnetite layer). As CO continuously diffuses, the magnetite layer gradually shrinks with decreasing R [Fig. 9(b)]. The R value is much lower than the d value, and the decreased radius r from the magnetite to wustite reduction is much higher than before. This result reveals that the reduction process undergoes a 3D spherulitic-type mechanism.

CF reduction is controlled only by a plane-like mechanism. It is caused by a low reduction rate, which makes the decreased radius r always much lower at all stages of CF reduction. Thus, the reduction mechanism is always of the 2D plane type.
In the shrinking core model shown in Fig. 10, which was initially derived from a single ore particle or ore pellet. The core is divided into several homogeneous and interphase layers, in which hematite, magnetite, wustite, and iron are homogeneous layers, and hematite-magnetite, magnetite-wustite, and wustite- iron are interphase layers. CO initially diffuses across the iron layer to reach the wustite-iron interphase layer, and a part of CO reacts with wustite to generate CO2, which diffuses out of the wustite-iron layer with the opposite direction of CO diffusion. The rest of CO continues to diffuse across the wustite layer to reach the magnetite-wustite interphase layer, and a part of CO still reacts with magnetite to generate CO2, which diffuses out of the magnetite-wustite layer as before. The remaining CO finally attaches to the hematite-magnetite layer and reacts with hematite to generate CO2. The unreacted core gradually shrinks as the reaction continues. The reaction rate based on this model only appears one rate peak for all the reduction stages. Figure 5 shows that the reduction of powdered hematite differs from the situation described by the shrinking core model that the magnetite (M) to wustite (W) reduction only occurs after the hematite (H) to magnetite (M) reduction finishes, and the wustite (W) to iron (I) reduction only occurs after the magnetite (M) to wustite (W) reduction finishes, the three reduction stages proceed independently distinguishing from the reaction style based on the shrinking core model.

Obtaining the natural logarithm on either side of the equal sign of Eq. (6), we can formulate the following equation:
|
ln
dα
dt
=lnA-
E
RT
+lnf(
α
)
.
| (12) |
When the reduction degree
α is a constant, ln
f(
α) remains unchanged. Therefore, the activation energy
E can be calculated as
|
E=-R
d(
ln
dα
dt
)
d(
1
T
)
.
| (13) |
This method of obtaining the activation energy, which is also called the model-free method, is free from the limit of the model function
f(
α). Another method is based upon the Arrhenius equation under the condition that the rate constant
k(
T) must be calculated as follows:
|
k(
T
)
=
dG(
α
)
dt
.
| (14) |
The Arrhenius equation is transformed to the following:
|
lnk(
T
)
=lnA-
E
RT
.
| (15) |
The activation energy
E can be calculated as
|
E=-R
d(
k(
T
)
)
d(
1
T
)
.
| (16) |
As for this analysis, the calculation of the activation energy
E is on the premise of the
G(
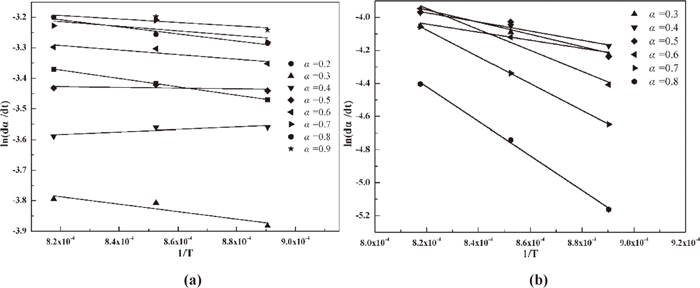
α) obtained.According to the model-free method, the activation energy
E can be obtained as the slope of the plots of ln(
dα/
dt) against 1/
T as shown in
Fig. 11. The CO content cannot reach the target value at the initial stage of hematite and CF reduction because of the gas switching from N
2 to CO and N
2 mixed atmosphere. In addition, the activation energy may not reflect the real energy change. Thus, reduction degrees above 0.2 for hematite and 0.3 for CF were selected for the calculation. The activation energy corresponding to reduction degree from 0.2 to 0.9 for hematite and 0.3 to 0.8 for CF are expressed in
Table 3.
Table 3. Activation energy
E at various reduction degree for hematite and CF (a: hematite, b: CF).
(a)
| α | 0.2 | 0.3 | 0.4 | 0.5 | 0.6 | 0.7 | 0.8 | 0.9 | Avg |
|---|
| E/(kJ·mol−1) | 29.58 | 20.59 | 8.74 | −0.76 | 5.81 | 9.22 | 7.05 | 7.32 | 10.94 |
(b)
| α | 0.3 | 0.4 | 0.5 | 0.6 | 0.7 | 0.8 | Avg |
|---|
| E/( kJ·mol−1) | 20.32 | 23.11 | 30.85 | 52.85 | 67.51 | 86.68 | 46.89 |
Clearly, the activation energy of hematite reduction is much less than that of CF reduction, which indicates that the former reaction proceeds more easily than the later reaction. This result is in line with the previous conclusion. The activation energy of iron oxide reduction has been calculated by many studies (Table 4). References 19), 20), and 21) researched the solid reduction of hematite by CO or H2 and found higher activation energy than this study, which may be caused by the higher purity and finer particles of hematite in this study. Reference 22) reflected the liquid reduction of hematite by CO.
Table 4. Activation energy of hematite reduction by other studies.
| E/ (kJ·mol−1) | Samples | Reduction gas | T/K | References |
|---|
| 8.2 | Fe2O3, <100 μm, powder | 50% CO+50% H2 | 973–1323 | [19] |
| 61 | Fe2O3, <100 μm, powder | 40% H2+60% Ar | 873–1073 | [20] |
| 64 | Fe2O3, analytical grade | H2 | 873–1323 | [21] |
| 47 | Fe2O3, analytical grade | 50%CO+50%CO2 | 1573–1873 | [22] |
The Arrhenius equation method can also be used to calculate the activation energy. Considering the complex stages in hematite reduction, we only applied this method for CF reduction. The rate constant k(T) was obtained by finding the plots of G(α) against time t (Fig. 12). The k(T) values at 1123 K (850°C), 1173 K (900°C) and 1223 K (950°C) are listed in Table 5. The fit coefficients R2 are all above 0.99. Higher temperatures mean larger values of k(T).
Table 5. Rate constant
K(
T) at 1123 K (850°C), 1173 K (900°C) and 1223 K (950°C).
| T/K | 1123 | 1173 | 1223 |
|---|
| k(T) | 0.0162 | 0.0196 | 0.0238 |
| R2 | 0.9976 | 0.9982 | 0.9987 |
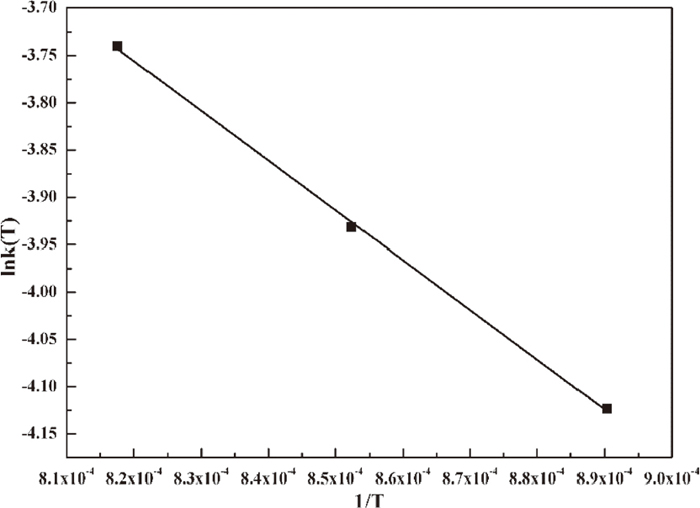
Determined by the Arrhenius equation, the activation energy can be obtained by the slope of fitting of lnk(T) against 1/T in Fig. 13. The activation energy is 43.74 kJ·mol−1 for this method. The pre-exponential factors at 1123 K (850°C), 1173 K (900°C) and 1223 K (950°C) on the basis of the model-free method and the Arrhenius equation method for CF can be determined by Eq. (5) (Table 6).
Table 6. Pre-exponential factor based on the model-free method and the Arrhenius equation method for CF at 1123 K (850°C), 1173 K (900°C) and 1223 K (950°C).
| A/(min−1) |
|---|
| T/K | 1123 | 1175 | 1223 | Avg |
| Model-free mothed | 2.45 | 2.40 | 2.39 | 2.41 |
| Arrhenius equation mothed | 1.75 | 1.74 | 1.75 | 1.75 |
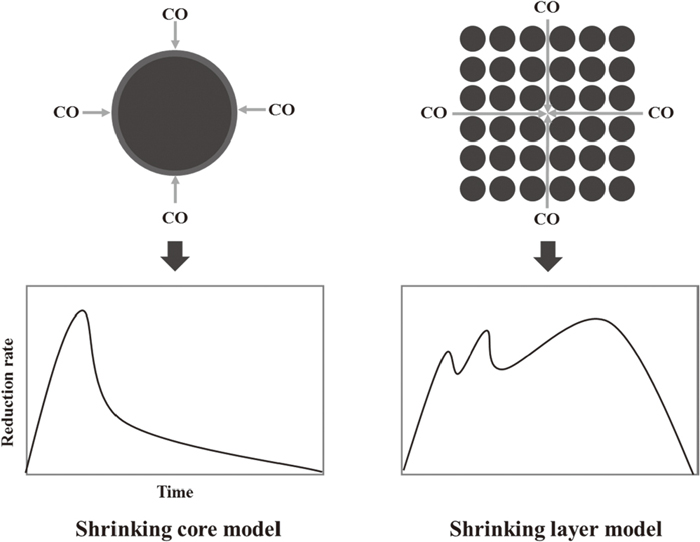
The reduction of hematite in this study can be described as three independent stages which shows that in the powdered samples all the H transformed to M, all the M to W and then all the W to I. The reduction of hematite at the experimental condition is distinguished from that of pellet iron oxide described by shrinking core model which caused by the powdered samples adopted but not pellet shown in Fig. 14. Large amounts of pore in the powdered samples has the CO diffused into samples smoothly, the reduction H to M proceeding rapidly goes along with the CO diffusion, this reduction stage for all samples completes before the reduction M to W occurs, however, in the shrink core model, the CO diffusion is blocked by the dense pellet, the reduction H to M cannot completes when the reduction M to W occurs. As the pore exists in the powdered samples, the CO diffuses not only in the macroscopic surface but also the particles pore, however, the pellet samples only reduced by CO in the macroscopic surface. It is nearly at the same time that chemical reaction occurs with CO diffusion in the reduction of powdered samples, whereas the chemical reaction lags behind CO diffusion in the pellet reduction. That is why in the shrinking core model that H reduced to M, then to W and finally to I only occur in the surface of unreacted core, not in the inner of particles. The reduction rate appears three peaks in the reduction of powdered samples but only one peak in the pellet reduction. In other words, the reduction of powdered samples of hematite and CF in this study can be described by shrinking layer model not the shrinking core model.
Temperature mainly contributes to the interphase reaction in the reduction process. As Fig. 5 shows, the effect of temperature on the reduction rate of hematite was not obvious compared with that of CF, especially at the middle and final stages of the reduction process. It supposes that CO inner diffusion is the rate-controlling step at the entire and initial stages of hematite and CF reduction, whereas interface chemical reaction is rate-controlling step at the middle and final stages of CF reduction.
The connection of the rate-controlling step of reduction rate to the activation energy of iron oxide was investigated by Nasr23) (Table 7). As for the hematite reduction process, the E values are all less than 29 kJ·mol−1. It speculated that CO diffusion is the rate-controlling step of the entire process of hematite reduction. The activation energy of CF reduction lies within 20–86 kJ·mol−1 with reduction degree increasing. Hence, the rate-controlling step of CF reduction are performed as inner gas diffusion, inner gas diffusion and interface chemical reaction mixed control then interface chemical reaction in turns with reduction degree increasing. These conclusions agree with the previous discussion. However, the discussion is not the study conclusion and needs more future work in next investigation.
Table 7. Relationship of rate-controlling step and activation energy of iron oxide.
| E/(kJ·mol−1) | Rate-controlling step |
|---|
| 8–16 | Inner gas diffusion |
| 29–42 | Inner gas diffusion and interface chemical reaction mixed |
| 60–67 | Interface chemical reaction |
| >90 | Solid diffusion |