Abstract
Mechanical properties of simplified model of ferrite/cementite lamellar structure in pearlite steel wire are examined by a strain gradient crystal plasticity analysis. Bagaryatsky and Pitsch-Petch relationships are used to determine crystallographic orientations of ferrite and cementite phases. Obtained results show that yield stress and strain hardening rate increase with reduction of lamellar thickness of ferrite layer and this increase is larger in the model with Bagaryatsky relationship than that with Pitsch-Petch one. Detailed mechanism that leads to this significant change in macroscopic mechanical response is discussed from the view point of dislocations’ behavior. Strain incompatibility effect between phases on the mechanical response is shown to be relatively small.
1. Introduction
Pearlite steel wire is one of the most important metallic materials in industry because of very high strength with reasonable ductility. Mecahnical properties of it are cloesely related with microstructure in which ferrite and cementite lamellae are piled up alternately within sub-micron intervals.1,2,3) For example, tensile yield stress increases with reduction of lamellar thickness and shows over 3 GPa.1,2,4)
These excellent mechanical properties are considered to come from strengthening of ductile ferrite layers1,2) and at the same time some amount of stable plastic deformation of brittle cementite layers.5,6) Dislocations needed for the plastic deformation of cementite layer are supplied from the ferrite layers7) and the stable plastic deformation of cementite layer is realized when yield stress and strain hardening rate of the ferrite layers are increased.8)
Thickness of ferrite layer decreases with reduction of cross-section area of pearlite wire by drawing.1,2,4) Thereby, dislocation density in the ferrite layer increases1) and subgrain boundary forms in the ferrite layer for heavy drawing.2,4) These are factors of scale effect and strengthen the ferrite layer. However, these factors disappear by annealing and yield stress of the annealed pearlite is still higher than that before drawing.9) Lamellar structure also shows the scale effect by dislocation’s behaviour: dislocation pileup near lamellar boundary and dislocation bowing.10,11)
Annealing decreases yield stress while increases strain hardening rate. The increase of strain hardening rate of ferrite layer is especially effective for stabilization of plastic deformation in cementite layer8) and considered to be one of the reasons for recovery of ductility in annealed pearlite.9) Therefore, to clarify the scale effect caused by the dislocations’ behavior in the ferrite layer is practically useful for fabrication of pearlite with high strength and good ductility. Nevertheless, it has not been examined.
While the dislocations’ behavior plays an important role in mechanical property of lamellar structure, difference in deformation property between layers also affects it. For single phase ferrite and cementite, strain components caused by same tensile deformation are incompatible with each other except for tensile strain. However, in the lamellar structure, this incompatibility of strain is constrained at lamellar boundary and arises stress in each layer.9,12) This stress has effect on yield stress and strain hardening rate.12)
Crystal orientation is also an important factor that influences mechanical property. In pearlite steel, ferrite layers have specific crystallographic orientation relationships with cementite layers. Frequently observed relationships are Bagaryatsky and Pitsch-Petch relationships.13,14,15,16) These relationships define crystal plane on lamellar boundary and crystal direction parallel to each other. Additionally, <110> direction of the ferrite layer is known to be nearly parallel to the drawing direction.3,17) Therefore, we can estimate the crystallographic orientation in each layer against loading direction.
Crystal plasticity analysis18) is one of methods that consider the dislocations’ behaviour. It was used to clarify scale dependent mechanical properties of single-phase polycrystalline model19) and two-phase material model with precipitate.20) In this paper, we examine mechanical properties of simplified models of the pearlite steel wire by the crystal plasticity analysis. Models are composed of three-layers; a ferrite lamella is sandwiched by two cementite lamellae. Orientation relationship between the ferrite and cementite phases is defined by Bagaryatsky or Pitsch-Petch orientation relationship.13,14,15,16) Mechanical response of the entire model, as well as ferrite and cementite layers are examined as a function of crystal orientation and layer thickness.
2. Dislocation Density Based Constitutive Equations
Analyses are made by crystal plasticity finite element method18) for body-centered cubic (abbreviated to bcc, hereafter) crystal. We assume that slip systems are {110}<111> and {112}<111>. {123}<111> slip systems don’t take into account here because it is considered to come from the superposition of {110}<111> and {112}<111>.21) Schmid’s law is assumed for their activation and given as
|
θ
(n)
=
P
ij
(n)
σ
ij
,
θ
˙
(n)
=
P
ij
(n)
σ
˙
ij
.
| (1) |
Here
θ(n),
P
ij
(n)
and
σij are the critical resolved shear stress (abbreviated to CRSS, hereafter), the Schmid tensor and the stress tensor, respectively. Right-hand sides in
Eq. (1) show the resolved shear stress (abbreviated to RSS, hereafter). Superscripts with parenthesis (
e.g. (
n) in
Eq. (1)) denote the slip system number, hereafter. The constitutive equation for the slip deformation based on the infinitesimal deformation theory is given by
22)
|
σ
˙
ij
=
[
S
ijkl
e
+
∑
n=1
24
∑
m=1
24
{
h
(nm)
}
-1
P
ij
(n)
P
kl
(m)
]
-1
ε
˙
kl
,
| (2) |
where
S
ijkl
e
,
εkl and
h(nm) denote the elastic compliance, total strain and strain hardening parameter, respectively.
We define the CRSS by the extended expression of Bailey-Hirsch type model,19)
|
θ
(n)
=
θ
0
+
∑
m=1
24
Ω
(nm)
aμ
b
˜
ρ
S
(m)
+3β
μ
b
˜
d
.
| (3) |
First, second and third term represent the lattice friction stress, Taylor’s hardening and Orowan stress, respectively. The third term is introduced in the equation to express scale effect of microstructure; when dislocation loops or curved segments expand inside a space of length scale
d, necessary minimum stress is given by this term. Details of this effect were discussed elsewhere for single phase material
19) and applied also to two-phase microstructure.
20) In this paper, the length scale
d is assumed to be equal to lamellar thickness
1,2) when we evaluate the CRSS of the ferrite layer. For the evaluation of CRSS of cementite layers, on the other hand, the Orowan stress is not included because dislocations are supplied from ferrite layers
7) before dislocation sources inside the cementite layers are activated and the curvature radius of the dislocation transferred from the ferrite layer is assumed to be sufficiently large compared to the lamellar thickness, that is,
d→∞.
μ,
b
˜
and
ρ
S
(m)
denote the elastic shear modulus, magnitude of the Burgers vector and the density of the statistically stored (abbreviated to SS, hereafter) dislocations.
a and
β are numerical coefficients of the order of 0.1
23,24) and 1,
19) respectively. We employ
a=0.1 and
β=1. Ω
(nm) defines the intensity of the interaction of slip systems
n and
m.
18,23) We assume isotropic hardening and use Ω
(nm)=1 for the diagonal components and Ω
(nm)≅1 for the off-diagonal components.
18)
Increment of the SS dislocation density is calculated by18,23)
|
ρ
˙
S
(n)
=
c
γ
˙
(n)
b
˜
L
(n)
.
| (4) |
denotes the plastic shear strain.
c is defined by (1+
α)
2/2
α where
α is the ratio of moving distance of edge and screw dislocations.
18) We ignore difference of the moving distance in this paper and use
c=2.
L(n) is the mean free path (abbreviated to MFP, hereafter) of moving dislocations and denotes distance until moving dislocation on slip plane is stopped by obstacles. In the pearlite microstructure, accumulated dislocations and lamellar boundaries are considered as these obstacles. Therefore, we define the MFP by the following model,
19)
|
L
(n)
=Min [
c
*
∑
m=1
24
ϖ
(nm)
(
ρ
S
(m)
+‖
ρ
G
(m)
‖
)
,d
],
| (5) |
where
d,
‖
ρ
G
(m)
‖
and
ω(nm) are the length scale used in
Eq. (3), the density norm of the geometrically necessary (abbreviated to GN, hereafter) dislocations
25,26) and weight matrix, respectively. We suppose that there is no interaction between dislocations on same slip system and use
ω(nm)=0 for the diagonal components and
ω(nm)=1 for the off-diagonal components.
c* is a material constant of the order of 10–100
24,27) and the higher
c* means lower strain hardening rate. We use
c*=20 for the ferrite layer. On the other hand, we use artificial value
c*=2000 for the cementite layer to make its strain hardening rate exceedingly small. This enable us to express the cementite layer as inherently brittle because the plastic instability condition becomes almost 0.
From above equations, the hardening coefficient is given by24)
|
h
(nm)
=
Ω
(nm)
aμc
2
L
(m)
ρ
S
(m)
.
| (6) |
3. Three-layered Pearlite Model
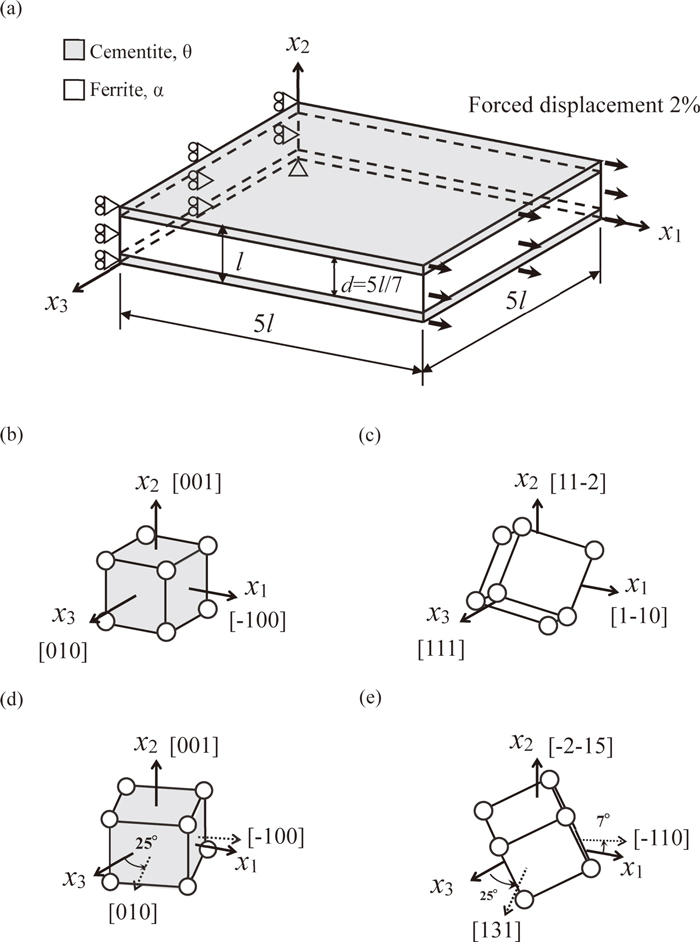
Figure 1(a) shows the model employed in this study where a ferrite (denoted as α, hereafter) layer is sandwiched by two cementite (denoted as θ, hereafter) layers. Dimension of the model is 5l×l×5l. Thickness d of the α-layer is 5l/7 and is assume to be d=50 or 500 nm1,2) in this study. Displacement and surface traction are continuous at the interface and we don’t introduce any special layers between the ferrite and cementite layers. The entire model (denoted as θ/α/θ, hereafter) is divided into eight-node finite elements and the total number of the elements is 50176. Uniform tensile displacement is given to the lateral surface at x1=5l, while the displacement of the opposite surface is fixed in x1 direction as shown in Fig. 1(a). Other lateral surfaces are free boundary.
We assume that α and θ-layers are elastically isotropic and use E=200 GPa and ν=0.3. The model is assumed to be annealed and its initial dislocation density is 1011 m−2.28) As the initial SS dislocation density, we distribute it to each slip system and use
ρ
S
(m)
=4.17×10⁹ m−2. Magnitude of the Burgers vectors
b
˜
for α and θ-layers are 2.48×10⁻¹⁰ m29) and 5.09×10⁻¹⁰ m,30) respectively. We use θ0=23 MPa (α-layer) and θ0=1304 MPa (θ-layers) to set the yield stresses of single materials close to 54 MPa31) (ferrite) and 2750 MPa32) (cementite).
Crystallographic orientations for α and θ-layers are determined in accordance to the Bagaryatsky13,16) or Pitsch-Petch relationship14,15,16) and experimental fact that <110> direction of the α-layer is nearly parallel to the drawing direction.3,17) In Bagaryatsky relationship, (001)θ//(11-2)α on the lamellar boundary and [010]θ//[111]α. Here, subscripts denotes the layer name. In Pitsch-Petch relationship, (001)θ//(-2-15)α on the lamellar boundary and [010]θ deviates 2.6 deg from [131]α. We neglect the deviation and assume [010]θ//[131]α. Figures 1(b), 1(c) and 1(d), 1(e) show the θ and α-layers in the model with the Bagaryatsky and Pitsch-Petch relationships, respectively. The drawing direction coincides with the x1 axis of loading direction.
Primary slip systems for the uniaxial tensile deformation of single phase material can be decided by choosing the slip system n whose
‖
P
11
(n)
‖
is closest to 0.5. For the Bagaryatsky relationship, the equivalent primary slip systems are (2-1-1)[111], (211)[-111], (2-11)[11-1] and (21-1)[1-11] in the cementite and (1-12)[-111] and (-112)[1-11] in the ferrite.
‖
P
11
(n)
‖
for the cementite and ferrite are 0.471. For the Pitsch-Petch relationship, the equivalent primary slip systems are (101)[-111] and (-101)[1-11] in the cementite and (1-12)[-111] in the ferrite.
‖
P
11
(n)
‖
for the cementite and ferrite are 0.492 and 0.497, respectively.
Before analyzing deformation of θ/α/θ model, we calculate tensile deformation responses of single phase cementite and ferrite. Figure 2(a) shows deformation response of the cementite. Yield stress for the Bagaryatsky relationship (Fig. 1(b)) is higher than that for the Pitsch-Petch relationship (Fig. 1(d)). The values are 2780 and 2665 MPa, respectively. This gap can be attributed to the differences in
‖
P
11
(n)
‖
. Strain hardening rate for both relationship is practically 0.

Figure 2(b) shows deformation response of the ferrite. Yield stress for the Bagaryatsky relationship (Fig. 1(c)) is also slightly higher than that for the Pitsch-Petch relationship (Fig. 1(e)). The values are 55 and 52 MPa, respectively. Moreover, strain hardening rate for the Bagaryatsky relationship is significantly higher than that for the Pitsch-Petch one. This is because plastic deformation in the ferrite with Bagaryatsky relationship occurs by double slip while that with the Pitsch-Petch one occurs by single slip.
4. Results and Discussions
Figure 3 shows stress distributions of σ11, σ33 and σ31 on x1x2 cross section at the center of three-layered pearlite (θ/α/θ) model when tensile strain ε11 is 1.4%. Figures 3(a)–3(c) are the results for the model with Bagaryatsky relationship and Figs. 3(d)–3(f) are the results for the model with Pitsch-Petch relationship. Although ferrite (α) and cementite (θ) layers in the both model deform plastically, the θ-layers are just after the yielding. Other stress components σ22, σ12 and σ23 which are not shown here are almost 0. The distributions of σ11, σ33 and σ31 are nearly homogeneous in the layers except for neighborhood of the model surface.

As shown in Figs. 3(a) and 3(d), normal stress σ11 in the α-layer is about 425 MPa (Bagaryatsky relationship) or 350 MPa (Pitsch-Petch relationship) while σ11 in the θ-layers is about 2750 MPa (Bagaryatsky relationship) or 2700 MPa (Pitsch-Petch relationship). These large differences of σ11 in the α and θ-layers are due to the differences of yield stress. Moreover, since primary slip systems of each layers were the same as those of the single phase state, the main reason for higher stress in the model with Bagaryatsky relationship is due to smaller
‖
P
11
(n)
‖
than that of the Pitsch-Petch one.
For the distribution of σ33, on the other hand, a large difference occurs between the model with Bagaryatsky and Pitsch-Petch relationships as shown in Figs. 3(b) and 3(e). σ33 in the α-layer is about 25 MPa (Bagaryatsky relationship) or -110 MPa (Pitsch-Petch relationship) while σ33 in the θ-layer is about −55 MPa (Bagaryatsky relationship) or 270 MPa (Pitsch-Petch relationship). These stresses arise from the incompatibility of strain ε33 between layers in single phase state. For the Bagaryatsky relationship, shrinkage ε33 of ferrite was slightly larger than that of cementite. For the Pitsch-Petch, on the other hand, the shrinkage ε33 of ferrite was quite smaller than that of cementite. Therefore, sign of the stress is the opposite and magnitude of it for the Pitsch-Petch is larger.
As shown in Figs. 3(c) and 3(f), distribution of σ31 is also different. For the model with Bagaryatsky relationship, σ31 is almost 0. On the other hand, σ31 for the model with Pitsch-Petch relationship is about 40 MPa (α-layer) or −95 MPa (θ-layers). The stress σ31 also arises from the strain incompatibility. The single phase ferrite with Bagaryatsky relationship and single phase cementite didn’t occur shear strain ε31. Therefore, σ31 is 0 for the Bagaryatsky relationship. Only for the single phase ferrite with Pitsch-Petch relationship occurred strain ε31. Therefore, σ31 arises.
Figure 4 shows stress-strain responses of θ/α/θ model, θ and α-layer in the model when lamellar thickness is 500 nm. We evaluate these responses by averaging stress and strain in entire model or each layer because the stress distributions are uniform as shown in Fig. 3. Yield stress and strain hardening rate of the θ/α/θ model, θ and α-layer with the Bagaryatsky relationship are larger than those with Pitsch-Petch one.

Elastic deformation behavior, yield stress and strain hardening rate of the θ-layer as shown in Fig. 4(a) are little bit different with those of single phase cementite in Fig. 2(a). While single phase cementites with the Bagaryatsky and Pitsch-Petch relationships have same linear relationship, the elastic behaviors of θ-layer in the θ/α/θ models with the Bagaryatsky and Pitsch-Petch relationships do not coincide with each other above tensile strain 0.15%. This is attributed to the incompatibility stress σ33 which influences σ11 by Hook’s law. The compressive stress σ33 decreases σ11 and inclination of elastic curve (Bagaryatsky relationship) and the tensile stress σ33 increases these (Pitsch-Petch relationship).
The yield stress in the θ-layer is about 2743 MPa (Bagaryatsky relationship) or 2685 MPa (Pitsch-Petch relationship). Although the CRSS in the θ-layer is the same as the single phase cementite, σ11 at the yielding in the θ-layer is about 37 MPa smaller (Bagaryatsky relationship) or 20 MPa larger (Pitsch-Petch relationship) than that in the single cementite. This is attributed to the incompatibility stresses σ33 and σ31 which influences the RSS in primary slip systems by Schmid’s law in Eq. (1). For the Bagaryatsky relationship, the RSS reaches the CRSS by smaller σ11 than the single phase because compressive stress σ33 such as shown in Fig. 3(b) increases RSS. On the other hand, because the incompatibility stresses reduce the RSS (decrease of the RSS by tensile σ33 (Fig. 3(e)) > increase of the RSS by negative σ31 (Fig. 3(f))) for the Pitsch-Petch relationship, larger σ11 is required to reach the CRSS.
The θ-layer with the Bagaryatsky relationship strain-hardens while strain hardening rate of that with the Pitsch-Petch relationship is almost 0. Because the CRSS is a constant value in the θ-layer, the strain hardening for the Bagaryatsky relationship is attributed to significant change in σ33 which influences σ11 according to the Schmid’s law. σ33 in the α or θ-layer was about −29 MPa or 71 MPa when ε11=2.0%. This is because shrinkage ε33 of the cementite was higher than that of the ferrite after the yielding of the cementite. On the other hand, strain incompatibility nearly unchanged for the Pitsch-Petch relationship.
Figure 4(b) shows stress-strain property of α-layer in θ/α/θ model. Unlike the θ-layer, elastic deformation of the α-layer is free from strain incompatibility and inclination of the elastic line coincides with elastic modulus. The yield stress in the α-layer is about 297 MPa (Bagaryatsky relationship) or 283 MPa (Pitsch-Petch relationship). The yield stresses are larger than those of single ferrite as shown in Fig. 2(b). This is attributed to the Orowan stress in Eq. (3). Because the θ-layers prevents dislocation movements in the α-layer, the Orowan stress for lamellar thickness 500 nm, about 115 MPa, is considered to the CRSS of the α-layer.
Strain hardening rates of the α-layer are also larger than those of the single ferrite as shown in Fig. 2(b). One of main reason for this is significant decrease of the MFP. While the MFP of single phase ferrite where moving of dislocations are encumbered by accumulated dislocations is about 65 μm, the MFP of α-layer where the dislocations are stopped by the θ-layers is 500 nm. Moreover, the α-layer with the Bagaryatsky relationship shows higher strain hardening rate than that with the Pitsch-Petch one. Similar to the single phase ferrite, this is mainly due to the difference of double slip (Bagaryatsky relationship) and single slip (Pitsch-Petch relationship).
As in the case of θ-layer, incompatibility stresses also affect the strain hardening of the α-layer. To clarify the difference of the incompatibility and restriction of moving dislocations, numerical results when elastic constraint by θ-layers is took away from α-layer, which means that the elastic coefficient of θ-layers is 0, are shown in Fig. 4(b) by dashed-dotted lines. For example, when tensile strain ε11 is 1.4%, stress of the α-layer with incompatibility (solid line) is about 17 MPa (Bagaryatsky relationship) larger or 3 MPa (Pitsch-Petch relationship) smaller than that without incompatibility (dashed-dotted line). Similar to the θ-layers, this is attributed to the incompatibility stresses σ33 and σ31. However, influence of the strain incompatibility on the strain hardening is small and less than about 14% because increase of stress from the yielding to ε11=1.4% is about 126 MPa (Bagaryatsky relationship) or 71 MPa (Pitsch-Petch relationship).
Figure 4(c) shows stress-strain curves of θ/α/θ model. These curves can be divided into three region according to the deformation state in the model; both α and θ-layers deform elastically (below ε11≒0.15%), only α-layer deforms plastically (ε11≒0.15–1.4%) and both layers deform plastically (above ε11≒1.4%). For this situation, yield stress for the θ/α/θ model is not clear. Therefore, we use 0.2% offset stress as the yield stress. The 0.2% offset stress is about 515 MPa (Bagaryatsky relationship) or 486 MPa (Pitsch-Petch relationship).
Figure 5 shows stress-strain properties for θ/α/θ model and each layer in the model when lamella thickness is 50 nm. To clarify the size effect, the properties when the lamella thickness is 500 nm in Fig. 4 are also shown by dashed lines. From Fig. 5(a), we find that the stress-strain properties for θ-layers of 50 nm are almost same with those of 500 nm. Therefore, stress which is caused by strain incompatibility slightly changes with reduction of the lamella thickness. While on the other hand, the stress-strain properties of α-layer and θ/α/θ model increase with the reduction of lamellar thickness.
Figure 5(b) shows that the yield stress in the α-layer is about 2508 MPa (Bagaryatsky relationship) or 2386 MPa (Pitsch-Petch relationship). Moreover, strain hardening rate significantly increases. Because the strain incompatibility does not depend on the lamellar thickness, this is almost entirely due to the constraint of dislocation movements by the θ-layers.
Green line in Fig. 5(b) shows the property of ferrite (named as ferrite5) which can stabilize plastic deformation of θ-layers in ferrite/cementite lamellar structure. Especially, the strain hardening rate is most important factor.8) In this analysis, the strain hardening rate of the α-layer with Bagaryatsky relationship is the same or more than that of ferrite5 when lamellar thickness is 50 nm. On the other hand, the strain hardening rate of the α-layer with Pitsch-Petch relationship is inferior to that with Bagaryatsky relationship. Additionally, the stresses in θ-layers with Pitsch-Petch relationship are disturbed at the neighborhood of the lateral surface at x1=0, 5l as shown in Figs. 3(e), 3(f). Thereby, we observed the plastic deformation in the θ-layers and found that local yielding occurs near the lateral surface before the macroscopic yielding in Fig. 4(a). It was not observed in the model with Bagaryatsky relationship. Moreover, the plastic instability condition of the θ-layer with the Bagaryatsky relationship is larger than that with the Pitsch-Petch relationship due to the difference of its strain hardening rate as shown in Figs. 4(a) and 5(a). From the above results, Bagaryatsky relationship is more preferable than Pitsch-Petch relationship in terms of stability of plastic deformation in cementite layers.
Figure 5(c) shows the stress-strain properties for θ/α/θ model. The 0.2% offset stress is about 2686 MPa (Bagaryatsky relationship) or 2522 MPa (Pitsch-Petch relationship). The 0.2% offset stress and strain hardening rate increase with the reduction of lamellar thickness. Because the stress-strain properties of θ-layer little changes with lamellar thickness, these increases mainly come from the strengthening of the α-layer.
The 0.2% proof stresses of real pearlite wire with lamellar thickness 56 and 45 nm are 1286 and 1614 MPa,1) respectively. Therefore, the 0.2% proof stresses of θ/α/θ model are about 1.8 times larger than that of the real pearlite. One of reasons for this gap is, firstly, difference of shapes between numerical model and experimental materials. Interphase boundaries between layers in real pearlite are neither smooth nor flat but there are concavities, convexities and holes.2,33) These concavity and convexity arouse concentration of stress and the existence of hole should decrease the Orowan stress. Secondly, because of drawing process, tensile residual stress over few hundreds MPa arises near the wire surface.34) The tensile stresses decrease the yield stress for tensile deformation.
5. Conclusions
Mechanical properties of ferrite/cementite lamellar structure model in pearlite steel wire with Bagaryatsky or Pitsch-Petch orientation relationship were examined by a strain gradient crystal plasticity analysis. Obtained results are as follows.
(1) Ferrite layer is strengthened due to restrictions of dislocation movement by cementite layers. The yield stress and strain hardening rate increase with reduction of lamellar thickness.
(2) Stress due to strain incompatibility slightly changes with reduction of lamellar thickness. Influence of the stress on stress-strain curve is smaller than that of restrictions of dislocation movement.
(3) Yield stress and strain hardening of ferrite/cementite lamellar structure model increase with reduction of lamellar thickness. The increase mainly comes from the strengthening of ferrite layer.
(4) Bagaryatsky relationship is superior to Pitsch-Petch relationship in terms of tensile strength and stability of plastic deformation in cementite layers.
Acknowledgement
This research was supported by Japan Science and Technology Agency (JST) under Collaborative Research Based on Industrial Demand “Heterogeneous Structure Control: Towards Innovative Development of Metallic Structural Materials”.
References
- 1) X. Zhang, A. Godfrey, X. Huang, N. Hansen and Q. Liu: Acta Mater., 59 (2011), 3422.
- 2) J. D. Embury and R. M. Fisher: Acta Metall., 14 (1966), 147.
- 3) F. Fang, L. Zhou, X. Hu, X. Zhou, Y. Tu, Z. Xie and J. Jiang: Mater. Des., 79 (2015), 60.
- 4) Y. Li, D. Raabe, M. Herbig, P. P. Choi, S. Goto, A. Kostka, H. Yarita, C. Borchers and R. Kirchheim: Phys. Rev. Lett., 113 (2014), 106104-1.
- 5) A. Inoue, T. Ogura and T. Masumoto: Trans. JIM, 17 (1976), 149.
- 6) M. Tanaka, Y. Yoshimi, K. Higashida, T. Shimokawa and T. Ohashi: Mater. Sci. Eng. A, 590 (2014), 37.
- 7) T. Shimokawa, T. Oguro, M. Tanaka, K. Higashida and T. Ohashi: Mater. Sci. Eng. A, 598 (2014), 68.
- 8) T. Ohashi, L. Roslan, K. Takahashi, T. Shimokawa, M. Tanaka and K. Higashida: Mater. Sci. Eng. A, 588 (2013), 214.
- 9) Y. Tomota, T. Suzuki, A. Kanie, Y. Shiota, M. Uno, A. Moriai, N. Minakawa and Y. Morii: Acta Mater., 53 (2005), 463.
- 10) M. Janecek, F. Louchet, B. Doisneau-Cottignies and Y. Bréchet: Philos. Mag. A, 80 (2000), 1605.
- 11) A. Misra, J. P. Hirth and R. G. Hoagland: Acta Mater., 53 (2005), 4817.
- 12) K. Tanaka and S. Matsuoka: Acta Metall., 22 (1974), 153.
- 13) Y. A. Bagaryatsky: Dokl. Akad Nauk SSSR, 73 (1950), 1161.
- 14) N. J. Petch: Acta Crystallogr., 6 (1953), 96.
- 15) W. Pitsch: Acta Metall., 10 (1962), 79.
- 16) D. S. Zhou and G. J. Shiflet: Metall. Trans. A, 23 (1992), 1259.
- 17) M. Zidani, S. Messaoudi, T. Baudin, D. Solas and M. H. Mathon: Int. J. Mater. Form., 3 (2010), 7.
- 18) T. Ohashi: Trans. Jpn. Inst. Met., 28 (1987), 906.
- 19) T. Ohashi, M. Kawamukai and H. Zbib: Int. J. Plast., 23 (2007), 897.
- 20) Y. Okuyama and T. Ohashi: Tetsu-to-Hagané, 102 (2016), 396.
- 21) R. Maddin and N. K. Chen: Prog. Met. Phys., 5 (1954), 53.
- 22) R. Hill: J. Mech. Phys. Solids, 14 (1966), 95.
- 23) T. Ohashi: Philos. Mag. A, 70 (1994), 793.
- 24) T. Ohashi and R. Kondou: Philos. Mag., 93 (2013), 366.
- 25) M. F. Ashby: Philos. Mag., 21 (1970), 399.
- 26) T. Ohashi: Philos. Mag. Lett., 75 (1997), 51.
- 27) D. Kuhlman-Wilsdorf: Mater. Sci. Eng. A, 113 (1989), 1.
- 28) J. Weertman and J. R. Weertman: Elementary Dislocation Theory, Oxford University Press, New York, (1992), 14.
- 29) S. J. Lee and Y. K. Lee: Scr. Mater., 52 (2005), 973.
- 30) M. Umemoto and K. Tsuchiya: Tetsu-to-Hagané, 88 (2002), 11.
- 31) R. W. K. Honeycombe and F. B. Pickering: Metall. Trans., 3 (1972), 1099.
- 32) M. Umemoto, Y. Todaka, T. Takahashi, P. Li, R. Tokumiya and K. Tsuchiya: Mater. Sci. Eng. A, 375–377 (2004), 894.
- 33) Y. T. Wang, Y. Adachi, K. Nakajima and Y. Sugimoto: Acta Mater., 58 (2010), 4849.
- 34) M. Elices: J. Mater. Sci., 39 (2004), 3889.

