Regular Article
Short-range and Medium-range Structural Order in CaO–SiO2–TiO2–B2O3 Glasses
2016 Volume 56 Issue 5 Pages 752-758
Details
2016 Volume 56 Issue 5 Pages 752-758
The present study aimed to provide a deep insight of short-range and medium-range structural order for CaO–SiO2–TiO2–B2O3 glasses. From various prospects, four techniques, FTIR, Raman, XPS and NMR, were simultaneously employed and only the direct evidences indicated from the spectra were used for structural analysis. The FTIR and Raman spectra proved that the main silicon-related units were Q0(Si), Q1(Si), Q2(Si) and Q3(Si) and the results of Raman fittings revealed that a B2O3 addition resulted in an increase of Q1(Si) and Q3(Si) at the cost of Q0(Si) and Q2(Si), thus inducing an increasing Degree of Polymerization (DOP). An enhanced DOP generally implied a lower abundance of non-bridging oxygen in the networks, which was further demonstrated by the O1s XPS fittings. Additionally, the 11B NMR spectra indicated that the dominant boron-related groups were BO3 trigonal comprising ring and non-ring BO3 as well as BO4 tetrahedral comprising BO4(1B,3Si) and BO4(0B,4Si). Furthermore, it was clarified that an increase of B2O3 content promoted the ratios of BO4(1B,3Si) to BO4(0B,4Si) and BO4 tetrahedral to BO3 trigonal, which undoubtedly identified the occurrence of an equilibrium reaction between NBO, BO4 tetrahedral and BO3 trigonal in the glass.
Glass, considering its widespread application nowadays and in history, is a fantastic material due to its unique structures and properties.1) From a structural viewpoint, it is known that glass phase is considered as a metastable, super-cooled liquid phase.1,2,3) Nature of the glass state remains a critical knowledge gap in modern science where only limited insights has been acquired, which even makes up an issue to be through lightly.4,5,6) Nowadays, there are two research fields about glass state to be identified, i.e., the medium-range order structures in a glass and the structure-property relations. To solve these mysteries, an understanding of the glass structures in contiguous length scale is quite significant, i.e., the short-range order (SRO, 2–5 Å), medium-range order (MRO, 5–20 Å) and long-range order (LRO, ≥ 20 Å).7) Due to the lack of LRO and the relatively constant SRO structures in a glass, identification of the connectivity of the local structures in the medium range, indeed, become a key step towards uncovering the nature of glass state.
In the family of glasses, borosilicate glass accounts for an important sub-type because of its wide utilizations in the glass-8) and metallurgical industry.9,10) Numerous studies have been thus performed to pursue the network structures of borosilicate glass, which could be categorized into three types based on the three important variables, viz., temperature, pressure and chemical composition. For example, Stebbins et al. found a conversion of BO3 trigonal to BO4 tetrahedral with increasing temperature.11) Recently, Edwards et al.12) discovered the dynamic process of the BO3→BO4 conversion with increasing pressure using a high pressure 11B solid state Nuclear Magnetic Resonance (NMR) spectroscopy. There appears a deformation of the BO3 planar triangle into trigonal pyramid, which serves as a precursor for the formation of BO4 tetrahedral. In the present study, the influence of the third variable, chemical composition, on the structures of borosilicate glasses was analyzed and possible structural conversions were identified.
Drawing parallels with silicate glass, there were five structural tetrahedral units of SiO4 in a silicate glass, which could be denoted as Qi(Si) (i=0, 1, 2, 3, 4), where i represents the number of bridging oxygen.13,14,15,16) The fractions of these units can be derived based on the deconvolutions of Raman or Magic Angular Spinning Nuclear Magnetic Resonance (MAS-NMR) curves. The present study aimed to apply these methods to borosilicate glasses.
From the prospect of structure-property relations, measurement of the structures of borosilicate glasses was expected to throw much light on the evolution of the macroscopic properties. Studies on viscous flow behaviors of the borosilicate melts17,18,19,20) generally show a decreasing viscosity with increasing B2O3 content in the melts. In addition, in a previous study on crystallization behaviors,21) we found that a B2O3 addition of 5% brought about a drastic change of primary crystalline phase in a CaO–SiO2–MgO–Al2O3–TiO2–B2O3 melt, viz., from CaTiO3 to TiO2. All these forgoing variations of macroscopic properties could be connected to the microscopic structure of the glasses; the present study was therefore motivated. A glass of CaO–SiO2–TiO2–B2O3 was designed herein and different techniques were employed to complementarily confirm the structural analysis, which made up a main methodology followed by this study. As a consequence, it was feasible that only the direct evidence indicated from the spectra was used for the structural analysis. Another innovation was the quantification of the local structures and their connectivity in the glasses, which could be achieved by deconvolutions of the spectral curves obtained.
In this study, glass samples of the quaternary CaO–SiO2–TiO2–B2O3, with a fixed basicity of 1.2 (mass ratio of CaO to SiO2), were prepared, using the conventional melting-quenching method. Reagent purity grade materials of CaO (99.5%), SiO2 (99.5%), TiO2 (99.8%) and H3BO3 (99.5%) (Produced by Alfa Aesar company) were thoroughly mixed and placed in a Pt crucible (Φ40×45×H40 mm). The mixture was melted at 1823 K (1550°C) in a tube furnace in air and soaked for 2 hours to in order to confirm the homogeneity. After pre-melting, the liquid melts were rapidly poured from the crucible into cold water to be quenched so that it formed a glassy state. Subsequently, the samples were dried in air at 378 K (105°C), crushed and ground to less than 300 meshes for spectral measurements. The compositions of the samples prepared are presented in Table 1. In order to confirm the amorphous nature, the samples were characterized by X-ray diffraction (XRD) technique (D/Max 2500, Rigaku, Japan).
| Sample | CaO | SiO2 | B2O3 | TiO2 | CaO/SiO2 |
|---|---|---|---|---|---|
| CSBT-1 | 41% | 34% | 0 | 25% | 1.20 |
| CSBT-2 | 38% | 32% | 5% | 25% | 1.20 |
| CSBT-3 | 35% | 30% | 10% | 25% | 1.20 |
| CSBT-4 | 33% | 27% | 15% | 25% | 1.20 |
The structures of the glass samples were complementally characterized using FTIR, Raman, MAS-NMR and XPS spectra. The FTIR spectra were recorded in the wavenumber range of 4000–400 cm−1 using a Tensor 27 spectrometer (Bruker, USA), with a spectral resolution of 2 cm−1. About 2.0 mg samples was mixed thoroughly with 200 mg pure KBr, ground well in an agate motor and pressed into a disc of 13.0 mm diameter for the infrared measurement. The Raman spectra in the range of 200–2000 cm−1 were collected at room temperature using a JY-HR800 spectrometer (Jobin Yvon Company, France) with a light source of a 1 mW semiconductor. The excitation wavelength was 532 nm. In order to further clarify the structural roles of boron in the glass samples, solid state 11B MAS-NMR measurements were conducted using a 400M FT-NMR spectrometer (Avance III 400M, Bruker, USA) with a MAS probe of a 4 mm ZrO2 rotor and two pairs of Dupont Vespel caps. In order to identify the functionalities of O atom in the glasses, X-ray photoelectron spectroscopy (XPS) were employed using an Imaging Photoelectron Spectrometer (AXIS-Ultra, Kratos Analytical), with monochromatic Al Kα radiation (225 W, 15 mA, 15 kV) and low energy electron flooding for charge compensation. In addition, a C 1s hydrocarbon peak at 284.8 eV was used to calibrate the bond energies.
In order to understand the influence of B2O3 on the network structures, these glass samples were first characterized using FTIR spectra. The results are presented in Fig. 1. Several remarkable variations appeared on the spectra. The effective spectral range of 400–1600 cm−1 could be divided into four regions, i.e., the 400–600 cm−1 and 600–800 cm−1 regions with low intensity, and the 800–1200 cm−1 and 1200–1600 cm−1 regions with high intensity. These spectral bands could be parallelly labeled with the help of the Raman spectra because of the complex structural groups in the networks.

FTIR spectra for the glasses.
The 400–600 cm−1 band, assigned to the O–Si–O bending vibrations,22,23) got less pronounced from sample CSBT-1 to CSBT-4 because of the lower concentration of SiO4 tetrahedron with increasing B2O3 content. On the contrary, the 600–800 cm−1 band, associated with B–O–B bending vibrations,23,24) became more profound with increasing B2O3 content, which indicated increasing boron atoms were interconnected into the networks as B2O3 substituted CaO and SiO2. Especially, a band located at ~710 cm−1, generally attributed to the oxygen bridges between two BO3 trigonal,25,26) gradually grew with increasing B2O3 content, indicating one main type of boron-related structural group in the glasses could be BO3 trigonal.
The 800–1200 cm−1 band was a remarkable region in the FTIR spectra of silicate glasses, which was generally associated with the stretching vibrations of SiO4 tetrahedral.22,27) Interestingly, a shoulder centered near 845 cm−1, assigned to Q0(Si), slightly became less apparent with increasing B2O3 content, which could suggest an increasing degree of polymerization (DOP) of the networks. In the spectral region of 1200–1600 cm−1, two bands, centered at 1215 cm−1 and 1374 cm−1, gradually appeared only with the existence of B2O3 in the glasses. These two bands could be assigned to the BO4 tetrahedral and BO3 trigonal, respectively,25,26) which largely accounted for the dominant types of boron-related structural groups present in the borosilicate glasses.
3.2. Raman Spectra for the Glass SamplesTo further explore and verify the structural analysis, Raman measurements were carried out. The spectra obtained are presented in Fig. 2. Similar to the FTIR curves, these Raman curves showed a continuous variation with varying B2O3 contents. The whole Raman spectral range between 100 cm−1 and 1600 cm−1 could be divided into four regions, viz., the 600–1200 cm−1 band with low intensity, the 1200–1600 cm−1 band with high intensity and the 100–250 cm−1 and 250–600 cm−1 regions with medium intensity.

Raman spectra for the glasses.
The band in the range of 250–600 cm−1 could be attributed to the O–Si–O bending vibrations and those due to Ca–O complex,15,16) the shape of which slightly varied. In addition, it can be noted, in range of 1200–1600 cm−1, a small band centered at 1370 cm−1,25,26) originating from BO3 trigonal, gradually appeared with B2O3 additions from sample CSBT-1 to CSBT-4; the variation trend of this band also indicated a dominant existence of BO3 trigonal in the networks, which was in agreement with the FTIR spectra. While compared to the FTIR spectra, the BO4 tetrahedral was not observed in the Raman spectra, which should be further confirmed using other techniques in the following sections.
Moreover, there was a more remarkable band in the range of 600–1200 cm−1, which could be attributed to the stretching vibrations of SiO4 tetrahedra and titanium-related structures.15,16,28,29,30,31) In particular, according to the previous studies, this region could be divided into two parts, i.e., the band of ~600–800 cm−1 originating from titanium-related structural units28,29,30,31) and the band of ~800–1150 cm−1 originating from SiO4 tetrahedral.15,16,27) In order to determine the number of these structure units, in an effort to quantification, deconvolution of the Raman curves was conducted in the range of 600–1150 cm−1, strictly following the rules proposed by Mysen et al.32) First, it is assumed that the Raman curves can be divided into several Gaussian functions stemming from different local structures. Second, the peaks, shoulders or bands are inserted into the spectral curves only in the regions strictly proved by the studies. As for the silicon-related structures, the Raman spectra have been numerously investigated and generally, the peaks at ~870, ~960, ~990, and ~1050 cm−1 could be assigned to the stretching modes of Q0(Si), Q1(Si), Q2(Si), and Q3(Si), respectively.13,14,15,16) As for the titanium-related structures, many researches demonstrated that two bands at around 710 cm−1 and 790 cm−1 could be assigned to the O–Ti–O deformation and the TiO44− monomers, respectively,15,28,29,30) which was also clearly observed in the present Raman spectra. In summary, six Gaussian functions originating from silicon-related and titanium-related local structures were adopted to deconvolute the Raman curves in the range of 600–1150 cm−1.
The deconvolution results of different Raman curves are presented in Fig. 3. It can be observed these six Gaussian functions fitted well with the Raman envelopes, which, actually, was a confirmation of the applicability of the present methodology. As one of the main objective of this study was to quantify the glass structures, after Raman fittings, the mole fractions (Xi) (i=0, 1, 2, 3) of various SiO4 tetrahedral (Q0(Si), Q1(Si), Q2(Si) and Q3(Si)) could be further derived according to the peak areas (Ai), calibrated by the Raman scattering coefficient (Si), by means of Eq. (1):14,33,34)
| (1) |

Deconvolution of Raman spectra: (a) CSBT-1, (b) CSBT-2, (c) CSBT-3 and (d) CSBT-4.
The results are presented in Fig. 4. As can be observed, the mole fraction of Q1(Si) and Q3(Si) increased significantly while those of Q0(Si) and Q2(Si) decreased with increasing B2O3 content. This indicated that the SiO4 tetrahedrons with more bridging oxygen (BO) prominently increased; in other words, with B2O3 addition, there appeared an equilibrium reaction between the NBO and the BO that the NBO was consumed and more BO was formed, which would be further analyzed by the O1s XPS spectra. Moreover, the variation trend of various Qi(Si) indicated an increasing DOP of the glass structures, which was in agreement with the results of FTIR spectra. These results, indeed, proved that B2O3 acted as a typical network former contributing to polymerization of the silicate glasses. In the case of pure B2O3 forming a glass phase, the only structural units, are BO3 trigonal, as shown in previous study.3) Thus it can be deduced that the BO3 trigonal existing caused by the B2O3 addition, captured the NBO of Q0(Si) and Q2(Si) and got transformed into BO4 tetrahedral, resulting in the formation of more Q1(Si) and Q3(Si). Based on the foregoing analysis, the reactions occurring in the glasses with B2O3 addition could be described by the following equations:
| (2) |
| (3) |

Mole fractions of various Qi(Si) units in the networks by Raman spectra fittings.
In order to verify the occurrence of the equilibrium reaction between the NBO and BO in borosilicate glasses and to further clarify this mechanism, the O1s XPS spectra were obtained. The results are presented in Fig. 5. As can be seen, the O1s XPS spectra could be divided into two parts, a peak corresponding to higher bond energy, attributed to BO and a peak with lower bond energy, attributed to NBO.23,35) A variation trend was that the center of this band gradually moved to the left side with higher binding energy with increasing B2O3 content, which indicated an increasing BO content and thus a higher DOP in the networks. In addition to the variation trend of the mole fractions of various Qi(Si), it was further indicative of an equilibrium reaction between the NBO and BO in the glasses,35) as described by means of the following equations:
| (4) |
| (5) |

O1s XPS spectra for the samples.
To further quantify the relative abundance of NBO and BO in the glasses, two Gaussian functions, associated with NBO and BO, respectively, could be applied to deconvolute the O1s XPS spectra. This method has, actually, been demonstrated as an effective way to analyze the state of oxygen in a glass.23) As shown in Fig. 6, two Gaussian functions could exactly fit these spectra. Based on the areas of the two peaks associated with BO and NBO, the content of NBO and BO could be deduced, as displayed in Fig. 7. It can be clearly seen that the BO content gradually increased with the B2O3 content increasing from 0 to 15% with a small increment, which confirmed the occurrence of the reactions (4 and 5) in the glasses. On the other hand, an increase of the BO content was indicative of an increase of DOP of the glass structures, which, again, was in consistent with the results of FTIR spectra and Raman deconvolutions.

Deconvolution of O1s XPS spectra: (a) CSBT-1, (b) CSBT-2, (c) CSBT-3 and (d) CSBT-4.

Content of BO and NBO in the networks by O1s XPS spectra fittings.
After quantifying the structural units of SiO4 tetrahedral and oxygen in the glasses, the structural information obtained in the present work can further be extended to the derivation of the boron-related structural units such as the relative content of BO4 tetrahedral and BO3 trigonal, since the B2O3 content acted as a main variable in the present glasses. Therefore 11B MAS-NMR spectra measurements were further performed, as presented in Fig. 8. Based on the NMR spectra, several characteristics could be clarified. First, the NMR spectra could be divided into two main regions, i.e., a region associated with BO3 trigonal at higher chemical shifts and a region associated with BO4 tetrahedral at lower chemical shifts, respectively.8,36,37,38,39) Second, generally, the higher chemical shift region was composed of two bands, assigned to two types of BO3 trigonal, namely BO3 trigonal rings and BO3 trigonal that do not form rings.8,38,39)
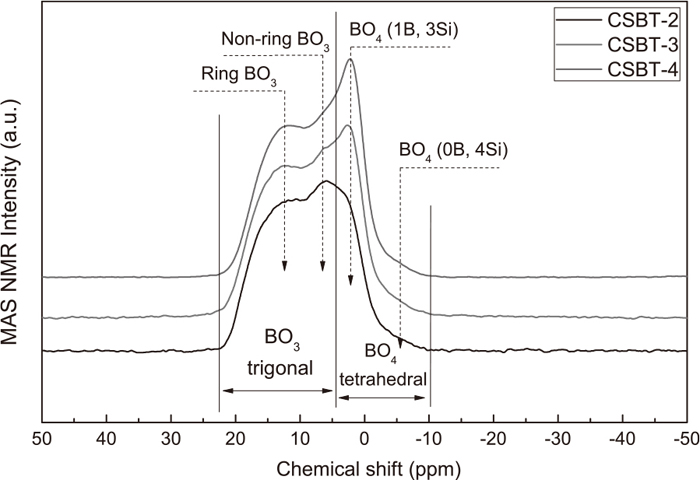
11B MAS-NMR spectra for the glasses.
Third, the lower chemical shift region, originating from the vibration modes of BO4 tetrahedral, was mainly made up of a peak at around 2.15 ppm, which could be assigned to the BO4 tetrahedral connected to three silicon atoms and one boron atom (BO4 (1B, 3Si)).39,40) An apparent trend was that, with increasing B2O3 content, this peak became more pronounced, indicating that more BO4 (1B, 3Si) was formed in the glasses. In addition, another weak shoulder was noticed appearing at around −3.85 ppm, which originated from the BO4 tetrahedral connected to four silicon atoms (BO4 (0B, 4Si)).8,38,39) In order to quantify the relative content of BO4 tetrahedral and BO3 trigonal in the glasses, it is crucial to deconvolute the NMR spectra. However, a reasonable fitting of an NMR curve was not easy because the higher chemical shift region, associated with BO3 trigonal, could not be simply simulated using several Gaussian function.8,38,39) But the lower chemical shift region associated with BO4 tetrahedral, as observed, could be fitted using two Gaussian functions related to BO4 (1B, 3Si) and BO4 (0B, 4Si). Therefore a feasible approach could be that the lower chemical shift region was first tentatively deconvoluted using two Gaussian functions and then the differences of initial NMR values and these two Gaussian functions were taken as the band of BO3 trigonal.
The foregoing fitting process was performed in this study and the results are presented in Fig. 9. The three bands observed, ascribed to BO4(1B, 3Si), BO4 (0B, 4Si) and BO3 trigonal, respectively, can exactly and smoothly simulate the 11B MAS-NMR spectra, providing a possible solution to the structure clarification using the present methodology. Based on areas of the bands from the NMR fittings, the relative content of different boron-related structures could be evaluated. The calculation results are presented in Fig. 10. First, the ratio of BO4 (1B, 3Si) to BO4 (0B, 4Si) could be determined by calculating the ratio of the areas of these two Gaussian functions. As can be seen, an increase of B2O3 content gave rise to a higher ratio of BO4 (1B, 3Si) to BO4 (0B, 4Si). Actually, an important effect of BO4 group avoidance reported in literatures8,39) was that the BO4 tetrahedral showed a preferential trend for interconnection with near silicon atoms leading to less B–O–B bonds in the borosilicate glasses. This was confirmed by the results obtained in the present study. However, with increasing B2O3 content, the content of SiO2 decreased simultaneously, which in turn, would lead to fewer lattices for BO4 insertion. Thus more BO4 (1B, 3Si) was formed, increasing the number of B–O–B bonds. This phenomenon, indeed, indicated another equilibrium reaction between BO4 (1B, 3Si) and BO4 (0B, 4Si), as described by the following equation:
| (6) |

Deconvolution of 11B MAS-NMR spectra: (a) CSBT-2, (b) CSBT-3 and (c) CSBT-4.

Content of BO3 trigonal and BO4 tetrahedral in the networks by 11B MAS-NMR spectra fittings.
Moreover, another important phenomenon observed was that the ratio of BO4 tetrahedral to BO3 trigonal increased with increasing B2O3 content, which finally demonstrated the equilibrium reaction between these two species. On the other hand, more BO4 tetrahedral was present in the structures as compared with BO3 trigonal related to the newly added B2O3 in the glasses. Assuming that the added B2O3 originally existed as pure BO3 trigonal, these BO3 trigonal could get linked to the NBO and gave rise to BO4 tetrahedral. Considering the varying content of BO-NBO in the glasses, the equilibrium reaction could be described as follows:11,12)
| (7) |
This equation was, in fact, another form of Eqs. (2) and (3). Based on Eq. (7), another parameter, equilibrium constant of this reaction, K, could be introduced, defined as:11,40)
| (8) |
As aforementioned, the clarification of the structural units of the glasses itself was extremely interesting and this could also enable an exploration of the structure-property relations. First, for the viscosity change,17,18,19,20) the dominant existence of the two-dimension BO3 trigonal in the three-dimension networks could weaken the whole rigidity of the structures. This effect could thus cause a decrease of the melt viscosities, despite the increasing DOP of the glasses. Second, the added B2O3, as a typical acid oxide, could act as a network former in the glasses, resulting in an increase of DOP. Specially, another main boron-related local structure in the glasses was BO4 tetrahedral, which required that the Ca2+ cations acted as change balancing cations. This, in turn, restricted the connectivity of Ca2+ and TiO44− and consequently enhanced the precipitation of TiO2, as demonstrated by our previous study.21) Thus, the present study not only leaded to a better understanding of the structure of borosilicate glasses, but also provided a possible insight of the structure-property relationships especially in the medium-range order.
This present work attempted an understanding of the short-range and medium-range structural order in CaO–SiO2–TiO2–B2O3 glass. In order to confirm the structural analysis, FTIR, Raman, O1s XPS and 11B MAS-NMR spectra were complementarily employed. It was discovered that the fraction of Q1(Si) and Q3(Si) increased while fraction of Q0(Si) and Q2(Si) showed a decrease with increasing B2O3 content. The DOP of the glasses was consequently enhanced. This agreed well with the results of O1s XPS fittings that the content of BO increased while that of the NBO decreased with more B2O3 additions. Additionally, not only the FTIR but also the 11B MAS-NMR results demonstrated the existence of BO3 trigonal and BO4 tetrahedral in the networks. BO3 trigonal could generally be divided into ring and non-ring BO3 and the BO4 tetrahedral was made up of BO4(1B,3Si) and BO4(0B,4Si). Based on 11B MAS-NMR deconvolutions, it was found that an increase of B2O3 content gave rise to the ratio of BO4 tetrahedral to BO3 trigonal. Most importantly, an equilibrium reaction between NBO, BO4 tetrahedral and BO3 trigonal was identified in the glass, considering the variations of the relative amounts of BO–NBO and BO3–BO4.
The authors gratefully acknowledge financial support by the Common Development Fund of Beijing, the National Natural Science Foundation of China (51172001, 51074009 and 51172003), the National High Technology Research and Development Program of China (863 Program, 2012AA06A114).