Abstract
Three metallurgical cokes made from coking coals over a significant range in rank were subjected to treatment with blast furnace-like gas composition-temperature profile to 1673 K, annealing under N2 to 2273 K and gasification with subsequent annealing at 1873 and 2273 K. The degradation of cokes after reaction and annealing was characterised using I-drum tumbling, tensile testing, ultra-micro indentation and X-ray diffraction. Both gasification and annealing decreased the mechanical strength of coke. Compared with annealing at 1673 K, gasification at same temperature caused larger degradation for all three cokes, and the effect was more significant on more reactive coke. In the annealing process, degradation of the cokes occurred through the entire coke lump and resulted in both tensile strength and I-drum tumbling strength decreasing simultaneously. In the process of gasification under the blast furnace-like conditions, degradation took place through the whole piece of coke with high reactivity; however, the degradation of coke with low reactivity was more severe at the periphery than in the core and therefore gasification had a minimal effect on the core of the coke and its tensile strength, but had a much stronger effect on I*600. Microstrength of coke decreased significantly with increasing annealing temperature. The change of microstrength of coke upon gasification, which occurred at relatively low temperatures, was marginal. The cokes after gasification with subsequent annealing had similar microstrength and graphitisation degree compared to those subjected only to annealing at the same temperature.
1. Introduction
High productivity blast furnace (BF) ironmaking operations within modern integrated steelworks are subject to relentless cost pressures. Metallurgical coke represents a significant proportion of the production costs in the BF operation. Functionally, metallurgical coke is both a fuel and reductant in the BF, providing support to the ore burden materials; it is the only material that remains a solid phase in the high temperature zones adjacent to the blast furnace combustion zones (raceways).
The mechanical strength of a coke is much higher than the load under which coke is subjected to in the BF. The coke is required to maintain adequate strength to support the furnace burden materials and resist abrasion, minimising fine coke generation with consequent diminution of burden permeability. However, coke samples collected from the lower region of the BF typically show evidence of significant degradation, such as microtextural changes and lump-size decrease. Apart from the fractures extending from pre-existing fissures, the degradation of coke in the BF is mainly caused by the gas-solid reaction and heating to high temperature. Peak coke temperatures are up to 2273 K (close to the typical raceway flame temperatures).
The properties of coke under the BF operating conditions have been studied with a focus on the reactivity and mineral phase changes of cokes.1,2,3,4,5) Babich et al.1) conducted experiments under the real BF gas-temperature conditions, and observed a higher reaction rate of the cokes close to the wall of BF than that in furnace centre. Lundgren et al.2) studied the reactivity of cokes charged into an experimental BF, and suggested that the solution loss reaction in the BF was limited by the diffusion rate and the reaction mainly took place in isotropic area of cokes. Hilding et al.3) found that the reactivity of coke increased during progressive movement from the thermal reserve zone to cohesive zone of the experimental BF. Gornostayev et al.4) investigated the transformations of mineral matters of cokes in the BF and claimed that the transformation of mineral matters of coke in the BF reduced coke reactivity by covering the pore wall and the redistribution of mineral phases led to the creation of weak spot in coke matrix, thus reducing the coke strength. However, the degradation of coke mechanical strength under the BF gasification conditions has not been systemically studied.
The effect of heating on the coke strength was studied previously.6,7,8,9,10,11) Grant et al.6) found that the compressive strength of cokes at 1673 K was higher than that at ambient temperature. On the other hand, Echterhoff7) conducted the Micum test of coke at 1323 K and observed a general deterioration in the coke strength when the temperature increased above the coking temperature. This phenomenon was also confirmed by Bradshaw et al.8) Patrick et al.11) observed a degradation of tensile strength of cokes when tested at 1723 K. Xing et al.9,10) examined the effect of annealing of cokes, chars and pyrolysed coals in the temperature range of 973 to 1773 K on tensile strength measured at room temperature. The tensile strength of chars and pyrolysed coals was strongly enhanced by annealing in the temperature range of 973–1373 K. The tensile strength of cokes was slightly decreased by the heat treatment after the annealing temperature increased above 1573 K. Coke degradation upon heating to temperatures close to the raceway flame temperature was not studied.
In this study, properties of coke were studied under simulated temperature and gas composition conditions in the blast furnace ironmaking operation. The aim of this investigation is to quantify the degradation of coke macro- and micro-strength upon reaction under conditions simulating blast furnace gas composition-temperature profiles and develop a fundamental understanding to the mechanisms of coke degradation in the blast furnace ironmaking operation.
2. Experimental Section
2.1. Materials
Three metallurgical cokes A, C and D were studied in this work. Coke A was a production coke from a medium volatile base blend of moderate inertinite content (36.9 vol.%) with the addition of 11 wt% semi-soft coal. The fused component was dominated by fine-medium lenticular microtextural types. Cokes C and D were pilot oven cokes prepared from high and low rank coals respectively. The fused component of Coke C consisted of coarse lenticular and ribbon microtextural types, and Coke D, medium-coarse circular microtextural types. A summary of the coke proximate and partial ash analyses are presented in Table 1.
Table 1. Proximate and partial ash analyses of coke samples.
| Coke A | Coke C | Coke D |
|---|
| Moisture content, % (ad) | 0.4 | 0.5 | 0.9 |
| Volatile matter, % (db) | 1.4 | 1.5 | 0.3 |
| Ash, % (db) | 12.0 | 12.1 | 11.9 |
| CSR, % | 70.2 | 62.7 | 31.9 |
| CRI, % | 20.7 | 24.6 | 46.7 |
| Partial Ash Analysis, wt% |
| SiO2 | 57.1 | 55.1 | 51.4 |
| Al2O3 | 29.8 | 25.7 | 23.1 |
| Fe2O3 | 4.7 | 9.2 | 14.3 |
| CaO | 1.9 | 3.2 | 3.7 |
| MgO | 0.7 | 0.6 | 0.8 |
| Na2O | 0.4 | 0.5 | 0.4 |
| K2O | 0.9 | 0.1 | 1.4 |
| TiO2 | 1.5 | 2.3 | 1.1 |
| P2O5 | 0.8 | 1.6 | 1.7 |
| Base/Acid* | 0.097 | 0.164 | 0.272 |
| SiO2/Al2O3 | 1.92 | 2.14 | 2.23 |
* Base/Acid=[Fe
2O
3+CaO+MgO+Na
2O+K
2O]/[SiO
2+Al
2O
3+TiO
2]
200 g of coke with a particle size of +19–21 mm was heat-treated in a graphite furnace (Fig. 1) for 2 hours at temperatures of 1673, 1873, 2073, and 2273 K. The heating rate to the nominated treatment temperature was fixed at 25 K/min. The samples were contained in a graphite crucible, into which 1 L/min of nitrogen (99.99%) was continuously blown through a graphite ducting tube attached to the bottom of the crucible. Heat treatment time was counted from the time when the furnace temperature reached the designated value until cooling commenced.

Temperature profile of annealing and gas composition-temperature profile of gasification are shown in Fig. 2. Coke annealing was conducted under the 100 vol.% N2 atmosphere, while coke gasification was conducted in the CO–CO2 with balance N2 gas mixture varied with temperature according to the atmosphere in the different regions of the blast furnace. The original coke sample prior to any heat treatment was labelled as Coke 1; while the other four coke samples, after annealing at different temperatures from 1673 to 2273 K, were labelled sequentially as Coke 2 to Coke 5, respectively.
2.2.2. Gasification
200 g sample of coke, contained in a silicon carbide reaction vessel, was reacted under conditions simulating the blast furnace gas composition-temperature profile from 1173 to 1673 K. The schematic diagram of furnace for gasification is shown in Fig. 3. The gas composition-temperature profile was based on a vertical probing of the Hoogoven blast furnace reported by Van der Velden et al.12) In the current experiments, water and hydrogen were excluded from the gas atmosphere and the total gas flow rate was fixed at 5 L/min. The temperature interval between 1173 and 1273 K corresponded to the coke passage through the furnace thermal reserve zone, and from 1373 to 1673 K approximated to its passage through the cohesive or softening-melting zone. Samples were heated from room temperature to 1173 K in 100 vol.% N2 atmosphere, then the CO–CO2–N2 gas mixture was introduced into reactor to start the gasification. As shown in Fig. 2, gasification started at 1173 K and stopped once temperature reached 1273 K (Coke 6), 1473 K (Coke 7) and 1673 K (Coke 8). For Coke 9, the gasification was again followed to 1673 K and then the sample was held at this final condition for 2 additional hours. Coke samples were quenched under N2 after the gasification reaction.

200 g coke sample reacted under the conditions for Coke 9 was subsequently annealed in the graphite furnace at 1873 and 2273 K for 2 hours. The heating rate to the nominated treatment temperature was fixed at 25 K/min. Cokes after gasification and subsequent annealing at 1873 and 2273 K were labelled as Coke 10 and Coke 11, respectively. The gasification with subsequent annealing of coke simulated the condition of coke passage from the top to the lower zone of BF.
2.3. X-ray Diffraction
X-ray diffraction (XRD) was used to determine the coke graphitisation degree, which was characterized by the crystallite size, Lc, or stack height, calculated using the Scherrer equation.13) XRD spectra of powdered samples were obtained using a Philips X’Pert Multipurpose X-ray Diffraction System (MPD). Copper Kα radiation (45 kV, 40 mA and 1.5409 Å wavelength) was used as the X-ray source. Samples were scanned in the range of 2θ from 10 to 50° with a step size of 0.02° and 0.6 s scanning time at each step.
2.4. Macrostrength of Metallurgical Cokes
2.4.1. Tensile Strength
Cylindrical cores of 8 mm diameter were drilled from coke lumps. Samples for tensile testing were cut from the cylindrical cores to 7–8 mm length. The tensile strength of the coke was determined by measuring 50 air-dried core samples on an Instron 1185 screw universal testing machine with 5 kN load cell. The rate of load application was standardized at a machine crosshead speed of 0.5 mm/min. The load was applied along the diameter direction until fracture occurred as a result of tensile stress developed perpendicular to the applied load. The tensile strength was calculated from the applied load at breakage and the dimensions of the cylinder sample.14,15)
2.4.2. I-drum Tumbling Strength
I-drum tumbling strength of cokes after reaction under the simulated blast furnace conditions were evaluated using the procedure derived from the standard CSR test (Australian Standard 1038.13–1990). A sub-sample of the treated coke (150 ± 2.5 g) was tumbled in an I-drum tumbler rotated at 20 revolutions/min for 30 minutes (600 revolutions). The tumbled sample was sieved over a 10 mm perforated plate laboratory sieve (200 mm diameter); the percentage of +10 mm of the original samples was reported as the strength after reaction and noted as I*600.
2.5. Microstrength of Metallurgical Cokes
The microstrength of cokes was measured using a UMIS2000 ultra micro indentation system. Indentation was made on the polished surface of resin-mounted samples. IMDC and RMDC were identified under the optical microscope (×400) attached to the UMIS unit based on their microtexture. Measurements were carried out on both IMDC and RMDC.
2.5.1. Hardness and Young’s Modulus
Hardness, H, and Young’s modulus, E, were determined from the loading-unloading curve, obtained in the micro-indentation tests with a Berkovich indenter by increasing applied load to 100 mN and measuring the depth of penetration of the diamond indenter. Ten measurements for each type of coke microtexture were carried out across several sample lumps. The hardness and Young’s modulus were calculated according to the method developed by Oliver and Pharr.16)
2.5.2. Fracture Toughness
Previous indentation studies of metallurgical cokes showed that the use of this indenter resulted in a deformation with no residual indenter impress after full unload, and crack formation.10,17) Therefore in tests to determine the fracture toughness, a sharper cube corner indenter was used to produce a residual impression and measurable radial cracks. The fracture toughness was determined from measurements of the crack length of the residual impression formed after indentation using the optical microscope (×400) attached to the UMIS unit. Fracture toughness of coke IMDC and RMDC microtextures was determined using 200 mN load, with a cubic corner indenter. Measurements of crack lengths of residual impression after full unload were taken at 10 different locations. The fracture toughness K1c was calculated using experimental hardness, Young’s modulus, length of cracks, and geometry of the applied indenter.18)
2.6. Porosity Analysis of Metallurgical Cokes
Porosity of cokes subjected to reaction under the simulated blast furnace conditions was determined using Image analysis. A representative analysis of each coke was based on 30 images of samples which were mounted in epoxy resin blocks. Care was taken to achieve a well-polished surface and avoid damage of coke pore wall during polishing using fine grinding paper. Images were captured by a Nikon Model EPIPHOT 600 microscope under a low power objective lens (magnification ×5) with Nikon digital camera. The captured images were binarised using software ImageJ developed by NIH. After binarisation, the pores and walls of cokes were represented by black and white areas respectively. The porosity of carbonaceous materials was calculated as the fraction of black area using ImageJ software.
3. Results and Discussion
3.1. Reactions of Cokes during Annealing and Gasification
A series of reactions took place when the coke samples were treated at high temperatures either in nitrogen or in a simulated blast furnace gas atmosphere which resulted in weight loss of the samples. The weight loss of coke samples after annealing and gasification to different stages is shown in Fig. 4. The average of relative standard deviation (RSD) for weight loss measurements was 0.03. The weight loss of all the cokes subjected to annealing and/or gasification increased with increasing treatment temperature. During gasification, the weight loss of Cokes C and D was more significant than that of Coke A, which indicated that Cokes C and D had high reactivity than Coke A. The weight loss of cokes during annealing in a nitrogen atmosphere resulted from moisture and volatile matter (proximate) losses, further devolatilisation at high temperatures, and reduction of minerals (mainly quartz and aluminosilicates) by encapsulating coke carbon.

During the gasification process when CO2 was present in the gas phase, the solution loss reaction made a significant contribution to the weight loss; besides the Boudouard reaction, release of moisture and volatile matter, and the mineral reactions (mainly quartz) at temperatures below 1673 K also contributed the weight loss.
From Fig. 4, the weight losses of Cokes A and C after gasification to 1273 K (Coke 6) were 0.8 and 2.3%, respectively, which were equivalent or lower than the sums of their individual moisture and volatile matter (proximate), which means that the solution loss reaction was insignificant at this stage. Coke D had a higher weight loss (3.2%) than that of A and C, although its sum of moisture and volatile matter was smaller. This higher weight loss for Coke D remained for other gasified samples, indicating that Coke D was more reactive to CO2. After gasification to 1673 K, the weight loss of Coke 8 was higher in comparison with annealed samples at the same temperature (Coke 2). When the treatment process was extended for an extra 2 hours at the same temperature without CO2 provided in the gas phase (Coke 9), the weight loss increased further, especially for Coke D, showing that most of weight loss at high temperatures was caused by carbothermal reduction of the metal oxides in the mineral matter (mainly quartz and aluminosilicates) of coke.
Increasing the annealing temperature from 1673 K (Coke 2) to 2273 K (Coke 5) brought about an increase in the weight loss of 8–11% for all three cokes. This significant increase is related to the removal of hydrogen and small fragments of organic species accompanied by graphitisation of coke (Section 3.2), as well as reduction of mineral matter. Carbothermal reduction of SiO2 to SiO and SiC significantly contributed to the weight loss at high temperatures;9) the reaction of other minerals with low content, such as Fe bearing minerals, also made contribution to the weight loss during annealing.19)
3.2. Graphitisation of Cokes
The change of graphitisation degree of cokes, represented by the crystallite size Lc, under simulated blast furnace conditions is shown in Fig. 5. The crystallite size of all three cokes increased with increasing annealing temperature in the temperature range of 1673–2273 K. However, the effect of annealing on the graphitisation of Coke D was significantly lower compared with Cokes A and C. The crystallite size of the three cokes before heat treatment was within the range of 18–21 Å, but after annealing under N2 at 2273 K the crystallite size of Coke D was approximately 30% lower than of Coke A and 40% lower than of Coke C.

Gasification of samples up to 1673 K affected graphitisation of cokes to a smaller extent as a consequence of the relatively low gasification temperature. A slightly higher Lc for Coke 9 compared to Coke 8 was attributed to the extended heating time at 1673 K. Gasification with subsequent annealing at 1873 and 2273 K (Cokes 10 and 11) had a similar effect on coke graphitisation as annealing without gasification at the same temperatures. Therefore, heating temperature and time are two key factors affecting the degree of graphitisation in addition to the coke properties.
3.3. Microstrength of Cokes
The fracture toughness of the original coke samples and samples after annealing and gasification is presented in Fig. 6. The average of relative standard deviation (RSD) for fracture toughness measurements was 0.19. The fracture toughness of Coke C was reported only for IMDC as the RMDC was dominated by coarse mosaic and foliate microtexture, where the crack length of the residual impression after micro-indentation was difficult to measure.

Fracture toughness of IMDC in the original cokes was in the range of 1.5 to 1.6 MPa·m1/2, Fracture toughness of RMDC of cokes before annealing was approximately 6% lower than that of IMDC. Annealing in the temperature range of 1673–2273 K caused significant degradation of the fracture toughness for all three cokes. After annealing at 2273 K, fracture toughness of the IMDC of Coke C decreased to 0.9 MPa·m1/2, which was 14% lower than that of Cokes A and D. Fracture toughness of RMDC of Cokes A and D before annealing was similar at approximately 1.4 MPa·m1/2; however, the effect of annealing on the deterioration of RMDC of Coke A was more severe than on the RMDC of Coke D. After annealing at 2273 K, the fracture toughness of RMDC of Coke A was 0.7 MPa·m1/2, which was 24% lower than that of the RMDC of Coke D annealed at the same temperature (0.9 MPa·m1/2). This is related to the development of graphitisation of Coke A which was more pronounced than that of Coke D upon annealing. The coke matrix becomes weaker with an increase of its graphitisation as the carbon structure transforms from cross-linked non-graphitic carbon to parallel orientated graphite layers; hence, the resistance to fracture decreases during this process.20,21,22) The effect of gasification on microstrength of cokes was limited compared with the annealing. It can be attributed to a smaller degree of graphitisation of cokes during gasification at relatively low temperatures (Fig. 5). The microstrength of cokes after gasification followed by annealing was close to that of cokes subjected only to annealing at the same temperatures, which was also related to similar graphitisation degree of the samples.
3.4. Macrostrength of Cokes
3.4.1. Tensile Strength
The tensile strengths of original cokes and cokes after annealing, gasification and gasification with subsequent annealing are presented in Fig. 7. The average of relative standard deviation (RSD) for tensile strength measurements was 0.29. Among the three coke samples, Coke A had the highest tensile strength of 7.71 MPa, while for Cokes C and D the measured values were 4.62 and 5.49 MPa, respectively. For all three cokes, the tensile strength decreased with increasing annealing temperature; 38% decrease in the tensile strength was observed for Cokes A and C on annealing at 2273 K and a smaller, 12%, decrease in the case of Coke D. This smaller decrease in the tensile strength of Coke D matches a smaller increase in the graphitisation degree of the same coke in the annealing.

Gasification negatively affected the tensile strength of cokes, which, apart from Coke A, decreased with increasing gasification temperature. The tensile strength of Coke A decreased by about 8% after gasification upon heating to 1273 K, and then changed only marginally with further increase in the gasification temperature. Gasification temperature had a stronger effect on the tensile strength of Coke D than annealing, which was opposite to the case of Cokes A and C. The tensile strength of Coke D after gasification at 1673 K (Cokes 8 and 9) was lower than after annealing at 2273 K. Gasification at 1673 K caused larger degradation than annealing at the same temperature for all three cokes, and the effect was more significant on the more reactive coke. The tensile strength of Cokes C and D gasified at 1673 K for 2 hours was 15% lower than that after annealing at the same temperature, the difference for Coke A was only 2%.
Annealing following gasification caused more significant degradation of the tensile strength than solely gasification, or annealing. This effect of subsequent annealing was more evident for Coke A and Coke C. The tensile strength of Cokes A and C after gasification and annealing at 2273 K was 34% lower than after the sole gasification at 1673 K. The difference was only 10% for Coke D.
The tensile strength of cokes is a comprehensive indicator which is affected by many factors, including the matrix properties and defects of coke samples. The strong effect of gasification on Cokes C and D may be attributed to their high gasification reactivity in comparison to Coke A. Reduction reactions of the mineral matter in cokes during high temperature annealing brought about decrease in the solid coke volume and so weakened binding at the interface between coke carbon and the inorganic phases resulting in lowering of the tensile strength of annealed cokes. This may explain the decrease in tensile strength, in addition to the decrease of microstrength of carbon matrix due to graphitisation.
3.4.2. I-drum Tumbling Strength
I-drum tumbling strength of cokes after treatment under the simulated blast furnace conditions is shown in Fig. 8. Original Coke A had the highest I-drum tumbling strength, while I*600 of Coke C was the lowest before treatment. Annealing degraded I-drum tumbling strengths of all three cokes; however, the degradation of Cokes A and C was more significant than that of Coke D, which was consistent with the measurements of tensile strength. Gasification at 1673 K had a more notable effect on the degradation of I-drum tumbling strength than annealing at same temperature.
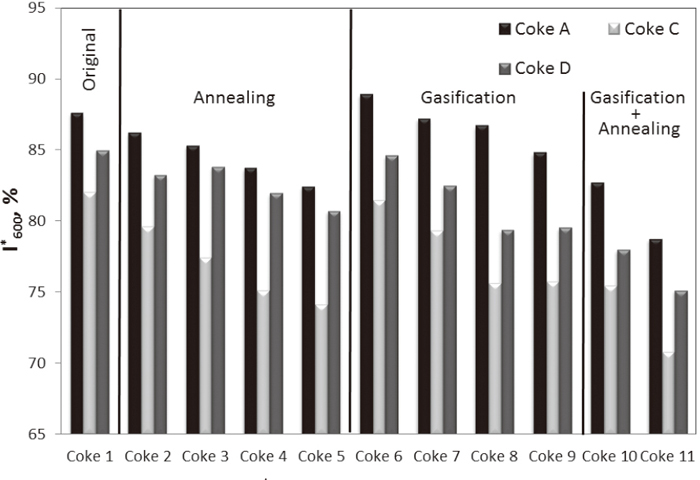
Figure 9 presents the correlation between tensile strength and results of the tumbling test of cokes after annealing (Coke 2 to 5) and gasification (Coke 6 to 9). An acceptable correlation between the tensile strength and I*600 was found in both annealing and gasification for the cokes with high reactivity (Cokes C and D). However, the correlation for Coke A with low reactivity was only good in annealing, and was poor in gasification (R2=0.16). Tensile strength and I*600 of Coke A decreased similarly upon annealing in the temperature range of 1673–2273 K. However, tensile strength of Coke A remained unchanged upon the gasification reaction, while I*600 of Coke A in this reaction degraded significantly. The poor correlation between the two parameters for Coke A reflects the difference in failure mechanisms of the two measuring methods.

Preparation of samples for measuring of tensile strength and I-drum tumble strength was significantly different. The specimen for tensile testing was drilled from the coke lumps. In effect, the samples were derived from the “core” of the coke lumps, with lump peripheral regions being discarded. The coke samples for the I-drum tumbler testing were whole lumps presented in an as-processed condition. The size reduction in tumbling is caused by impact induced failure on particles collision with the walls/end-plates of the I-drum and abrasion of the coke lumps in the process of relative motion. Abrasion related size reduction is strongly correlated with the peripheral strength of the coke particles. Pore structure development during annealing shown for Coke A in Fig. 10 (the black area represented the coke pores and the white area represented the coke matrix) took place through the entire piece of coke; the porosity of original Coke A was 51%; the porosity of the core and periphery of Coke A after annealing at 2273 K were 59 and 56% respectively. Therefore, both tensile strength and I*600 of Coke A decreased in the same manner.

In the gasification process, the degradation of Coke A caused by reaction was predominantly developed on the periphery of the lump, and the degree of reaction decreased toward the centre of the lump; the core of the coke lump was much less affected by the solution loss reaction (Fig. 11). The porosity of core and periphery of Coke A after gasification at 1673K for 2 hours were 56 and 66%, respectively. As a result of difference in degradation of the coke’s core and periphery, the decrease of tensile strength of Coke A during gasification reaction was not as significant as the decrease of its I*600. However, the solution loss reaction took place through the entire piece of the coke with high reactivity, such as Coke D. The images of core and periphery of Coke D after gasification at 1673 K for 2 hours are shown in Fig. 12. The porosity of Coke D before treatment was 58%. Similar degree of the gasification reaction was observed at the core and periphery in Coke D, and the porosity of core and periphery after gasification were 64% and 68%, respectively. As a result, the tensile strength and I-drum tumbling strength of coke with high reactivity in gasification decreased in a similar manner.

The degradation of coke is directly related to the extent of reaction caused by the solution loss reaction.23) The solution loss reaction of coke under the BF-simulated conditions occurred predominantly on the periphery of a low reactive coke and took place through the entire lump of coke with high reactivity. A good correlation between weight loss and I*600, which characterizes the peripheral strength of all three cokes is seen in Fig. 13(a); however, the correlation between the weight loss and tensile strength (core strength), was only good for cokes with high reactivity (as shown in Fig. 13(b)).
4. Conclusions
The degradation of cokes over a wide range of fused component microtextures was studied under simulated blast furnace conditions. The examined coke treatment conditions include gasification with simulated blast furnace gas composition-temperature profiles to 1673 K; annealing under N2 to 2273 K; and gasification with subsequent annealing at 1873 and 2273 K. The major findings can be summarised as follows:
(1) The coke strength depends on its microstrength and pore structure. Change in the coke microstrength upon annealing is related to the coke graphitisation, while development of the pore structure depends on the coke reactivity in both gasification and annealing processes.
(2) Both gasification and annealing decreased the mechanical strength of coke. Compared with annealing at 1673 K, gasification at the same temperature caused larger degradation of all three cokes, and the effect was more significant on the more reactive coke. The tensile strength of the low-reactive Coke A gasified at 1673 K was 2% lower than that after annealing at the same temperature; the difference between tensile strength after gasification and annealing at 1673 K for Cokes C and D which have higher reactivity, was approximately 15%.
(3) The coke degradation during annealing occurred through the entire piece of coke. During gasification of coke with high reactivity under the BF conditions, degradation also took place through the whole piece; however, the degradation of coke with low reactivity was more severe on the periphery than that in the core.
(4) Microstrength of coke decreased significantly with increasing annealing temperature as a result of coke graphitisation which increased with increasing temperature. The change of microstrength of coke upon gasification, which occurred at relatively low temperatures, was marginal. The cokes after gasification with subsequent annealing had similar microstrength and graphitisation compared to those subjected only to annealing at the same temperature.
(5) A low-reactive Coke A demonstrated superior mechanical properties in comparison with Cokes C and D under the simulated BF conditions.
Acknowledgments
This project was supported by BlueScope Steel, BHP Billiton and Australian Research Council (ARC Linkage Project LP130100701).
References
- 1) A. Babich, D. Senk and H. Gudenau: Ironmaking Steelmaking, 36 (2009), 222.
- 2) M. Lundgren, L. Sundqvist Ökvist and B. Björkman: Steel Res. Int., 80 (2009), 396.
- 3) T. Hilding, S. Gupta, V. Sahajwalla, B. Bjoerkman and J. O. Wikstrom: ISIJ Int., 45 (2005), 1041.
- 4) S. S. Gornostayev and J. J. Härkki: Energy Fuels, 20 (2006), 2632.
- 5) K. Yamaguchi, T. Uno, T. Yamamoto, H. Ueno, N. Kon-No and S. Matsuzaki: Tetsu-to-Hagané, 82 (1996), 641.
- 6) M. G. K. Grant, A. C. D. Chaklader and J. T. Price: Fuel, 70 (1991), 181.
- 7) H. Echterhoff: Stahl Eisen, 81 (1961), 992.
- 8) K. Bradshaw and H. C. Wilkinson: J. Inst. Fuel, 42 (1969), 112.
- 9) X. Xing, G. Zhang, M. Dell’Amico, G. Ciezki, Q. Meng and O. Ostrovski: Metall. Mater. Trans. B, 44 (2013), 862.
- 10) X. Xing, G. Zhang, M. Dell’Amico, G. Ciezki, Q. Meng and O. Ostrovski: Metall. Mater. Trans. B, 44 (2013), 870.
- 11) J. W. Patrick and H. C. Wilkinson: Ironmaking Conf. Proc., Vol. 42, ISS-AIME, Warrendale, PA, (1983), 333.
- 12) B. Van der Velden, J. Trouw, R. Chaigneau and J. Van den Berg: Proc. 58th Ironmaking Conf., ISS-AIME, Warrendale, PA, (1999), 275.
- 13) T. F. Yen, J. G. Erdman and S. S. Pollack: Anal. Chem., 33 (1961), 1587.
- 14) J. W. Patrick and A. E. Stacey: Fuel, 51 (1972), 81.
- 15) J. W. Patrick, A. E. Stacey and H. C. Wilkinson: Fuel, 51 (1972), 174.
- 16) W. C. Oliver and G. M. Pharr: J. Mater. Res., 7 (1992), 1564.
- 17) N. Andriopoulos, C. E. Loo, R. Dukino and S. J. McGuire: ISIJ Int., 43 (2003), 1528.
- 18) A. C. Fischer-Cripps: The IBIS Handbook of Nanoindentation, Fischer-Cripps Laboratories Pty Ltd., Forestville, (2009), 44.
- 19) Z. Ye, S. Gupta, O. Kerkkonen, R. Kanniala and V. Sahajwalla: ISIJ Int., 53 (2013), 181.
- 20) R. E. Franklin: Proc. Roy. Soc. Lond. A, 209 (1951), 196.
- 21) H. Sato, J. W. Patrick and A. Walker: Fuel, 77 (1998), 1203.
- 22) X. Xing, G. Zhang, H. Rogers, P. Zulli and O. Ostrovski: Metall. Mater. Trans. B, 45 (2014), 106.
- 23) S. Nomura, M. Naito and K. Yamaguchi: ISIJ Int., 47 (2007), 831.


