Regular Article
Effect of {110}<229> and {110}<112> Grains on Texture Evolution during Cold Rolling and Annealing of Electrical Steel
2016 Volume 56 Issue 8 Pages 1462-1469

Details
2016 Volume 56 Issue 8 Pages 1462-1469
In this study, the electrical steel samples containing different-sized {110}<229> and {110}<112> oriented grains are cold rolled and annealed to investigate the effect of these grains on deformation and recrystallization texture evolution, and the origins and evolution of {110}<229> and {110}<112> grains in recrystallized samples are paid special attention. After rolling, initial {110}<229> and {110}<112> grains lead to γ-fiber deformation texture and γ-fiber as well as {112}<110> deformation textures respectively, and the crystal rotations show combined effects of initial orientation, surface shear and surrounding matrix. After annealing, in the case of large initial grains, preferred {hk0}<001> nucleation occurs in initial {110}<229> grains and lead to {hk0}<001> recrystallization texture accordingly. Compared to initial {110}<001> grains, the lower intensity of {hk0}<001> texture, spreading to cube component, is attributed to the deviation of deformed orientation from {111}<112>. In contrast, coarse recrystallized microstructure and weak recrystallization texture are obtained in initial {110}<112> grains. Similarly, small {110}<229>-<112> grains in annealed hot bands also contribute to {hk0}<001> recrystallization texture, meanwhile {112}<110> deformed matrix induced by initial {110}<112> grains affect texture and microstructure evolution. With respect to {110}<229> and {110}<112> grains in recrystallized samples, the majority of them nucleate in α-fiber deformed matrix, and larger size than {110}<001> recrystallized grains is illustrated.
Electrical steel is a soft magnetic material widely used for generators, motors as well as transformers, and high permeability and low core loss by texture and microstruture optimization are essential for electrical steel production.1,2) In general, hot rolling, cold rolling and annealing processes are carried out for electrical steel production, and the texture prior to cold rolling exerts significant effect on subsequent texture evolution.3) As main shear texture components, {110}<001> (Goss), {110}<229> and {110}<112> (brass) regions are greatly observed after hot rolling and normalization annealing. However, unlike Goss grains, the deformation and recrystallization behaviors of {110}<229> and {110}<112> grains as well as the microstructure and texture evolution related to them has not been clarified yet.
In general, for high permeability grain-oriented electrical steels using both high temperature and low temperature slab heating processes, one-stage cold rolling method is carried out.4,5) For the latter one, strong α*-fiber primary recrystallization texture greatly affect the texture evolution during final annealing, which will be discussed in the authors’ other work. Abnormal growth of {110}<229> and {110}<112> primary recrystallized grains may take place in both kinds of high permeability grain-oriented electrical steel, thus reducing the intensity of Goss texture and magnetic induction in final products.4,6,7) To control the growth competition between {110}<229>-{110}<112> grains and Goss grains during secondary recrystallization is essential for magnetic induction optimization, which needs to understand these grains’ origin and distribution in primary recrystallized samples.4,5,6,7,8) Goss grains after primary recrystallization due to retention or nucleating in shear bands are widely reported,9,10) while the origins of {110}<229> and {110}<112> grains are not clear. The earlier work of the authors’ group suggests that {110}<112> grains in primary recrystallized sample may be related to {110}<112> regions in hot bands, while the process from initial {110}<112> regions to {110}<112> new grains nucleating after rolling and annealing is not clarified. In other words, the statement is not well proved.8)
This study aims to clarify the effect of {110}<229> and {110}<112> grains on texture and microstructure evolution in electrical steels by investigating the deformation and recrystallization behaviors of these grains. Meanwhile, the origins and distribution of {110}<229> and {110}<112> grains in the recrystallized samples are analyzed with emphasis, and the relationship between them and preexisting {110}<229> and {110}<112> regions prior to cold rolling is discussed. Besides, this study provides information for thin-slab electrical steel production using grain-oriented electrical steel final product as starting material.11)
The starting materials were obtained from different stages of a high permeability grain-oriented electrical steel production, and the steel contained ~3.1 wt.% Si. On one hand, several samples were cut from 0.23 mm final products along different directions, and the long direction of each sample is set to be its new rolling direction (RD) (see Fig. 1). Given that Goss secondary grains were displayed in final products, Goss, {110}<229> and {110}<112> large grains were achieved in sample A–C respectively. The sheets were polished and etched, and large grains were measured by EBSD and marked. The orientations of measured large grains were depicted in Fig. 1. Afterwards, samples A–C were subjected to cold rolling of 80% reduction and subsequent annealing at 700°C for 3–10 min. The deformation and recrystallization behaviors of {110}<229> as well as {110}<112> large grains were traced, meanwhile the behaviors of Goss grains were studied for comparison. The investigation on large initial grains can help clarifying the dependence of deformation and recrystallization behaviors on initial orientation. On the other hand, 2.3 mm annealed hot bands were also cold rolled to 80% reduction, followed by annealing at 700°C for 1–2 min. In addition, rolling to 20% and 60% reductions were carried out to help tracing the change of specific orientations during deformation.

Initial samples (A, B, C) and {200} PFs of large grains in samples A–C.
Texture and microstructure evolution is analyzed by EBSD. To obtain statistical information, all the marked initial large grains in each sample are measured and traced, and typical data are given in this paper. In particular, for deformed and fully recrystallized large-grained samples, a large quantity of regions are measured and assembled to an area of ~0.046 mm (the thickness)*100 mm to provide macro-texture informations. Unlike the maximum deviation of 15° for other orientations, the tolerance of initial three orientations was 7.5° to avoid orientation overlap. Moreover, based on Sachs and VPSC models, crystal rotations of Goss, {110}<229> and {110}<112> initial orientations were calculated to help understanding the orientation evolution during rolling deformation.
Figure 2 shows the deformation and recrystallization textures of large initial Goss, {110}<229> and {110}<112> grains. Similar to initial Goss grains, γ-fiber deformation texture and {hk0}<001> recrystallization texture are achieved in the case of initial {110}<229> grains. However, compared to initial Goss grains, the deformation texture displays deviation from {111}<112> component (Fig. 2(a)), showing the transition towards {111}<110> and {113}<361> components, and the intensity of {hk0}<001> texture in Fig. 2(b) is lower. For initial {110}<112> grains, distinct texture evolution is displayed, namely the deformation textures consisting of {112}<110> and γ-fiber (with the peak near {111}<110> component) components in Fig. 2(a), and weak recrystallization texture in Figs. 2(b)–2(c).

Textures of initial Goss, {110}<229> and {110}<112> large grains. (a) deformation textures, φ2=45° section of ODF, 80% reduction; recrystallization textures, φ2=0° (b) and φ2=45° (c) sections of ODF, annealed at 700°C for 10 min.
As shown in Fig. 3, for initial Goss and {110}<229> grains, bi-directional crystal rotations towards γ-fiber orientation happen simultaneously, and γ-fiber deformed orientation deviates from {111}<112> in initial {110}<229> grains, which is consistent with the results in Fig. 2. Meanwhile, the orientation scattering from γ-fiber to {113}<361> is illustrated, especially in initial {110}<229> grain (Figs. 3(c)–3(d)). The orientation scattering from γ-fiber is also reported in previous study of the authors’ team.12) It may be related to the shear by surface friction, which causes the strain state deviating from plane strain and changes the crystal rotation route,13,14) and the surface effect in ultra-thin samples can not be ignored. Besides, a quantity of {210}<001> areas are observed, with the majority of which aligning in specific direction and showing high-angle boundaries with adjacent regions. {hk0}<001> oriented shear bands in γ-fiber deformed matrix are generally reported.9,15) In this case of ultra thin samples, although shear bands are not directly observed, the crystal rotation along specific direction in specific matrix is determined in the same way.15,16) Regarding initial {110}<112> grains, the microstructure is divided into two types of regions, with the deformed orientations of {112}<110> and {111}<110> (Figs. 3(e)–3(f)). In {112}<110> oriented matrix, {113}<361> regions are also observed (at the arrows). Moreover, {100} regions are obtained at the induced boundaries (in the rectangle), which should be due to the effect of additional shear.

Deformation behaviors of initial Goss, {110}<229> and {110}<112> large grains. (a) orientation image map of initial Goss grain, (b) {200} PF of (a); (c) orientation image map of initial {110}<229> grain, (d) {200} PF of (c), (e) orientation image map of initial {110}<112> grain, (f) {200} PF of (e). (Online version in color.)
To clarify the crystal rotations during deformation, Sachs and VPSC models are used to calculate the changes of 0°, 15° and 30° Goss orientations under different conditions.17) As shown in Fig. 4, for {110}<229> and Goss orientations, the rotation routes by different models are similar in the early stage while differ in the late stage, and the routes by VPSC model are closer to the experimental results, namely obtaining near {111}<112> textures. In contrast, two distinct rotation routes are displayed in {110}<112> grain from the beginning under different models, leading to γ-fiber (between {111}<112> and {111}<110> component) or {112}<110> end orientations, and {113}<361> orientation is shown before reaching {112}<110> orientation under Sachs model. This explains the orientation split in Figs. 3(e)–3(f). When shear is taken into consideration, crystal rotation routes change. {110}<229> rotates to near {113}<361> orientation under VPSC model. More precisely, the end orientation is in coincidence with the component between {111}<112> and {113}<361> in Fig. 3(d) (red polygons), indicating that the transition from {111}<112> to {113}<361> is connected to surface shear, which can’t be neglected in thin slab. Similarly, in the case of {110}<112> orientation under VPSC model, the existence of shear causes the rotation route deviating from γ-fiber. Under Sachs model, although there is difference for not considering the strain incompatibility with neighboring region near boundaries, the simulated result shows the rotation trend towards {001}-fiber orientation, which is similar to the case in the square in Fig. 3(e). To sum up, the comparisons between calculated and experimental results indicate that the crystal rotations during rolling deformation show the combined effects of initial orientation, surface shear and neighboring grains.

Crystal rotation of 0°, 15° and 30° Goss orientations calculated by different models and conditions: (a) Sachs model, no shear; (b) VPSC model, no shear; (c) Sachs model, with σ13 (0.4σ11); (d) VPSC model, with ε13 (0.4ε11). (Online version in color.)
After annealing, the nucleation behaviors, including nucleation sites and nucleation orientations, are affected by deformed orientations to large extent. As shown in Figs. 5(a)–5(d), preferred {hk0}<001> nucleation occurs in the cases of initial Goss and {110}<229> grains and result in {hk0}<001> recrystallization textures accordingly in Figs. 6(a), 6(b), 6(d) and 6(e). Although much nucleation occurs at the sample surface or at the boundary, where shows different crystal rotation during deformation induced by shear, the majority of new grains are {hk0}<001> oriented, which is related to shear bands. Compared to initial Goss grain, the lower {hk0}<001> texture intensity after fully recrystallization is observed in the case of initial {110}<229> grains in Fig. 6(e). This phenomenon shows the effect of deformation matrix’s orientation deviation from exact {111}<112>, in which the density of shear bands decreases.9) Moreover, with the γ-fiber orientation of deformed matrix deviating from {111}<112>, {hk0}<001> nuclei spreads towards cube component.15) For initial {110}<112> grains, near {112}<110> and {111}<110> deformed microstructures contribute to fewer nucleation sites and coarse new grains. In {112}<110> deformed region in Fig. 5(f), new grains with {110}<229>, {110}<112>, γ-fiber and {001}<120> orientations are observed, while no obvious nucleation superiority is shown. Regarding γ-fiber deformed matrix, a larger region is given in Fig. 5(g) to provide more comprehensive information. {100}-{210}<001> new grains occupy about half of recrystallized areas, and {111}<112> new grains are observed as well. When annealing time is prolonged, coarse recrystallized microstructure with low texture intensity is obtained in Figs. 6(c) and 6(f), implying stronger effect of {112}<110> matrix on recrystallization process. This may be related to higher fraction of {112}<110> deformed regions due to coarse initial grains.

Orientation image maps and {200} pole figures in partially recrystallized samples of initial Goss, {110}<229> and {110}<112> large grains. (a)–(b) initial Goss grains, annealed at 700°C for 3 min; (c)–(d) initial {110}<229> grains, annealed at 700°C for 3 min; (e)–(g) initial {110}<112> grains, annealed at 700°C for 6 min. (Online version in color.)

Orientation image maps and {200} pole figures in fully recrystallized samples of initial Goss, {110}<229> and {110}<112> large grains, annealed at 700°C for 10 min. orientation image map of initial Goss(a), {110}<229>(b), and {110}<112>(c) grains; {200} PFs of initial Goss(d), {110}<229>(e), and {110}<112>(f) grains. (Online version in color.)
There is one more aspect worthy to be noted. Though {113}<361> deformed regions are obtained in all the studied samples, {113}<361> nucleation is not significant in each case. This result may be attributed to low orientation gradient at {113}<361> regions and superiority of other nuclei, thus no texture is obtained accordingly.
3.2. Effect of Initial {110}<229> and {110}<112> Grains in Annealed Hot Bands on Cold Rolling and Annealing Texture EvolutionStrong {110}<001>-<112> shear texture components are obtained in the annealed hot band of grain-oriented electrical steel in Figs. 7(a)–7(b). After analyzing the microstructure and texture evolution of large {110}<229> and {110}<112> grains systematically, the behaviors of {110}<229> and {110}<112> grains in annealed hot bands will be discussed, which represent the actual situation in electrical steel production. The size of these initial grains is lower than 200 μm, and it is difficult to locate and trace specific grains during rolling. Then, the deformation behaviors of these {110}<229> and {110}<112> grains are analyzed by measuring deformation stages under different rolling reductions. After being rolled to 20% reduction, similar to the retention of Goss orientation, the retention of {110}<229> and {110}<112> orientations is illustrated in Fig. 7(c). {200} PFs of two typical deformed grains are given in Fig. 7(d), showing slight orientation change at this strain. With the rolling reduction increasing to 60%, the retention of each {110} orientation decreases significantly (Fig. 7(e)). In other words, most of them have transformed to other orientations. Owing to the decrease of initial grain size, compared with large initial grains, it is assumed that the crystal rotation in this case would be closer to the simulated results by VPSC model, such as the orientation rotation from {110}<229> towards {111}<112> orientation (grain E) and from {110}<112> to γ-fiber orientations (grain D, between {111}<112> and {111}<110> components). However, it needs to note that for grain C, the orientation change from {110}<112> to {112}<110>, which is assumed to occur in single crystal, is also observed. When the rolling reduction increases to 80%, no obvious retention of the studied orientations can be observed in Fig. 7(g). On the basis of the experimental results at 60% reduction, the further rotation to γ-fiber orientation in initial {110}<229> grains, to γ-fiber or {112}<110> orientation in initial {110}<112> grains can be deduced. These deformed orientations contribute to α-fiber and γ-fiber deformation textures in Fig. 7(h). The result is similar to that in large-sized initial samples, though there may be difference in γ-fiber components’ distribution and in the fraction of {112}<110> deformed areas in the case of initial {110}<112> grains. {113}<361> deformation texture is not observed in Fig. 7(h), which may be attributed to the difference in sample thickness.

Deformation behaviors of initial {110}<229> and {110}<112> grains in annealed hot band. (a) orientation image map of annealed hot band; (b) φ2=45° section of ODF of the region in the rectangle in (a); (c) several selected components of deformed grains after 20% reduction in orientation image map; (d) {200} PF of grain A and grain B in (c); (e) several selected components of deformed grains after 60% reduction in orientation image map; (f) {200} PF of grain C, grain D and grain e in (e), the red ovals indicate the retained {110} orientations; (g) orientation image map after 80% reduction, without retention of {110} orientations; (h) φ2=45° section of ODF of (g). (Online version in color.)
During annealing, γ-fiber deformed microstructure is consumed during the early stage of recrystallization, while α-fiber deformed regions are retained to large extent in Fig. 8(a). After fully recrystallization, strong γ-fiber texture, which is strengthened by low initial grain size, and weak {hk0}<001> texture are displayed in Figs. 8(b)–8(d). Based on the investigation on deformation process and large-sized initial grains, {hk0}<001> oriented nucleation in γ-fiber matrix due to initial {110}<229> grains, and {hk0}<001> oriented new grains in γ-fiber regions as well as diverse oriented nuclei in α-fiber regions, which originate from initial {110}<112> grains, could be obtained. In other words, {110}<229>-<112> grains in annealed hot bands contribute to {hk0}<001> nucleation and corresponding {hk0}<001> recrystallization texture. Meanwhile, it needs to note that {hk0}<001> recrystallization texture contains {110}-{100}<001> components (Fig. 8(c)). Besides nucleation in {112}<110> deformed matrix, cube nuclei adjacent to {210}<001> new grains are observed in Figs. 8(a) and 8(b), which shows the effect of nucleation in near {111}<110> deformed matrix.15) This kind of cube nucleation has been shown in the case of initial large {110}<229> and {110}<112> grains (Fig. 5). Similarly, it is reasonable to conclude that {110}<229>-<112> grains in annealed hot bands could provide a way for cube nucleation when near {111}<110> deformed regions are obtained, as suggested by Kim et al.18)

Recrystallization behaviors of initial {110}<229> and {110}<112> grains in annealed hot band. (a) orientation image map of partially recrystallized sample, annealed at 700°C for 1 min; (b) orientation image map of fully recrystallized sample, annealed at 700°C for 2 min; (c) ODF at φ2=0° section of (b); (d) ODF at φ2=45° section of (b). (Online version in color.)
In both cases of large grains and annealed hot bands as initial materials, {110}<229>-<112> oriented recrystallized grains are observed after cold rolling and annealing in Figs. 5, 6 and 8. For grain-oriented electrical steel production, the influence of these grains on subsequent secondary recrystallization and abnormal growth of Goss grains could be great. Therefore, although the intensity of {110}<229>-<112> texture in Fig. 8(d) is not high, the evolution of these grains need to be paid special attention. In the case of large-sized initial sample, {110}<229>-<112> oriented nucleation occurs near the sample surface in {112}<110> deformed regions in Fig. 5(f). After fully recrystallization, the numbers of {110}<229> grains as well as {110}<112> grains are much higher in Fig. 6(c). This suggests that α-fiber deformed region provides major nucleation sites for {110}<229> and {110}<112> grains. Similar information is provided by Fig. 8. Several {110}<112> oriented nuclei are observed in Fig. 8(a), in {112}<110> deformed regions (regions 1–4 in Fig. 8(a)). {110}<229> new grains are divided into two groups: the ones nucleating in α-fiber deformed regions and the others whose nucleation sites could not be confirmed for being surrounded by other recrystallized grains. For the latter ones, most of them are not adjacent to Goss and {210}<001> grains, which nucleate in γ-fiber deformed grains. Therefore, it is assumed that there is low possibility that these {110}<229> grains nucleate in γ-fiber matrix. Therefore, given that the deformation texture is characterized as α-fiber and γ-fiber at this strain, the majority of both {110}<229> and {110}<112> nucleation is likely to take place in α-fiber deformed grains. The nucleation of dispersed Goss ({110}<229>) grains in α-fiber deformed matrix is also suggested by Fortunati et al.19)
For the samples prepared with annealed hot bands, according to Fig. 9(a), in the late stage of recrystallization, for Goss grains nucleating during early stage of recrystallization, the fraction of them to all new grains decreases due to increasing other nucleation. In contrast, with the replacement of α-fiber deformed grains in the late stage of recrystallization, the numbers of {110}<229> and {110}<112> nuclei increase, especially the latter ones. Figure 9(b) shows that, the size of {110}<229> and {110}<112> recrystallized grains is larger than that of Goss grains, showing the effect of lower nucleation rate and less competition in α-fiber deformed matrix.
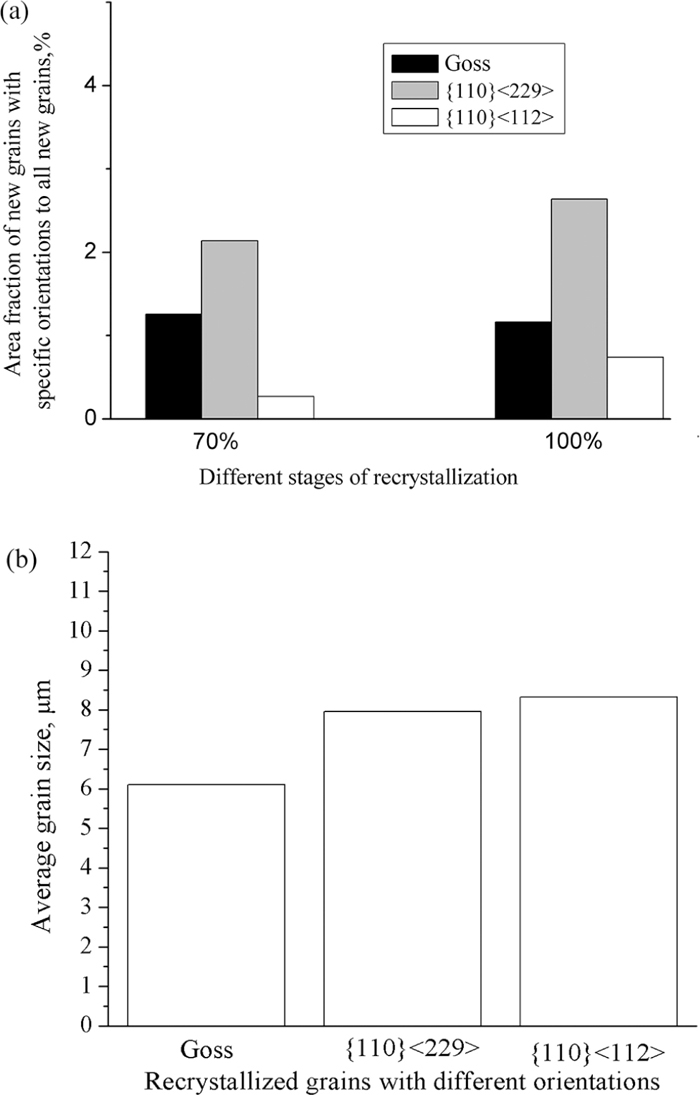
(a) Area fraction of new grains with Goss, {110}<229> and {110}<112> orientations to all new grains formed during the progress of recrystallization in the samples prepared with initial annealed hot bands; (b) Average size of Goss, {110}<229> and {110}<112> oriented recrystallized grains in the samples prepared with initial annealed hot bands.
With respect to the relationship of {110}<229> and {110}<112> grains preexisting prior to cold rolling and those after rolling and annealing, no direct correspondence can be deduced. {110}<112> initial grains may contribute to {112}<110> deformed regions, in which {110}<112> nucleation can happen. However, this presumption can not be confirmed, because {112}<110> deformed regions may have other origins. In addition, as shown in Fig. 8, {110}<229> and {110}<112> grains are observed in both near surface and central layers of the sample. Considering that initial {110}<112> grains mainly exist near surface in annealed hot bands, it is indicated that {110}<229> and {110}<112> nucleation is not limited to initial {110}<112> grains. What can be confirmed is that {110}<112> grains prior to cold rolling are beneficial for the nucleation of {110}<229> and {110}<112> new grains for providing more α-fiber deformed areas.
In this study, the electrical steel samples containing different-sized {110}<229> and {110}<112> oriented grains are cold rolled and annealed to investigate the effect of these grains on texture evolution, and the origins and evolution of {110}<229> and {110}<112> grains in recrystallized samples are paid special attention. The main results can be summarized as follows:
(1) After rolling, initial {110}<229> grains lead to γ-fiber deformation texture, and initial {110}<112> grains result in γ-fiber as well as {112}<110> deformation textures. The crystal rotations during rolling deformation show combined effects of initial orientation, surface shear and surrounding matrix, and the effect of surface shear is marked in ultra-thin samples.
(2) During annealing, in the case of large initial grains, preferred {hk0}<001> nucleation occurs and leads to {hk0}<001> recrystallization texture accordingly. Compared to initial Goss grains, the lower intensity of {hk0}<001> texture, spreading to cube component, is attributed to the deviation of deformed orientation from {111}<112>. In contrast, coarse recrystallized microstructure and weak recrystallization texture are obtained in initial {110}<112> grains, showing effect of {112}<110> deformed matrix to high extent.
(3) Similar to the behaviors of large initial grains, small {110}<229>-<112> grains in annealed hot bands contribute to {hk0}<001> recrystallization texture containing {110}-{100}<001> components, meanwhile {112}<110> deformed matrix by {110}<112> initial grains also exerts effect on texture and microstructure evolution.
(4) For {110}<229> and {110}<112> oriented recrystallized grains after rolling and annealing, the nucleation of them mainly occur in α-fiber deformed matrix, and these grains are larger than Goss recrystallized grains. There is no direct correspondence with them and {110}<229>-<112> components existing prior to cold rolling, while initial {110}<112> grains are beneficial for the nucleation of {110}<229> and {110}<112> new grains for providing more α-fiber deformed areas.
This work was supported by the project of State key laboratory for advanced metal and materials, University of Science and Technology Beijing (No. 2015z-05) and National Natural Foundation of China (No. 51571024).