Regular Article
Thermodynamics of Nitrogen Solubility and AlN Formation in Multi-Component High Mn Steel Melts
2017 Volume 57 Issue 10 Pages 1821-1830
Details
2017 Volume 57 Issue 10 Pages 1821-1830
Thermodynamics of nitrogen and AlN formation in multi-component liquid iron alloys containing Mn, Al, Si and C was investigated by the metal/gas and the metal/nitride/gas equilibration techniques under reduced nitrogen partial pressures in Ar–N2 gas mixture. The N solubility was measured in binary Fe–Mn and Fe–Si alloy melts, and ternary Fe–Mn–Si, Fe–Al–Si, Fe–Mn–C and Fe–Si–C alloy melts over wide composition range at 1773–1873 K. Using Wagner’s formalism, the effect of alloying elements on the N solubility was described as the first- and second-order interaction parameters as well as the second-order cross-product parameters. The validity of the interaction parameters determined in the present study was checked by measuring the N solubility and AlN solubility product for a typical TWIP steel composition melt of Fe-25% Mn-0.3% Si-0.6% C-Al at 1723–1873 K.
Recently, TWining Induced Plasticity (TWIP) steel has received much attention for the automotive applications because of their excellent combination of strength and ductility.1,2) TWIP steel shows the special features by the addition of various alloying elements such as Mn (15–20 mass%), Al (1–3 mass%), Si (~0.3 mass%) and C (0.4–0.6 mass%).3,4) However, such high Mn and Al concentration in steel will significantly change the physicochemical conditions of non-metallic inclusion formation during steelmaking and casting processes compared to the conventional Al-killed steels containing ~1% Mn and 0.03–0.05% Al. In particular, the addition of a large amount of Mn significantly increases the N solubility in liquid iron and decreases the solidification temperature.5) Also, a strong nitride forming element Al can form a large amount of AlN inclusions in liquid steel. AlN is considered as a detrimental phase for the hot ductility of steels.6)
In order to control the formation of AlN inclusions based on the supersaturation of N and Al in liquid alloy steels, it is necessary to have an accurate thermodynamic information for the critical solubility limit of N and AlN in such steel grades during cooling and solidification. There have been many studies on the N solubility and AlN formation in liquid iron alloys. However, most of the available data have been measured at the limited ranges of alloying concentration and temperature. In the authors’ recent studies,5,7,8) it was found that the second-order effect of alloying elements on N in liquid iron was necessary for the accurate prediction of the N solubility in high alloy steels. Also, the second-order cross-product effect on N in liquid iron significantly affected the accuracy of both N solubility and AlN solubility product in multi-component alloy systems. For example, the experimental results of the N solubility and the AlN solubility product in Fe–Al–C melt cannot be reproduced without considering the simultaneous effect of C and Al on N in liquid iron as shown in Fig. 1.8)

Equilibrium relation between [% Al] and [% N] in Fe–Al–C–N melts at 1873 K.
Therefore, in the present study, the nitrogen solubility in Fe–Mn and Fe–Si binary melts was measured at 1773–1873 K over the wide concentration range in order to precisely determine the first- and second-order effect of Mn and Si on N in liquid iron. The simultaneous effect of two different alloying elements on N in liquid iron was also determined by measuring the N solubility in Fe–Mn–Si, Fe–Al–Si, Fe–Mn–C and Fe–Si–C ternary melts. The interactions among N and alloying elements were thermodynamically analyzed in terms of the interaction parameters using the Wagner’s formalism.9) The validity of the interaction parameters determined in the present study was checked by measuring the N solubility and AlN solubility product for a typical TWIP steel composition melt of Fe-25% Mn-0.3% Si-0.6% C-Al at 1723–1873 K.
The gas-liquid metal and gas-liquid metal-nitride equilibration experiments were carried out to determine the N solubility and AlN solubility product in liquid iron alloys, respectively. Detailed descriptions of the experimental apparatus and procedure are available in the authors’ recent studies.5,8)
Five hundred grams of high purity electrolytic iron charged in an Al2O3 crucible (outer diameter (OD): 56 mm, inner diameter (ID): 50 mm, height (H): 96 mm) was melted using a 15 kW/30 kHz high-frequency induction furnace. After melting the iron, the melt temperature was directly measured by a Pt/Pt-13 mass% Rh thermocouple sheathed with an alumina tube immersed in the melt, and the Ar-10% H2 gas was blown onto the melt surface at a high flow rate of ~2 L/min to deoxidize the melt. After 2 hours of gas blowing, the oxygen content in the melt decreased to a value less than 20 mass ppm, and then the gas was switched to a mixture of N2 and Ar-10% H2 gases to keep the aimed nitrogen partial pressures. The flow rate of the gas mixture was 1 L/min.
In order to determine the effect of Mn and Si on N in liquid iron, pellets of high purity Mn (99.99% purity) or Si (99.999% purity) were added to liquid iron through an 18 mm OD quartz tube after confirming the equilibrium nitrogen solubility in liquid iron under various nitrogen partial pressures. After each addition, a new nitrogen solubility equilibrium was attained within 1 hour. This was confirmed by the sampling and in-situ analysis of nitrogen at 15 min intervals. Si and Mn additions were repeated up to 54.34 mass% and 12.53 mass%, respectively.
The simultaneous effects of two different alloying elements on N in liquid iron were determined by measuring the nitrogen solubility in Fe–Mn–Si, Fe–Al–Si, Fe–Mn–C, and Fe–Si–C melts in the temperature range from 1773 to 1873 K. After the first alloying element was added for a desired composition in the melt under a specified nitrogen partial pressure, the second alloying element was added and repeated. It was also confirmed that the new nitrogen solubility equilibrium was attained within 1 hour for the ternary liquid iron alloys.
As a verification experiment, the N solubility and AlN solubility product in a multi-component high Mn steel melt were measured as a function of temperature. After the equilibrium N solubility was attained for a Fe-25% Mn-0.3% Si-0.6% C melt at 1773 K under a nitrogen partial pressure of 0.14 atm, Al was added repeatedly up to 1.38 mass% while the melt temperature was increased to 1823 and 1873 K. After new nitrogen solubility equilibrium was attained at 1873 K, the melt temperature was then lowered to 1823, 1773 and 1723 K successively and held for 1 hour at each temperature prior to metal sampling. The metal samples were analyzed for nitrogen and aluminum contents as well as the secondary AlN inclusions precipitated during cooling of the melt.
Metal samples were extracted by a 4 mm ID quartz tube, quenched rapidly in ice water and carefully cut for the chemical analysis. Nitrogen content in the metal sample was analyzed by the nitrogen/oxygen analyzer (LECO TC-600 apparatus, St. Joseph, MI), and carbon content was analyzed by the carbon/sulfur analyzer (CS-800, Eltra, Neuss, Germany). For the analysis of manganese, silicon and aluminum, the metal sample (0.2 g) was dissolved in 20 mL of HCl (1+1) solution in a glass beaker of 50 mL capacity heated in a water bath for 2 hours. After dissolving the sample, the solution was transferred to the measuring flask (1000 mL) with filtration, and analyzed by the inductively coupled plasma atomic emission spectroscopy (ICP-AES, SPECTRO ARCOS apparatus, Kleve, Germany). For analyzing silicon in high Si containing metal samples, the gravimetric method10) was also used.
The AlN inclusions formed in the melt during the varification experiment were analyzed by the potentiostatic electrolytic extraction method. 0.5 g of the metal sample was dissolved in the 10% acetyl-acetone (AA) solution under a total electric charge of 300 mA for 8 hours. 10% AA solution was prepared by dissolving 2.5 g of tetra-methylammonium in 25 mL of acetylacetone, and the 225 mL of methanol was added in a glass beaker with a capacity of 300 mL. The inclusions were collected by the suction filtration using a membrane filter with an open pore size of 0.1 μm. Scanning electron microscopy-energy dispersive X-ray spectroscopy (SEM-EDS, Hitachi, S4800) was used to analyze the inclusion morphology and composition.
The dissolution of nitrogen in liquid iron alloys can be written as
| (1) |
| (2) 11) |
Using Wagner’s formalism,9) the activity coefficient of nitrogen, fN in Fe–Mn–Al–Si–C can be expressed as the following relation using the interaction parameters:
| (3) |
In the authors’ recent studies, the
The N solubility in liquid iron containing manganese up to 54.34 mass% was measured under the reduced nitrogen partial pressures in the temperature range of 1773–1873 K. The experimental results are summarized in Table 1. The experimental results are plotted as the
| System | Temp. (K) | pN2 (atm) | [% Mn] | [% Si] | [% N] |
|---|---|---|---|---|---|
| Fe–Mn–N | 1773 | 0.1 | 25.56 | – | 0.0551 |
| 30.30 | – | 0.0653 | |||
| 34.93 | – | 0.0749 | |||
| 38.71 | – | 0.0852 | |||
| 42.51 | – | 0.1003 | |||
| 46.24 | – | 0.1217 | |||
| 1823 | 0.2 | 0 | – | 0.0199 | |
| 9.64 | – | 0.0324 | |||
| 17.74 | – | 0.0479 | |||
| 24.53 | – | 0.0650 | |||
| 28.10 | – | 0.0757 | |||
| 33.79 | – | 0.1001 | |||
| 38.96 | – | 0.1290 | |||
| 45.22 | – | 0.1628 | |||
| 49.49 | – | 0.1890 | |||
| 54.34 | – | 0.2243 | |||
| 1873 | 0.1 | 25.45 | – | 0.0487 | |
| 31.90 | – | 0.0641 | |||
| 37.83 | – | 0.0812 | |||
| 42.61 | – | 0.1027 | |||
| 45.99 | – | 0.1115 | |||
| Fe–Si–N | 1823 | 0.4 | – | 0 | 0.0276 |
| – | 0.48 | 0.0266 | |||
| – | 0.72 | 0.0254 | |||
| – | 1.18 | 0.0240 | |||
| – | 3.57 | 0.0182 | |||
| – | 3.55 | 0.0187 | |||
| – | 5.74 | 0.0143 | |||
| – | 7.57 | 0.0106 | |||
| – | 9.61 | 0.0073 | |||
| – | 12.53 | 0.00476 | |||
| 1873 | 0.8 | – | 0 | 0.0396 | |
| – | 0.52 | 0.0377 | |||
| – | 1.03 | 0.0353 | |||
| – | 2.80 | 0.0296 | |||
| – | 4.83 | 0.0218 | |||
| – | 6.69 | 0.0173 | |||
| – | 8.27 | 0.0131 | |||
| – | 10.19 | 0.0095 |

Variation of
One of the experimental concerns in dealing with liquid iron containing high manganese content is its manganese vapor pressure. Therefore, the nitrogen partial pressure over the melt surface was corrected by the following equation:
| (4) |
| (5) |
Figure 3 shows the

Relation of
| Temp. Range (K) | [% Mn] Range | pN2 (atm) | Method | Ref. | ||
|---|---|---|---|---|---|---|
| −0.023 | −0.763/T+0.000489 (0.000081) | 1773–1873 | <54.4 | 0.1,0.2 | Sampling | Present study |
| −0.020 | −0.000045 | 1773–1873 | <30 | 0.06–1 | Sampling | (15) |
| −0.023 | – | 1823–1873 | < 22 | 0.1–0.8 | Sampling | (5) |
| −0.020 | – | 1873 | <6 | 1 | Sieverts | (11) |
| −0.020 | – | 1823–1973 | <4 | 1 | Sieverts | (17) |
| −0.0245 | – | 1873 | <6 | 1 | Sampling | (16) |
| −0.020 | – | 1813–1953 | <9 | 1 | Sampling | (18) |
| −59.6/T+0.011 (−0.0209) | – | 1823–1923 | <25 | 1 | Sampling | (19) |
Recently, Senk et al.15) measured the N solubility in liquid steel containing high manganese content from 10 to 30 mass% at various nitrogen pressures from 0.06 to 1 atm in a vacuum induction furnace in the temperature range from 1786 to 1873 K. They reported the second-order
Therefore, from a regression analysis of the data determined in the present study taking the first-order
The N solubility in liquid iron containing silicon up to 12.53 mass% was measured under the reduced nitrogen partial pressures at 1823 and 1873 K. The experimental results are summarized in Table 1. Figure 4 shows the variation of
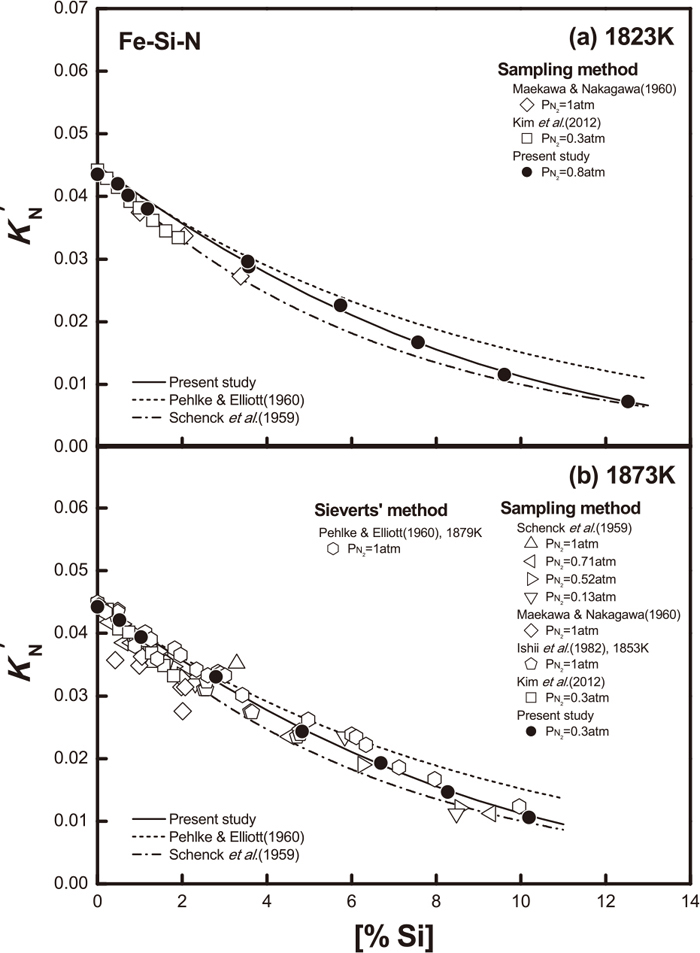
Variation of
Figure 5 shows the

Relation of
Therefore, from a regression analysis of the data determined in the present study taking the first-order
In order to determine the simultaneous effect of two different alloying elements on the N solubility in liquid iron, the N solubility was measured in ternary Fe–Mn–Si, Fe–Al–Si, Fe–Mn–C and Fe–Si–C melts under various nitrogen partial pressures at 1773–1873 K. The experimental results are summarized in Table 4.
| System | Temp. (K) | pN2 (atm) | [% Mn] | [% Al] | [% Si] | [% C] | [% N] |
|---|---|---|---|---|---|---|---|
| Fe–Mn–Si–N | 1773 | 0.9 | 10.23 | – | 0.98 | – | 0.0632 |
| 15.97 | – | 1.24 | – | 0.0832 | |||
| 19.83 | – | 1.26 | – | 0.0999 | |||
| 23.20 | – | 1.25 | – | 0.1180 | |||
| 26.43 | – | 1.26 | – | 0.1390 | |||
| 1873 | 0.3 | 0 | – | 0.33 | – | 0.0237 | |
| 4.05 | – | 0.33 | – | 0.0296 | |||
| 8.40 | – | 0.34 | – | 0.0361 | |||
| 12.06 | – | 0.36 | – | 0.0432 | |||
| 15.44 | – | 0.41 | – | 0.0519 | |||
| Fe–Al–Si–N | 1823 | 0.1 | – | 0 | 1.73 | – | 0.0115 |
| – | 0.36 | 1.68 | – | 0.0120 | |||
| – | 0.54 | 1.71 | – | 0.0111 | |||
| – | 0.73 | 1.77 | – | 0.0108 | |||
| – | 0.90 | 1.76 | – | 0.0106 | |||
| – | 1.12 | 1.82 | – | 0.0105 | |||
| 1873 | 0.3 | – | 0 | 1.03 | – | 0.0216 | |
| – | 0.19 | 0.96 | – | 0.0213 | |||
| – | 0.35 | 0.97 | – | 0.0214 | |||
| – | 0.53 | 0.93 | – | 0.0216 | |||
| – | 0.90 | 0.97 | – | 0.0210 | |||
| – | 1.08 | 0.95 | – | 0.0207 | |||
| Fe–Mn–C–N | 1773 | 0.9 | 27.23 | – | – | 0 | 0.1658 |
| 27.22 | – | – | 0.10 | 0.1580 | |||
| 27.09 | – | – | 0.19 | 0.1523 | |||
| 26.51 | – | – | 0.30 | 0.1477 | |||
| 26.34 | – | – | 0.40 | 0.1447 | |||
| 26.51 | – | – | 0.52 | 0.1390 | |||
| 26.30 | – | – | 0.63 | 0.1340 | |||
| 1873 | 0.3 | 0 | – | – | 0.94 | 0.0195 | |
| 2.80 | – | – | 1.01 | 0.0225 | |||
| 5.08 | – | – | 0.99 | 0.0250 | |||
| 10.00 | – | – | 1.00 | 0.0321 | |||
| 14.47 | – | – | 1.00 | 0.0393 | |||
| 18.44 | – | – | 1.00 | 0.0477 | |||
| Fe–Si–C–N | 1773 | 0.75 | – | – | 0 | 0.97 | 0.0308 |
| – | – | 0.29 | 0.97 | 0.0297 | |||
| – | – | 0.49 | 0.97 | 0.0294 | |||
| – | – | 0.77 | 0.97 | 0.0280 | |||
| – | – | 0.98 | 0.97 | 0.0271 | |||
| – | – | 1.25 | 0.96 | 0.0262 | |||
| 1873 | 0.4 | – | – | 1.29 | 0 | 0.0248 | |
| – | – | 1.26 | 0.53 | 0.0216 | |||
| – | – | 1.36 | 1.07 | 0.0186 | |||
| – | – | 1.34 | 1.57 | 0.0158 | |||
| – | – | 1.35 | 2.09 | 0.0132 | |||
| – | – | 1.32 | 2.62 | 0.0110 |
Using the relation shown in Eq. (3), the second-order cross-product parameters on nitrogen in liquid iron,

Relation of Eq. (3) to determine the value of (a)
Figure 7 summarizes the

Simultaneous effects of alloying elements on the activity coefficient of nitrogen in Fe-i-j ternary liquid iron alloys (i, j=Al, Mn, Si and C).
Table 5 summarizes the interaction parameters determined in the present study as well as in the author’s recent studies.5,7,8,14,24) Therefore, the nitrogen solubility in multi-component Fe–Mn–Si–C–Al alloy melts of various compositions can be calculated by the following relation obtained from Eq. (3):
| (6) |
| System | Interaction parameter | Value (1873 K) | Temp. (K) [% i] range | pN2 (atm) | Ref. |
|---|---|---|---|---|---|
| Fe–Mn–N | −0.023 | 1773–1873 [% Mn]<54.4 | 0.1–0.3 | Present study | |
| −0.763/T+0.000489 (0.000081) | |||||
| Fe–Si–N | 0.047 | 1823–1923 [% Si]<12.53 | 0.3–1 | Present study | |
| 0.0013 | |||||
| Fe–Al–N | 0.017 | 1823–1973 [% Al]<2.5 | 0.2–1 | (14) | |
| 0 | |||||
| 0.043 | 1823–1973 0.8<[% Al]<4.5 | ||||
| 0 | |||||
| Fe–C–N | 0.08 | 1773–1873 | 0.3, 0.8 | (7) | |
| 0.014 | [% C]<5.2 | ||||
| Fe–Mn–C–N | 0.0019 | 1773–1873 [% Mn]<27.23,[% C]<1.01 | 0.3, 0.9 | Present study | |
| Fe–Si–C–N | 0.013 | 1773–1873 [% C]<2.62, [% Si]<1.36 | 0.4, 0.75 | Present study | |
| Fe–Mn–Si–N | 0 | 1773–1873 [% Mn]<26.43, [% Si]<1.3 | 0.3, 0.9 | Present study | |
| Fe–Al–Si–N | 0 | 1823–1873 [% Al]<1.12, [% Si]<1.82 | 0.1, 0.3 | Present study | |
| 0.037 | 1823–1923 [% Al]<1.68, [% Si]<1.5 | 0.3, 1 | Present study | ||
| 0 | |||||
| Fe–Mn–Al–N | 0 | 1823–1873 [% Mn]<20.3, [% Al]<0.38 | 0.1–0.8 | (5) | |
| 0 | 1823–1873 [% Mn]<22, [% Al]<1.8 | 0.2–0.8 | (24) | ||
| 0 | |||||
| Fe–Al–C–N | 0.038 | 1773–1873 [% Al]<0.91, [% C]<2.03 | 0.19–0.8 | (8) | |
| 0.03 | 1773–1873 [% Al]<2.45, [% C]<3.9 | 0.19–0.8 | |||
| 0 |
In order to check the validity of interaction parameters determined in the present study, a verification experiment was carried out by measuring the N solubility in Fe-25% Mn-0.3% Si-0.6% C-Al melt which is a typical TWIP steel composition. After the equilibrium N content was attained in Fe-25% Mn-0.3% Si-0.6% C melt under a nitrogen partial pressure of 0.14 atm at 1773 K, Al was added repeatedly while the melt temperature was increased from 1773 K to 1823 and 1873 K. After each Al addition and temperature increase, new nitrogen solubility equilibrium was attained within 1 hour. The experimental results are summarized in Table 6.
| Temp. (K) | pN2 (atm) | [%Mn] | [%Si] | [%C] | [%Al] | [%N] | Saturation | |
|---|---|---|---|---|---|---|---|---|
| Obs. | Cal. | |||||||
| 1773 | 0.14 | 26.04 | 0.34 | 0.61 | 0 | 0.0478 | 0.0473 | |
| 26.02 | 0.34 | 0.60 | 0.24 | 0.0456 | 0.0464 | |||
| 26.07 | 0.33 | 0.60 | 0.55 | 0.0461 | 0.0453 | |||
| 1823 | 25.70 | 0.34 | 0.61 | 0.54 | 0.0428 | 0.0439 | ||
| 25.13 | 0.34 | 0.60 | 0.83 | 0.0403 | 0.0419 | |||
| 1873 | 24.70 | 0.33 | 0.60 | 1.12 | 0.0397 | 0.0397 | ||
| 24.87 | 0.33 | 0.61 | 1.38 | 0.0380 | 0.0389 | |||
| 1823 | 24.41 | 0.33 | 0.60 | 1.35 | 0.0327 | 0.0325 | AlN | |
| 1773 | 23.86 | 0.32 | 0.58 | 1.30 | 0.0196 | 0.0197 | AlN | |
| 1723 | 23.46 | 0.34 | 0.59 | 1.24 | 0.0117 | 0.0114 | AlN | |
Figure 8 compares the experimental results of N solubility with predicted values in the melt as a function of Al content at different temperatures. The predicted N solubility using the second-order cross-product parameters,

Correlation between calculated and measured N solubility in Fe-25%Mn-0.3%Si-0.6%C-Al-N melt.
The reaction equilibrium for the dissolution of pure solid AlN in liquid iron can be written as:
| (7) |
| (8) 14) |
Using Wagner’s formalism,9) the equilibrium constant, KAlN can be expressed as the following relation using the interaction parameters:
| (9) 14) |
The values of
Therefore, using Eq. (9) and thermodynamic parameters listed in Table 5, one can calculate the contour lines of critical Al and N contents for the onset of AlN inclusion formation in Fe–Mn–Si–C–Al–N alloy melt as functions of melt composition and temperature. For an example, an AlN solubility diagram for a commercial TWIP steel composition of Fe-25% Mn-0.3% Si-0.6% C-Al-N can be constructed at different temperatures from 1873 to 1723 K as shown as solid lines in Fig. 9. The dotted lines were calculated without considering the cross-product effect of alloying elements on nitrogen,

AlN solubility diagram in Fe-25%Mn-0.3%Si-0.6%C-Al-N melt.
The variation of nitrogen and aluminum contents with melt temperature change are summarized in Table 6. They changed from the point A to B, C and D in Fig. 9 as the melt temperature decreased from 1873 to 1823, 1773 and 1723 K, respectively. The experimental results showed an excellent agreement with predicted critical Al and N contents for the AlN inclusion formation at each temperature. The predicted lines calculated without considering the cross-product effect of alloying elements on nitrogen showed higher values compared to the experimental data. The metal samples were analyzed for the inclusions by the potentiostatic electrolytic extraction method and the SEM-EDS analysis. There was no AlN inclusions observed in the sample A at 1873 K. Figure 10 shows the SEM images of AlN inclusions in the metal sample B at 1823 K. The inclusions extracted by the potentiostatic electrolytic extraction method were identified as the AlN inclusions of 1–10 μm size by the SEM-EDS analysis.

SEM image of (a) inclusion formed at 1823 K in the sample B; (b) extracted AlN from sample B using AA solution.
The interaction parameters of alloying element on nitrogen in liquid iron have been determined from the nitrogen solubility in liquid Fe–Mn, Fe–Si, Fe–Mn–Si, Fe–Mn–C, Fe–Al–Si, Fe–Si–C and Fe–Mn–Si–C–Al melts over a wide range of composition and temperature. By taking into account the interaction parameters determined in the present study, the interaction parameters of silicon on aluminum was newly determined. These parameters could be used to accurately predict the nitrogen solubility and the AlN solubility product in multi-component Fe–Mn–Si–C–Al system. The main finding of this study can be summarized as follows:
(1) The first and second-order interaction parameters of manganese and silicon on nitrogen in liquid Fe–Mn–N and Fe–Si–N melts over a wide range of melt composition can be expressed as:
(2) The effects of cross-products on nitrogen in liquid Fe–Mn–Si–N, Fe–Al–Si–N, Fe–Mn–C–N and Fe–Si–C–N melts can be expressed as:
(3) The first- and second-order interaction parameters of silicon on aluminum in liquid Fe–Si–Al–N melts were determined as:
This study was supported by the R&D Center for Valuable Recycling (Global-Top Environmental Technology Development Program) funded by the Ministry of Environment (Project No.: 11-C22-ID).