Regular Article
Role of MgO in Sinter from Perspective of MgO Distribution between Liquid and Magnetite Phases in FeOx–CaO–SiO2–MgO System
2017 Volume 57 Issue 12 Pages 2124-2130
Details
2017 Volume 57 Issue 12 Pages 2124-2130
The chemical compositions of liquid in equilibrium with FeOx in the FeOx–CaO–SiO2–MgO system at 1573 K and oxygen partial pressures of 10−7 atm and 10−6 atm have been determined along with the MgO concentrations in the liquid and FeOx phases to understand the role of MgO in improvement of reducibility of the sinter produced from deteriorated iron ores. The liquid area in the FeOx–rich side was decreased with additions of MgO over the measurement range of C/S ratios between 0.32 and 2.28, and was separated into silicate–based and calcium ferrite–based liquid phases, where 2CaO·SiO2 phase becomes stable thermodynamically in the C/S ratios between 1.66 and 1.96. The ratio of MgO concentration in the liquid phase to that in the FeOx phase decreased with increasing C/S ratio from 0.36 to 2.28, which trend has been explained from the viewpoint of basicity. On the basis of these findings, the role of MgO in improvement of reducibility of the sinter has been discussed to conclude that additions of MgO make the cohesive zone thinner and improves the gas permeability in a blast furnace.
Steelmaking industry is facing an issue of deterioration in quality of iron ores. Iron ores contains more phosphorus, combined water and alumina concentrations than before, which brings about various problems for the blast furnace operation.1,2,3,4) In particular, the increase of Al2O3 content in iron ore is very serious because Al2O3 lowers the reducibility of iron ore sinter and decreases the gas permeability in a blast furnace.5,6) To overcome these problems, many attempts have been done, such as introducing micro pores into the sinter,7) decreasing the volumes of gangue minerals in the sinter7) and optimizing the compositions4,8,9,10) of gangue minerals in the sinter.
Among them, additions of MgO into the sinter have been one of the most commonly applied projects because the sinter containing MgO shows superior performance at the lower part of a blast furnace.10,11,12,13) For example, Matsumura et al.11) have tried to add MgO into the sinter in the form of dolomite. They have found that the reducibility of the sinter is improved, and explained that the improvement is due to less formation of silicate slag phase with poor reducibility because both MgO and SiO2 dissolve into calcium ferrite which is the major part of the sinter. In contrast, Higuchi et al.12) and Sunahara et al.10) have insisted that MgO dissolves into the slag phase, affecting physicochemical properties of slag, and thereby decreases the dripping temperature and increases the hearth drainage rate of slag. The decrease in the dripping temperature, in turn, makes the cohesive zone thinner, resulting in the increase of gas permeability in a blast furnace. Thus, there is no consensus on the role of MgO although its effectiveness is shared as common understanding.
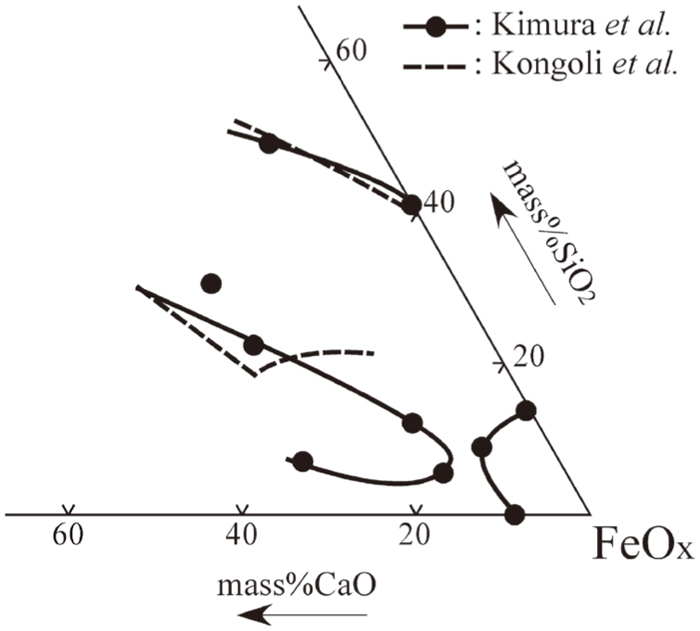
The role of MgO should be investigated from the perspective of kinetics as well as thermodynamics. The present work takes a thermodynamic approach; in that case, on the basis of the previous reports,10,11,12,13) it is strongly required to have information about MgO distributions in mineral phases (hematite, magnetite, calcium ferrite and silicate slag phases) composing the sinter. Thus, the sinter is basically the ternary system FeOx, CaO and SiO2, and essential is the phase diagram of the system with information on MgO, as shown in Fig. 1:14) The isotherm of FeOx–CaO–SiO2 slag containing MgO at 1573 K and oxygen partial pressures (PO2) of 10−6-10−8 atm which is similar to that of the sintering process15) has been calculated by Kongoli and his coworkers,16,17) and has also been experimentally obtained by Kimura et al.18) Their isotherms are in good agreement with each other. However, there is no consensus between them in the respect of the continuity of the silicate-based and calcium ferrite-based liquid phases at PO2 = 10−8 atm: Kongoli et al.17) have reported that there are two liquid regions, whereas Kimura et al.18) has reported the presence of only one liquid phase. In these reports, moreover, the MgO solubility in magnetite phase has not been focused on in spite of the fact that the sufficient amount of MgO is solved in magnetite which is expected to be equilibrated with the liquid phase around PO2 = 10−8 atm.
Consequently, the present work aims to determine the chemical compositions of liquid in equilibrium with FeOx at 1573 K and oxygen partial pressures of 10−7 atm and 10−6 atm along with the MgO concentrations in the liquid and FeOx phases to understand the role of MgO in improvement of reducibility of the sinter produced from deteriorated iron ores.
In the present work, 19 samples were used, as given in Table 1. These samples were prepared from regent grade Fe2O3, SiO2, MgO and CaO powders, the last being made by thermal decomposition of CaCO3; in some cases, CaCO3 powders were used instead of CaO. These reagents were weighed to desired compositions and mixed in an alumina mortar.
| No. | Initial compositions (mass%) | C/S | Type of crucible | PO2 (atm) | |||
|---|---|---|---|---|---|---|---|
| Fe2O3 | CaO | SiO2 | MgO | ||||
| 1 | 76.0 | 9.5 | 9.5 | 5.0 | 1.0 | A | 2.5×10⁻⁶ |
| 2 | 79.0 | 9.5 | 9.5 | 2.0 | 1.0 | A | 2.5×10⁻⁶ |
| 3 | 56.4 | 17.8 | 17.8 | 8.0 | 1.0 | A | 2.5×10⁻⁶ |
| 4 | 38.2 | 28.4 | 28.4 | 5.0 | 1.0 | A | 2.5×10⁻⁶ |
| 5 | 33.2 | 30.9 | 30.9 | 5.0 | 1.0 | A | 2.5×10⁻⁶ |
| 6 | 50.0 | 27.7 | 17.3 | 5.0 | 1.6 | B | 2.7×10⁻⁷ |
| 7 | 50.0 | 28.3 | 16.7 | 5.0 | 1.7 | B | 2.7×10⁻⁷ |
| 8 | 50.0 | 9.0 | 36.0 | 5.0 | 0.25 | A | 2.7×10⁻⁷ |
| 9 | 50.0 | 15.0 | 30.0 | 5.0 | 0.5 | A | 2.7×10⁻⁷ |
| 10 | 50.0 | 22.5* | 22.5 | 5.0 | 1.0 | A | 2.7×10⁻⁷ |
| 11 | 50.0 | 27.0* | 18.0 | 5.0 | 1.5 | B | 2.7×10⁻⁷ |
| 12 | 50.0 | 16.9* | 28.1 | 5.0 | 0.6 | A | 2.7×10⁻⁷ |
| 13 | 50.0 | 21.3* | 23.7 | 5.0 | 0.9 | A | 2.7×10⁻⁷ |
| 14 | 50.0 | 28.3* | 16.7 | 5.0 | 1.7 | B | 2.7×10⁻⁷ |
| 15 | 85.5 | 6.7* | 2.8 | 5.0 | 2.4 | B | 2.7×10⁻⁷ |
| 16 | 50.0 | 28.3* | 16.7 | 5.0 | 1.7 | C | 2.7×10⁻⁷ |
| 17 | 50.0 | 29.5* | 15.5 | 5.0 | 1.9 | C | 2.7×10⁻⁷ |
| 18 | 83.0 | 8.4* | 3.6 | 5.0 | 2.3 | C | 2.7×10⁻⁷ |
| 19 | 55.0 | 20.0 | 20.0 | 5.0 | 1.0 | A | 2.7×10⁻⁷ |
The samples were placed in the respective crucibles, as given in Table 1, and held at 1573 K in a flow of Ar–O2 gases (50 ml/min) for 24 h to attain equilibration, where temperature (T) was controlled within ± 2 K in the uniform temperature zone, and partial pressures of oxygen (PO2) were controlled to be 2.5×10⁻⁶ atm or 2.7×10⁻⁷ atm, depending on the sample, which values were recorded in the outlet gas using an oxygen sensor. The equilibration time was determined from preliminary experiments, as mentioned in 3.1. After the equilibration, the crucible containing the sample was quenched into an ice-water mixture.
In the present work, three types of crucible (A, B and C) were used depending on the sample, as shown in Table 1 and Fig. 2:
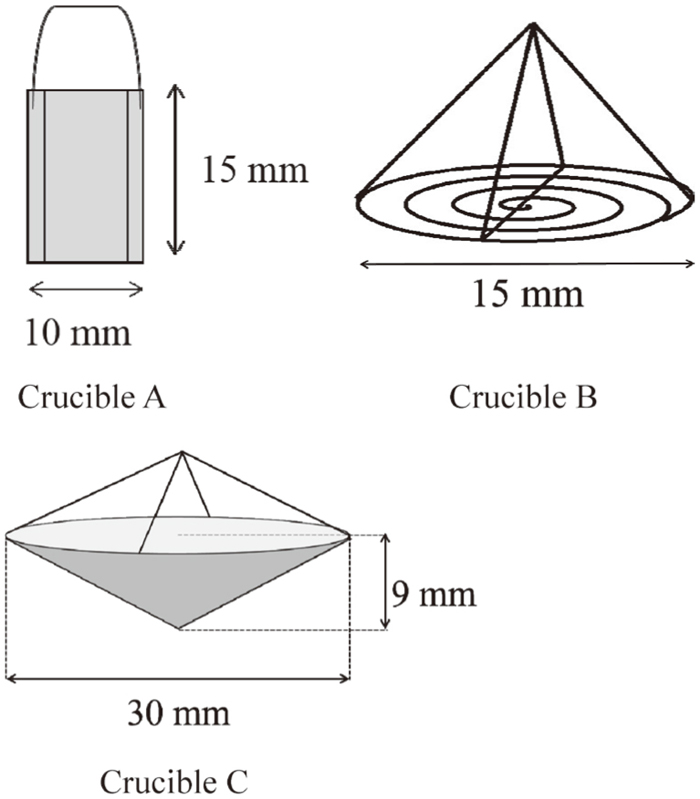
Schematic illustration of crucibles.
Crucible A was folded platinum foil 12 mm × 35 mm × 0.02 mm sized, in which about 0.4 g of a sample mixture was contained. This type of crucible was used for samples having C/S ≤ 1, where C/S represents the ratio of (mass%CaO)/(mass%SiO2).
Crucible B was originally developed by Hayes and coauthors19) and, in the present work, was made of platinum wire having 0.5 mm diameter, on which about 0.22 g of a sample mixture having 10 mm diameter was placed after the sample being uniaxially cold-pressed. This type of crucible was used for samples having C/S ≥ 1.5, which samples would contain dendritic 2CaO·SiO2 (hereinafter denoted as C2S) after quenching:20) however, dendritic C2S is not a phase equilibrated with FeOx at 1573 K and is produced during the cooling process. Using crucible B, the molten sample was maintained in the form of film between the gaps of the wire, which resulted in higher quenching rates to minimize C2S crystallisation.
Crucible C was made of platinum wires and foil, on which about 0.3 g of a sample mixture was placed. This type of crucible was used for samples having C/S ≥ 1.7 because samples with higher C/S might be difficult to be maintained by crucible B due to lower viscosities.
2.3. Sample CharacterisationX-ray diffractometry (XRD) was applied to identify the phases of samples after equilibrium experiments. The microstructures and chemical compositions of all the phases were measured by an electron probe microanalyzer (EPMA) with an accelerating voltage of 15 kV and a probe current of 20 nA, where the ZAF correction was made. For quantitative analyses by EPMA, two glassy samples were prepared as standards: 33.3(mass%)Fe2O3-30.9CaO-30.9SiO2-5.0MgO (C/S = 1) and 42.0(mass%)Fe2O3-32.1 CaO-22.9SiO2-3.0MgO (C/S = 1.4), the former was used for the samples with C/S ≤ 1 and the latter for the samples with C/S > 1. The composition of the standard sample was calculated using the mixture fractions of the Fe2O3, CaO, SiO2 and Al2O3 powders. All the iron ions are assumed to be Fe3+ by considering the Mössbauer spectroscopic analyses. Additionally, magnesio-ferrite sample (88(mass%)Fe3O4-12MgO) was also prepared as standard in reference to the phase diagram of Fe3O4–MgO system21) because preliminary experiments confirmed that the equilibrated solid phase was magnetite containing a considerable amount of MgO, as mentioned in 3.1. This standard sample was prepared as follows: Weighed mixture of Fe3O4 and MgO powders was uniaxially pressed into the form of tablet having 10 mm diameter. This sample was heated at 1623 K in air for more than 16 h and then pulverized, pressed and heated again in the same manner. This sequence was repeated three times to obtain the standard sample. The sample obtained finally consisted of a single phase of magnesio-ferrite, which was confirmed by XRD analysis.
Figure 3 shows a back-scattered electron (BSE) image of the cross section of sample 19 shown in Table 1 held for 24 h at PO2 = 2.7×10⁻⁷ atm in the experimental condition together with a line profile of Mg element. It can be seen that the sample is composed of FeOx and slag phases: the former is magnetite according to XRD analysis and the latter used to be liquid. In addition, the Mg distribution is uniform across the magnetite phase, which suggests that the system attained equilibrium in 24 h. To firmly establish the equilibration time, EPMA analyses were made on the liquid and magnetite phases of sample 19 which were held for different times from 24 h to 96 h. Figures 4 and 5 show the FeOx concentration in the liquid phase and the MgO concentration in the magnetite phase as functions of holding time, respectively, where the FeOx concentration has been calculated as that for FeO. All the data plotted in both figures are the respective averages of values recorded by analyses on ten different positions and the error bar represents the respective scattering range. It can be seen that both FeOx concentration in the liquid phase and the MgO concentration in the magnetite phase become constant in 24 h. Thus, it is reasonable to take 24 h as the equilibration time in 2.2.
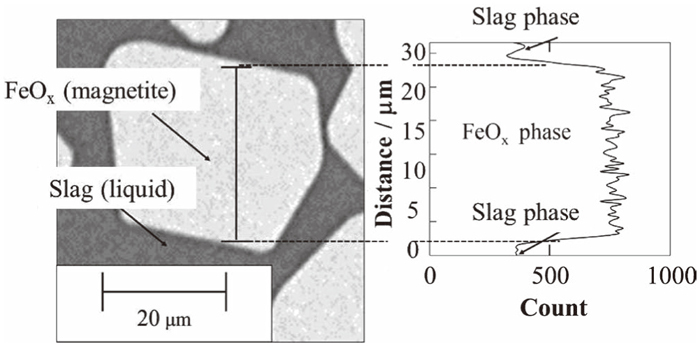
Back-scattered electron (BSE) image of the cross section of sample 19 held for 24 h at PO2 = 2.7×10⁻⁷ atm in the experimental condition together with a line profile of Mg element.
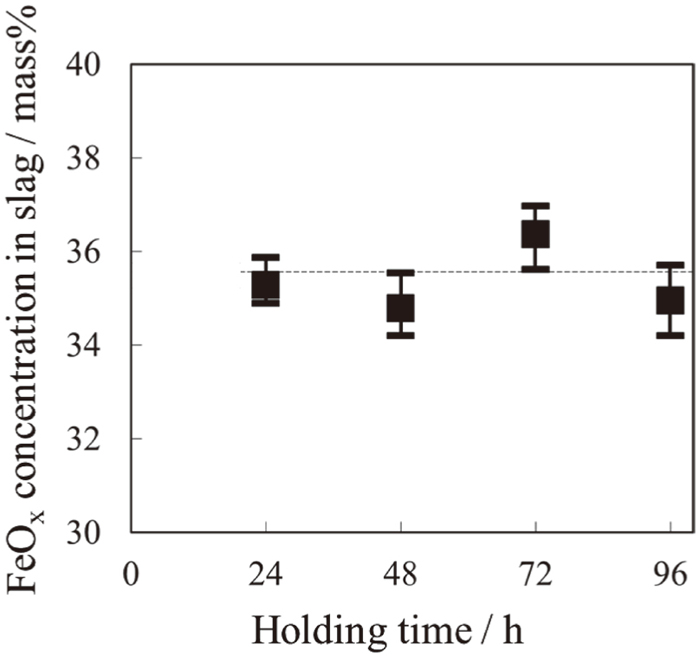
FeOx concentration in the liquid phase as a function of holding time.
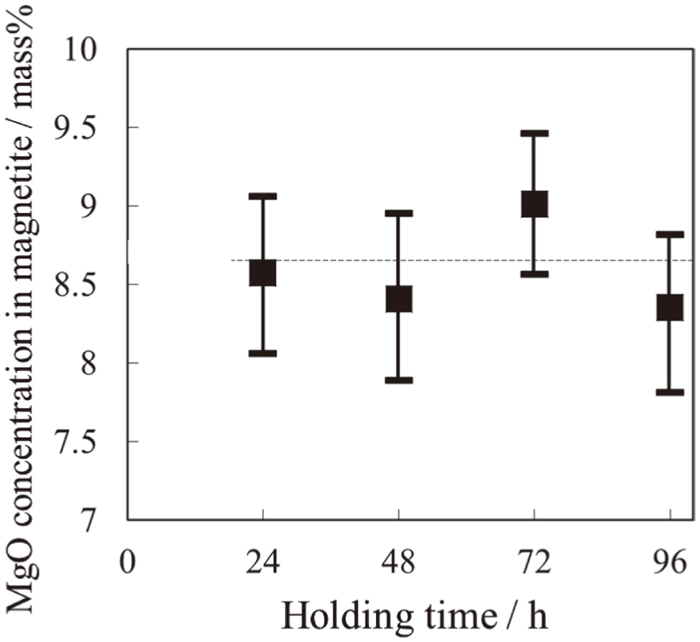
MgO concentration in magnetite as a function of holding time.
Table 2 shows the chemical compositions of liquid and magnetite phases obtained by EPMA analyses for samples 1–18, where the FeOx concentration in the liquid phase has been calculated as that for FeO. For the magnetite phase, the CaO concentration is less than 3 mass% and the SiO2 concentration is negligibly small. In addition, BSE images have confirmed that the liquid phase was in equilibrium with the magnetite phase at 1573 K in the samples except for samples 8, 14, 16 and 17. For sample 8 the liquid phase coexists with SiO2 and magnetite phases, as shown in Fig. 6(a), whereas for samples 14, 16 and 17 the liquid phase coexists with C2S and magnetite phases, as shown in Figs. 6(b)–6(d). The C2S phase observed in the present work is granular; in contrast, it is known that C2S produced during the cooling process is dendritic20) or fine needle-shaped19) microcrystalline. Thus, it is supposed that the C2S phase in samples 14, 16 and 17 is an equilibrium phase.
| No. | Compositions of liquid phase | C/S | Compositions of Fe3O4 phase | Solid phase | ||||||
|---|---|---|---|---|---|---|---|---|---|---|
| FeOx | CaO | SiO2 | MgO | FeOx | CaO | SiO2 | MgO | |||
| 1 | 34.4 | 31.0 | 31.6 | 3.00 | 0.98 | 93.5 | 0.61 | 0.05 | 5.89 | Fe3O4 |
| 2 | 38.8 | 29.4 | 30.6 | 1.18 | 0.96 | 96.7 | 0.69 | 0.03 | 2.59 | Fe3O4 |
| 3 | 27.3 | 31.7 | 34.3 | 6.67 | 0.92 | 87.7 | 0.35 | 0.03 | 11.9 | Fe3O4 |
| 4 | 29.3 | 33.7 | 31.7 | 5.29 | 1.06 | 90.0 | 0.84 | 0.05 | 9.16 | Fe3O4 |
| 5 | 29.2 | 34.2 | 31.4 | 5.14 | 1.09 | 90.5 | 0.69 | 0.05 | 8.78 | Fe3O4 |
| 6 | 37.2 | 36.0 | 23.8 | 2.99 | 1.51 | 84.7 | 1.49 | 0.02 | 13.8 | Fe3O4 |
| 7 | 34.4 | 38.8 | 24.2 | 2.54 | 1.60 | 87.5 | 1.55 | 0.02 | 10.9 | Fe3O4 |
| 8 | 38.9 | 13.1 | 41.1 | 6.81 | 0.32 | 95.5 | 0.16 | 0.11 | 4.25 | Fe3O4, SiO2 |
| 9 | 38.3 | 18.1 | 37.5 | 6.07 | 0.48 | 95.4 | 0.17 | 0.05 | 4.39 | Fe3O4 |
| 10 | 36.0 | 33.4 | 27.7 | 2.93 | 1.21 | 88.5 | 1.01 | 0.01 | 10.5 | Fe3O4 |
| 11 | 37.8 | 36.5 | 22.5 | 3.10 | 1.62 | 82.1 | 1.90 | 1.93 | 14.1 | Fe3O4 |
| 12 | 36.5 | 14.8 | 40.8 | 7.95 | 0.36 | 94.8 | 0.11 | 0.07 | 4.99 | Fe3O4 |
| 13 | 33.5 | 30.4 | 31.5 | 4.70 | 0.97 | 91.9 | 0.67 | 0.01 | 7.43 | Fe3O4 |
| 14 | 37.9 | 37.1 | 22.4 | 2.64 | 1.66 | 85.9 | 1.49 | 0.02 | 12.6 | Fe3O4, C2S |
| 15 | 46.2 | 34.3 | 17.5 | 1.91 | 2.28 | 89.6 | 2.52 | 0.01 | 7.88 | Fe3O4 |
| 16 | 38.4 | 36.7 | 22.0 | 2.85 | 1.67 | 85.1 | 2.10 | 0.01 | 12.8 | Fe3O4, C2S |
| 17 | 43.5 | 36.2 | 18.5 | 1.75 | 1.96 | 87.1 | 2.35 | 0.02 | 10.6 | Fe3O4, C2S |
| 18 | 50.4 | 32.9 | 15.9 | 0.77 | 2.06 | 93.5 | 2.26 | 0.00 | 4.28 | Fe3O4 |

BSE images for samples 8 (a) where liquid phase coexists with SiO2 and magnetite phases, and samples 14 (b), 16(c) and 17(d) where the liquid phase coexists with C2S and magnetite phases.
Figure 7 shows the relation between FeOx and MgO concentrations in the liquid phase in equilibrium with magnetite for samples 1–5 with C/S = 1.0 in comparison with reported values for the same sample without MgO20) equilibrated at 1573 K and PO2 = 2.5×10⁻⁶ atm. The FeOx concentration in the liquid phase decreases with an increase in the MgO concentration, which means that the liquid phase area equilibrated with the magnetite phase at this temperature becomes smaller with increasing MgO concentration. This is in accordance with the thermodynamic modelling calculation by Kongoli and Yazawa.16)
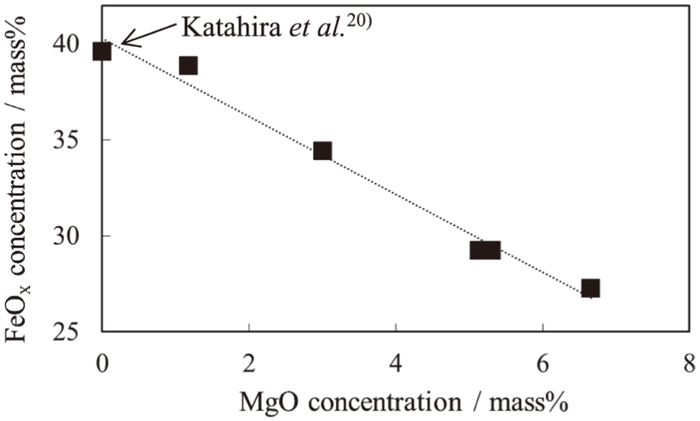
Relation between FeOx and MgO concentrations in the liquid phase in equilibrium with magnetite for samples 1–5 with C/S = 1.0 in comparison with reported values for the same sample without MgO20) equilibrated at 1573 k and PO2 = 2.5×10⁻⁶ atm.
Figure 8 shows the isotherm at 1573 K, i.e., the liquid compositions in equilibrium with magnetite for the FeOx–CaO–SiO2 system with 5 mass% MgO at PO2 = 2.7×10⁻⁷ atm (samples 6–18) (thick solid line), in comparison with reported values for the same system without MgO at PO2 = 2.5×10⁻⁶ atm20) (dashed line), where the liquid compositions are plotted assuming that the liquids are composed only of CaO, SiO2 and FeO. Thin solid lines (straight lines) are those connecting the liquid compositions with the equilibrated solid phases, i.e., magnetite, SiO2 or C2S for the system with 5 mass% MgO. The addition of MgO decreases the liquid phase area equilibrated with magnetite in the C/S range investigated. Different from the system without MgO, the liquid phase area in the present system is separated into two liquid phases in the upper and lower sides of the Alkemade line between FeOx and C2S. In addition, in the presence of MgO, the C2S phase becomes thermodynamically stable in the C/S range between 1.66 and 1.96.
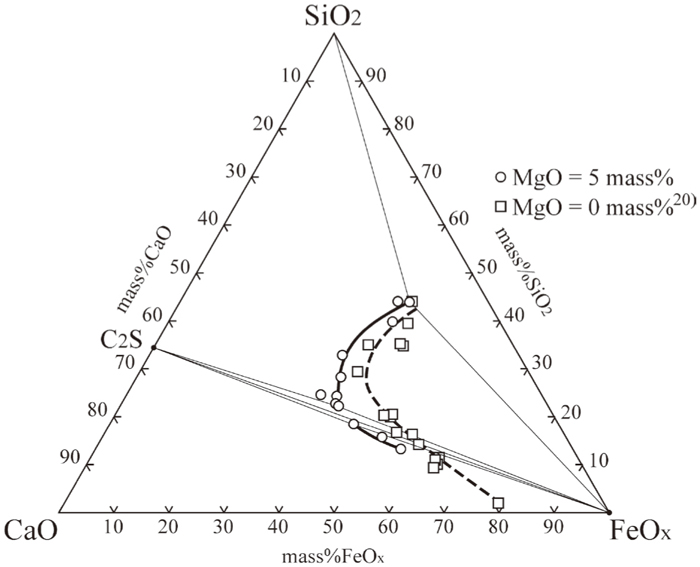
Isotherm at 1573 K, i.e., the liquid compositions in equilibrium with magnetite for the FeOx–CaO–SiO2 system with 5 mass% MgO at PO2 = 2.7×10⁻⁷ atm in comparison with reported values for the same system without MgO at PO2 = 2.5×10⁻⁶ atm.20) Thin solid lines (straight lines) are those connecting the liquid compositions with the equilibrated solid phases, i.e., magnetite, SiO2 or C2S for the system with 5 mass% MgO.
Figure 9 shows the MgO concentration in the liquid and magnetite phases as functions of the C/S ratio for samples 6, 7, 9–13, 15 and 18. The MgO concentration in magnetite increases with increasing C/S ratio and about 14 mass% at C/S = 1.62. This high value of MgO concentration in magnetite is consistent with the conclusion by Narita et al.,22) who have reported that the MgO distribution in the magnetite phase is the largest in all the phases relevant to iron ore sinters.
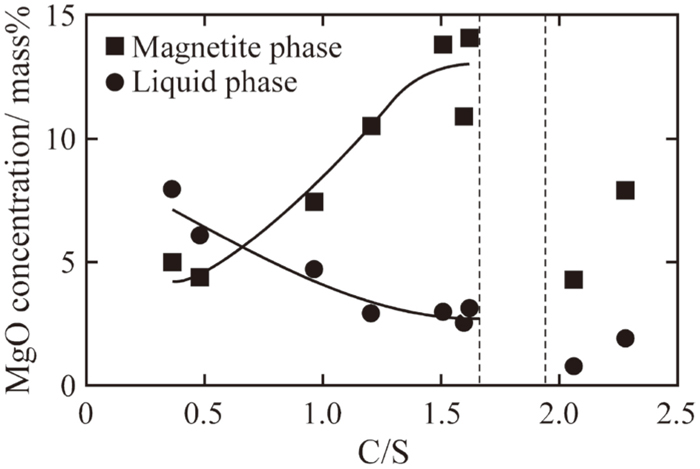
MgO contents in the liquid and magnetite phases as a function of the C/S values.
The mass percentage of the liquid phase equilibrated with magnetite can be estimated from mass balance using the analyzed compositions of liquid and magnetite phases in addition to the nominal compositions of the sample. Figure 10 shows the relation between the mass percentages of liquid phase estimated using FeOx and CaO concentrations for samples 6, 7, 9–13, 15 and 18. It can be seen that the plotted data fall down on the straight line passing through the origin and having the slope of unity. This indicates that the composition analysis by EPMA was valid without effects from fluorescent X-rays. Figure 11 shows the average MgO concentration in the sample as a function of the C/S ratio for samples 6, 7, 9–13, 15 and 18 having 5 mass% MgO, where the average MgO concentration has been estimated using the MgO concentrations in the liquid and magnetite phases obtained by EPMA analyses in addition to the mass percentages of the liquid and magnetite phases estimated using the FeOx concentration as above. The horizontal dotted line in Fig. 11 represents the nominal MgO concentration of the samples. The deviation of the estimated concentration from the nominal is within ± 20% except for the three samples of C/S = 0.32 and C/S > 2, the deviation for which is around ± 40%. This would be because the C/S ratios of these three samples are very different from those of the standard samples for EPMA analysis, i.e., 1 and 1.4. The agreement in most samples indicates that the composition analysis by EPMA was reasonable.
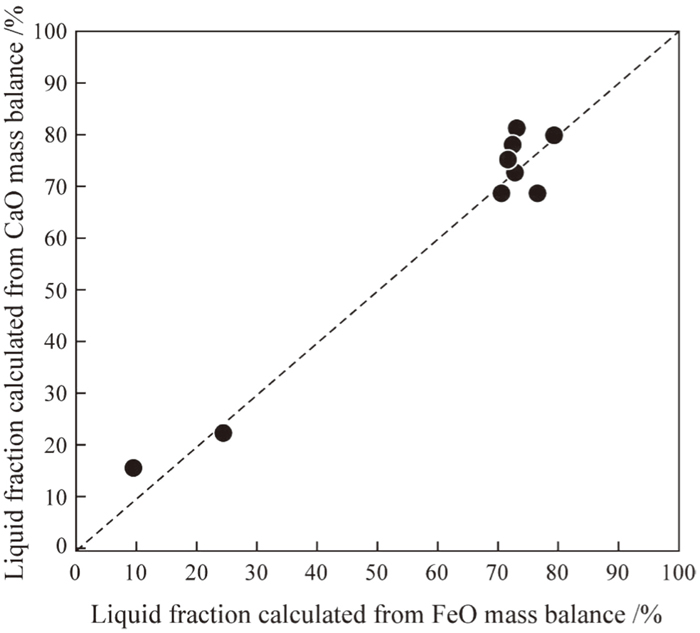
Relation between the mass fractions of liquid phase calculated by mass balance of FeO (horizontal axis) and CaO (vertical axis).
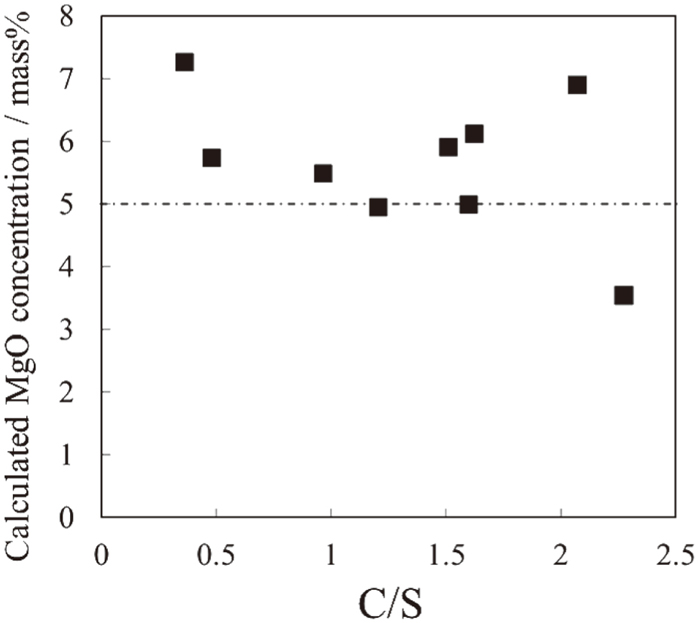
Average MgO concentrations in the samples calculated using the respective MgO contents in liquid and magnetite phases analyzed by EPMA as well as the mass fractions of liquid and magnetite phases calculated by the mass balance of FeOx shown in Fig. 10 as a function of the C/S ratio.
Figure 12 shows the distribution ratio of MgO between the liquid and magnetite phases as a function of C/S ratio for samples 6, 7 and 9–13. In these samples, one liquid phase is in equilibrium with magnetite at 1573 K, as shown in Fig. 8. On the other hand, Fig. 13 conceptually illustrates the tie lines connecting the compositions of the liquid and magnetite phases in equilibrium at 1573 K for samples 6, 7, 9–13, 15 and 18 in the composition tetrahedron of the FeOx–CaO–SiO2–MgO system. Both Figs. 12 and 13 indicate that the distribution of MgO in the liquid phase decreases with increasing C/S ratio from 0.36 to 2.28. This trend can be explained from the viewpoint of basicity as follows: The basic structure of a liquid slag is the silica network, consisting of SiO44− tetrahedra interconnecting by bridging oxygens, and the cations such as Na+ and Ca2+ breaking the Si–O–Si covalent bonds to form non-bridging oxygens O−.23) For the FeOx–CaO–SiO2 system, SiO2 is an acidic oxide acting as a network former of silica, CaO a basic oxide acting as a network breaker of silica, and FeOx an amphoteric oxide acting as either a network former or a network breaker. In the present samples, the FeOx concentrations in the liquid phase equilibrated with magnetite are within 33.5–50.4% while the C/S ratio varies over the range between 0.36 and 2.28. Therefore, the FeOx concentrations in the liquid phase may be assumed to be identical irrespective of the C/S ratio. The C/S ratio principally determines the degree of depolymerisation of the liquid phase, where the degree of depolymerisation corresponds to the ratio of number of non-bridging oxygen atoms to number of tetrahedrally-coordinated atoms. Although MgO is also a basic oxide and breaks silica network, its basicity is smaller than that of CaO.24) Thus, with increasing C/S ratio, MgO may be less stable in the liquid phase, resulting in smaller distribution ratios of MgO.
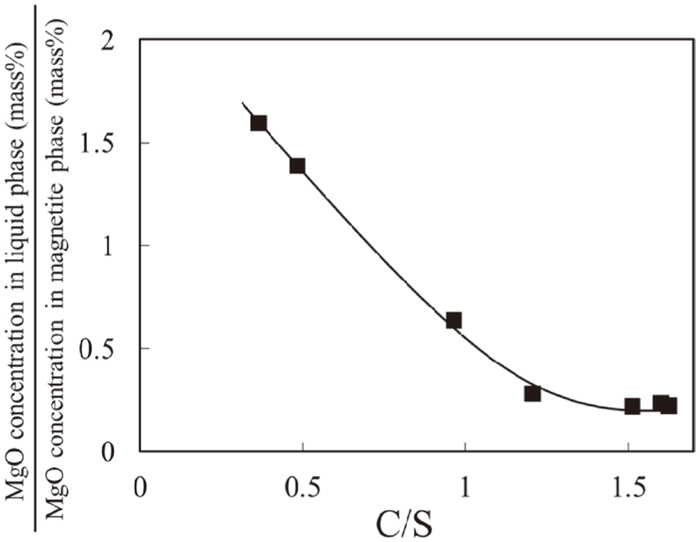
Ratios of the MgO content in liquid phase to that in magnetite phase as a function of the C/S ratio for the samples No. 6, 7 and 9–13 having the initial compositions of 50(mass%)Fe2O3‐45xCaO‐45(1-x)SiO2‐5MgO (x/(1-x) = 0.5–1.7), where one solid phase of magnetite is equilibrated with one liquid phase.
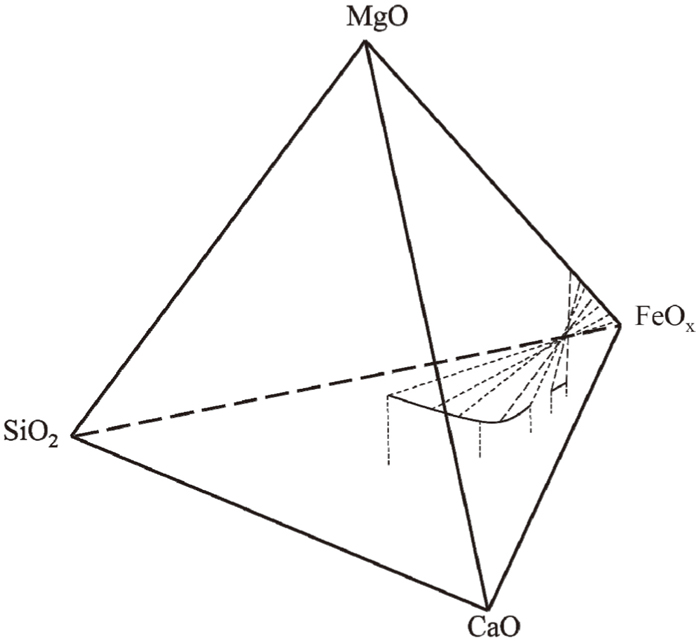
Conceptual illustration of the compositions of liquid and magnetite phases equilibrated with each other with the tie lines connecting those compositions on a compositional tetrahedron of the FeOx–CaO–SiO2–MgO system on samples No. 6, 7, 9–13, 15 and 18.
Sinters which have better gas permeability in a blast furnace are designed on the basis of the distribution ratio of MgO between the liquid and magnetite phases. In the cohesive zone of a blast furnace, the olivine-like melt is primarily formed around 1373 K,25) and then, the melt volume increases owing to the two eutectic reactions of the olivine-wüstite-C2S pseudo-ternary system in the range 1493–1503 K and the C2S- wüstite-gehlenite(2CaO·Al2O3·SiO2) pseudo-ternary system above 1487 K.5,25) In these reactions, wüstite and silicate produce the slag melt and increase the melt volume, which decreases the gas permeability. There are two proposals to avoid such a situation: one is to improve the reducibility of sinters to metallic iron so as to decrease the amount of residual wüstite in reduced sinters, and the other is to dissolve MgO into magnetite in sinters to form magnetio-ferrite. In a blast furnace, magnetio-ferrite is reduced to magnetio-wüstite, which has higher solidus and liquidus temperatures than wüstite without solid solution. Thus, magnetio-wüstite may increase the eutectic temperatures of the reactions related to the slag melt formation, i.e., the softening-melting temperatures, which makes the cohesive zone thinner and improves the gas permeability. Consequently, the present work suggests that the distribution of MgO in magnetite can be increased by increasing the C/S ratio.
In order to understand the role of MgO in the sinter produced from deteriorated iron ores, the chemical compositions of liquid in equilibrium with FeOx in the FeOx–CaO–SiO2–MgO system at 1573 K and oxygen partial pressures of 10−7 atm and 10−6 atm have been determined along with the MgO concentrations in the liquid and FeOx phases. The results obtained are summarized as follows.
(1) The liquid area in the FeOx-rich side is decreased with additions of MgO over the measurement range of the C/S ratios between 0.32 and 2.28, and is separated into two liquid areas such as the silicate-based and calcium ferrite-based liquid phases, where the C2S phase becomes stable thermodynamically in the range of the C/S ratios between 1.66 and 1.96.
(2) The ratio of MgO concentration in the liquid phase to that in the FeOx phase decreases with increasing C/S ratio from 0.36 to 2.28. This trend has been explained from the viewpoint of basicity: MgO is less basic than CaO and thereby MgO may be less stable in the liquid phase with increasing C/S ratio, resulting in smaller distribution ratios of MgO.
(3) On the basis of above findings, the role of MgO in improvement of reducibility of the sinter produced from deteriorated iron ores has been discussed as follows. The MgO distribution in magnetite should be increased with increasing the C/S ratio to form magnetio-ferrite. Magnetio-ferrite is reduced to magnetio-wüstite having higher solidus and liquidus temperatures than FeO. Magnetio-wüstite may increase the eutectic temperatures of the reactions relevant to slag melt formation, which makes the cohesive zone thinner and improves the gas permeability.