Regular Article
Reconstruction of Three-dimensional Temperature Distribution with Radiative Image by Monte Carlo Method in Blast Furnace Raceway
2017 Volume 57 Issue 12 Pages 2141-2147

Details
2017 Volume 57 Issue 12 Pages 2141-2147
This paper presented reconstruction of three-dimensional temperature distribution of raceway from radiative images based on Monte Carlo method and image processing techniques in the blast furnace. The Monte Carlo method was introduced to describe radiative heat transfer of raceway for its efficiency. Color CCD camera was used to obtain radiative information in visible spectrum of raceway. An efficient numerical inverse reconstruction model was established by the relationship between three-dimensional thermal radiation and two-dimensional radiative image. Because the reconstruction was an ill-posed inverse problem, a hybrid Tikhonov regularization method was used to determine the meaningful reconstruction. The numerical simulations were utilized for checking the validity of inverse reconstruction model before each experimental reconstruction. Experiment was done to reconstruct three-dimensional temperature distribution of 2500 m3 blast furnace raceway. Ultimately, this method could restore temperature distribution of the raceway effectively. Moreover, computational fluid dynamics (CFD) technology was applied to simulate combustion process and obtain temperature distribution of blast furnace raceway, which was compared with the reconstructed temperature distribution. All results show that the temperature distribution of raceway can be reconstructed reasonably using Monte Carlo method and image processing techniques.
Blast furnace (BF) is the most widely used technology to produce iron, where raceway is the dominant region. Many researchers1,2) have studied until now about combustion within raceway. Temperature distribution is important for the judgment, prediction and diagnosis of raceway burning state. The state of raceway effects directly on homogeneous falling of furnace charge and perpetual drippage of melting slag and iron as well as heat transfer and mass transfer of furnace, all of which guarantee the continuance and stabilization of ironmaking processing.3) Many methods for measuring temperature in a furnace have been developed in the past. In practice, the most widely applied methods are thermocouple and suction pyrometer, which have some disadvantages, such as single-point measurement and degradation in harsh environments. Optical methods base on laser technique can measure flame temperatures and their distributions.4,5) But due to the large dimensions and sealing of blast furnace and the limited power of a laser, these methods are unsuitable for blast furnaces. However, thermal radiation is the predominant mode of heat transfer in high-temperature blast furnace. By contrast, inverse radiation analysis based on radiative image processing techniques offers several advantages to measure temperature, such as high precision, non-invasion, minimal disturbance of the probed media, measurement in situ, and three-dimensional distribution. Especially, Monte Carlo method6) is popularly applied to radiative heat transfer and reconstructing temperature distribution of flames with radiative image. The comprehensive review of Monte Carlo method in radiative heat transfer has been given by Howell.7) Huai-Chun Zhou8,9,10) have numerically and experimentally reconstructed 2-D and 3-D temperature distribution of boiler furnaces using CCD cameras based on the Monte Carlo method. Fei Wang11) and Dong Liu12,13) simulated and rebuilt temperature distribution of rectangular enclosure containing inhomogeneous, anisotropically scattering media by inverse radiation analysis based on the Monte Carlo method. Even Chun Lou14) and Xiangyu Zhang15) simultaneously reconstructed temperature distributions and radiative properties by radiation analysis in an oil-fired tunnel furnace and a 600 MWe supercritical arch-fired boiler, respectively.
The most results of three-dimensional temperature distribution of raceway were acquired by numerical simulation of raceway combustion,16,17,18,19) which could not apply to judgment, prediction and diagnosis of raceway burning state in real time. But there are few study on the three-dimensional temperature distribution measurement of blast furnace raceway based on inverse radiation analysis, because the little information of raceway is acquired from the peephole and the raceway is complicated. Q Ouyang20,21) and Shengfu ZHANG22) had used radiative images to reconstruct the temperature distribution of blast furnace raceway, but they only got two-dimensional temperature distribution of raceway images, which was the accumulation and not the real temperature of raceway.
In this paper, Monte Carlo method was employed to describe the radiative heat transfer in the blast furnace raceway. Reconstruction model of three-dimensional temperature distribution of raceway is instituted based on Monte Carlo method and image processing techniques. The numerical analysis was utilized to validate the reconstruction model. An experimental study on reconstruction of a blast furnace, and computational fluid dynamics (CFD) technology was used to verify the result of reconstruction.
The experimental set-up used in this work is shown in Fig. 1.23) It mainly consists of a blast furnace and a set of image processing system. The image processing system consists of a CCD camera and a personal computer. The CCD camera is MER-125-30UC industrial color CCD camera in the black box setting in front of blast furnace peephole. And cooling gas is injected into black box to keep the CCD camera cool and the lens dust-free from inlet to outlet. The radiation in visible spectrum from raceway will be received by the color CCD camera and transferred into 24 bit RGB Windows bitmap (BMP) file. In the computer, the BMP file is composed of three monochromatic images of red, green, and blue. According to the spectroscopic responses of the CCD camera, the central wavelengths of red, green, and blue are λR 700 nm; λG 564.1 nm, and λB 435.8 nm, respectively. A WJL-11 blackbody furnace (emissivity 0.99 and temperature range from 1073 K to 3273 K) was used to calibrate the color CCD camera. Calibration values and fit curves of RGB are shown in Fig. 2.

Schematic diagram of raceway reconstruction system.

Calibration value under different temperatures.
Dedicated application software in the personal computer was used to process the radiative images, simulate radiative heat transfer by Monte Carlo method and calculate temperature distribution.
2.2. Reconstruction PrincipleIn order to calculate conveniently, the reconstructed region of raceway is assumed as three-dimensional rectangular enclosure containing inhomogeneous, emitting, absorbing and scattering medium, a mixture of gas such as CO, CO2 and H2O and suspended particles such as pulverized coal and coke. Because the vast majority of raceway image radiation comes from the part facing tuyere of raceway and the most combustion occurs in this part, the reconstructed region of raceway is only this part. Both width and height of rectangular enclosure equal the diameter of tuyere. The depth of raceway is calculated according to the modifier formula.24,25,26) All boundary is supposed to be transparent and the external radiation is ignored, which contributes little to radiative image of raceway. For processing raceway radiative image in visible spectrum, the radiation emitted, scattered and absorbed by the suspended particles is considered, while the radiation emitted and absorbed by the gaseous components in the flame is neglected, since it is significant only in the infrared region.
In this study, an inverse model was established to reconstruct three-dimensional temperature distribution of raceway. Figure 3 shows the schematic diagram of reconstructing process. It meanly consists of image acquisition, image processing, radiative simulation of raceway by Monte Carlo method and calculation. As shown in Fig. 4, the medium is divided into meshes N=Nx×Ny×Nz, whose width is W, height is H and depth is L. Radiative image pixels are divided into M elements. The radiative energy received by each image element comes from all raceway elements, so
| (1) |

Schematic diagram of reconstructing process.
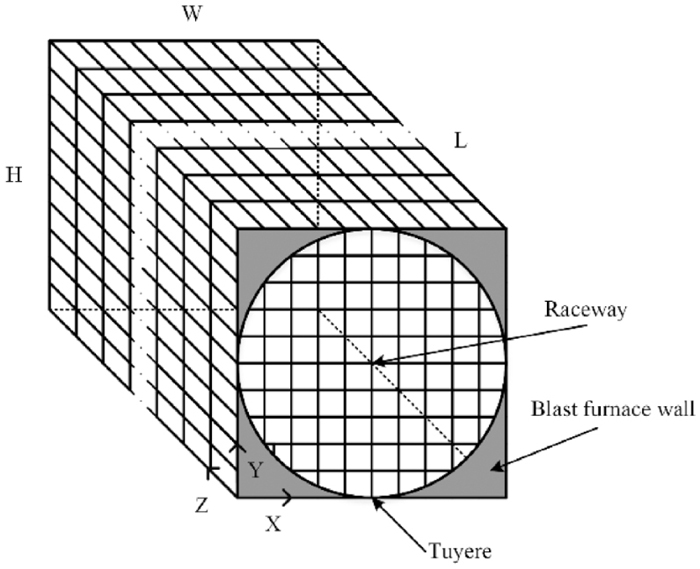
Schematic diagram of raceway grid.
Monte Carlo method has been employed to describe radiative heat transfer from raceway to virtual object plane of CCD camera and the values of READ were acquired. Then, M equations can be obtained according to Eq. (1), within visible spectrum (380 nm–780 nm) by Wien’s displacement law.
| (2) |
In order to acquire the image radiative energy E(Tm), image temperature and image emissivity should be calculated first. Besides the radiative image measured by CCD camera, image temperature Tm=(Tm,1···Tm,j···Tm,M)T of raceway radiative image can be calculated by colorimetric method27,28) from R and G radiative images:
| (3) |
| (4) |
And the image emissivity εm=(εm,1···εm,j···εm,M)T of raceway radiative image also can be calculated, when image temperature Tm is acquired:
| (5) |
According to Eqs. (4) and (5), image radiative energy E(Tm) is calculated by Eq. (6).
| (6) |
Equation (2) can be transformed into a linear matrix equation as follows:
| (7) |
| (8) |
| (9) |

Visual radiation energy under different temperatures.
Because the reconstruction is an ill-posed inverse problem, Tikhonov regularization method29) is used to solve the linear matrix equation of the ill-posed inverse problem, whose calculation principle is to find a solution E making Eq. (10) minimized. There are unitary matrices U=(u1,u2,···u2)∈RN×N and V=(v1,v2,···v2)∈RN×N so that A can express as Eq. (11). A hybrid Tikhonov regularization method30) is introduced to acquire solution as Eq. (12). The α in the Eq. (12) is chosen when the value α is smallest and the solution of each Ei is non-negative. The solution acquired from Eq. (13) should satisfy the Eq. (14).
| (10) |
| (11) |
| (12) |
| (13) |
Solve Eq. (7) for the unknown E by the hybrid Tikhonov regularization method. Once E is calculated, three-dimensional temperature distribution of raceway can be immediately obtained according to Fig. 5.
In order to validate the inverse reconstruction model, numerical analysis was utilized before each experimental reconstruction. In this part, the simulated errors of the reconstruction model was obtained by adding random errors. The measured data was simulated by adding random errors to the exact solution of the direct problem. The exact temperature distribution of raceway was assumed to be a function x, y and z, and shown in Fig. 6. The exact absorption coefficient of raceway is assumed to be homogeneous and equals 0.8 m−1, neglecting of scattering. H, W and L of rectangular enclosure equal to 0.12 m, 0.12 m and 1.6 m, respectively. The medium was divided into N=10×10×32 meshes. The radiative image pixels was divided into M=60×60 image elements. The radiative simulated result (READ values) of raceway is stabilized by Monte Carlo method, when number of simulated energy beams is larger than 1×10⁸. The number 1×10⁸ of energy beams was used in this simulation.

Three-dimensional temperature distribution used in simulating reconstruction.
To demonstrate the effect of error on the reconstruction of three-dimensional temperature distribution, the measured matrix P with random error is obtained as Eq. (14) by adding normal distribution error with average value μ and mean square deviation σ to the exact.
| (14) |
The reconstruction error of temperature distribution is defined as followed,
| (15) |
The temperature distributions were reconstructed under errors of σ=0.005, σ=0.01, σ=0.02 and σ=0.03. The reconstruction errors of temperature distribution under different σ are shown in Fig. 7. It shows that reconstruction errors are smaller than 0.14 even when σ is larger, which indicates that reconstruction model is reasonable. It also can be seen that reconstruction errors increase quickly first, but the increasing rate of reconstruction error decreases with the rise of σ. It indicates that the hybrid Tikhonov regularization method could effectively restrain the increasing rate of reconstruction error when σ is larger.

Reconstruction errors under different measurement errors.
In the experiment, the blast furnace is 2500 m3 with 30 tuyeres, whose diameter is 0.12 m. Radiative images were acquired from one tuyere raceway by color CCD camera, and 264 × 264 pixels image was extracted as shown in Fig. 8. The radiative image has three parts (raceway flame, pulverized coal and blowpipe), but only the part of raceway flame represented raceway status, which was used for reconstruction of three-dimensional temperature distribution of raceway. The calculated image temperature and image emissivity were obtained, as shown in Fig. 9. The maximum, minimum and average of image temperature are 2703 K, 2041 K and 2320 K, respectively. And the maximum, minimum and average of image emissivity are 0.54 m−1, 0.06 m−1and 0.25 m−1, respectively. But the image temperature is not the real temperature and can’t represent the there-dimensional temperature distribution of raceway, because the two-dimensional radiative image is the accumulation of all raceway elements’ radiation. The medium of the raceway was divided into N=10×10×32 meshes. The radiative image was divided into M=88×88 image elements.

Radiative image of raceway.

Calculated images.
The reconstructed temperature distributions of raceway sections are shown in Figs. 10, 11 and 12. The maximum, minimum and average of reconstructed temperature of raceway are 2731 K, 1392 K and 1808 K, respectively. Theoretical combustion temperature31) of the blast furnace raceway is about 2391 K. The average of reconstructed temperature of raceway is much smaller than theoretical combustion temperature because the reconstructed zone was the part facing tuyere of raceway, the temperature of hot blast injected in the reconstructed zone was about 1473 K and pulverized coal reacted here. The average temperature of the section Z=3 is 1396 K and smaller than hot blast because the gas was hot blast and pulverized coal volatilized. So, the reconstructed temperature of raceway is receivable. Figures 11(a) and 11(b) are temperature distributions in sections of Y=6 and X=5, respectively. As can be seen in Fig. 11, the temperature first increases and then decreases along the depth of raceway. Because the temperature of hot blast is about 1473 K, the temperature of raceway zone near tuyere is lower. With the combustion of pulverized coal and heat transfer, temperature increases along the depth of raceway and reaches its maximum at the depth about 1.1 m. However, carbon reacted with carbon dioxide with absorption of heat when oxygen burned out, so that temperature decreased. Temperature distributions in sections of Z=3, Z=13, Z=23 and Z=28 are shown in the Fig. 12. It can be seen that the temperature distributions of sections are not homogeneous, because the injection of the pulverized coal and hot blast.

Three-dimensional temperature distribution reconstructed of raceway.

Temperature distributions in horizontal sections.

Temperature distributions in vertical sections.
In order to verify the accuracy of the reconstruction model, CFD technology is used to simulate the raceway combustion and get the temperature distribution of raceway. The gas phase is described a set of 3D, steady-state Reynolds-averaged Navier–Stokes equations with the standard k-ε turbulence model. The pulverized coal particles are treated as a dispersed phase using a Lagrangian method subject to the assumption that each particle followed a discrete trajectory without interactions with any of the other particles.19) Due to the high temperature of the raceway, the chemical reaction rate is fast compared to the fluid mixing rate. Therefore, non-premixed combustion model is chosen to calculate the combustion reaction. A three dimensional model is developed to simulate the pulverized coal combustion in furnace based on the 2500 m3 blast furnace. Based on the measured results of blast furnace and cold test results,32) the raceway is simplified as a sphere. The geometry of the raceway is shown in Fig. 13. In the simulation, the porous medium is used to replace the coke bed surrounding the raceway. Due to the purpose of simplifying the model and the limitation of software, only coal burning was considered in the simulation. The parameters in the CFD numerical simulation are shown in Table 1.

Schematic diagram of CFD simulation model geometry.
| Operating conditions | Pulverized coal (wt/%) | ||
|---|---|---|---|
| Blast rate | 205 m/s | Fixed carbon | 55 |
| Blast temperature | 1473 K | Volatile matter | 33 |
| Coal ratio | 148 kg/t | Ash | 9 |
| Pulverized coal temperature | 318 K | ||
| Moisture | 3 | ||
| Oxygen-enrichment | 4% | ||
Figure 14 is the isothermal diagram of blast furnace raceway in the CFD simulation, and temperature distribution of raceway was extract from isothermal diagram, corresponding to region reconstructed. The average temperatures of all sections in the direction of z axis were calculated. Figure 15 shows the simulated average temperatures compared with reconstructed temperatures under different sections of the partial raceway facing tuyere. It can be seen that the variation tendency of reconstructed temperature distribution is the same as the result of CFD numerical simulation. And the difference between the two methods is small. So, the inverse reconstruction model is reasonable.

Isothermal diagram of CFD simulation.

Reconstructed and simulated temperatures under different sections.
The reconstruction model of three-dimensional temperature distribution was successfully established in blast furnace raceway based on Monte Carlo method and image processing techniques. A hybrid Tikhonov regularization method was used to solve the ill-posed inverse problem, which could effectively restrain reconstruction errors. The validity of the method was verified through a detail numerical analysis and the reconstruction error of the method was small, which indicates the method is feasible to reconstruct temperature distribution of raceway. The temperature distribution of reconstruction was compared with the temperature distribution of CFD numerical simulation. The variation tendency of the reconstructed temperature is the same as the simulated temperature and the difference between the two methods is small, which also certify that the reconstruction model is reliable. Therefore, the proposed method is suitable for the reconstruction of temperature distribution of raceway. The reconstructed results of the raceway can be widely applied to the non-contract measurement of temperature distribution, combustion diagnostic and control of blast furnace raceway in real time.
The authors would gratefully acknowledge the financial support from the National Natural Science Foundation of China (No. 61271303, 61571040).