Abstract
Prior to electrodeposition, steel sheets underwent polishing using emery paper, buff, and then electrolytic polishing. Zn deposition was performed galvanostatically at 1500 A/m2 in an agitated sulfate solution at 40°C to investigate the effect of the surface textures of steel sheets on the crystal orientation of Zn. The strain of the steel surface and the decrease in Fe grain size due to this strain were largest with emery paper polishing, then with buff polishing, then when unpolished, and were smallest after electrolytic polishing. The preferred orientation of the {0001} Zn basal plane of the hcp structure was largest with electrolytic polishing, and decreased in the following order: unpolished, buff polishing, and then with emery paper polishing. Thus, the preference of the {0001} orientation of Zn increased with decreasing the strain of steel sheets and increasing the grain size of Fe. With electrolytic polishing, the strain applied to the steel sheets was decreased, the grain size of Fe increased, and therefore the epitaxial growth of deposited Zn occurred easily. The initial Zn deposits appeared to grow epitaxially as indicated by the orientation relationship of {111}Fe//{0001}Zn because the preferred orientation of the steel substrate used in this study is {111} Fe. The preferred orientation of {0001} Zn seems to be more common under conditions where the epitaxial growth of deposited Zn is easy to occur.
1. Introduction
Electrogalvanized steel sheets coated with transparent organic composite films are extensively used in electrical appliances because functional conversion-coated steel sheets have excellent resistance to corrosion and fingerprints. The lightness and gloss of electrogalvanized steel sheets respectively correspond to the intensity of diffused reflection and regular reflection of light and depend on the microsurface roughness of deposited Zn. When the deposited Zn has a preferred crystal orientation of the {0001} plane, both the lightness and gloss increase due to an increased smoothness.1,2,3,4) The coefficient of friction of electrogalvanized steel sheets, determined by flat sliding tests, decreases with increased orientation occurrence of the {0001} Zn plane.5,6,7) This is attributed to a decrease in shear stress of drawing direction with increased {0001} Zn planes, or can be due to the sliding surface. However, in the case of the formation of deposits of Zn by high tension, when the Zn has a preferred orientation of {0001}, the deposits are likely to break.5,8) In contrast, when the deposited Zn shows the orientation of pyramidal planes such as {1013}, {1012}, {1122} and {1011}, the deposits are less likely to break.8) Since the properties of electrogalvanized steel sheets is largely determined by the crystal orientation of deposited Zn, it is important to control the crystal orientation of Zn within the proper range to improve these properties. Therefore, there have been numerous studies concerning the effects of electrolysis conditions,9,10,11,12) types of electrolyte,13,14,15,16) the addition of inorganic17,18,19,20,21) and organic compounds22,23,24,25,26,27,28) to the solution, and the preadsorption of organic additive on the morphology of deposited Zn. However, the effect of surface textures of steel sheets on the crystal orientation of Zn deposits has rarely been evaluated29,30,31,32) and, in the few previous studies concerning surface textures, there are many ambiguities regarding their effects. In this study, prior to Zn deposition, the steel sheets were polished using methods such as emery paper, buff, and electrolytic polishing, and the effects of surface textures, such as the strain, crystal grain size, orientation, and roughness of steel sheets on the crystal orientation, morphology, and lightness of deposited Zn were investigated.
2. Experimental
The electrolyte composition and conditions of electrolysis for Zn deposition are listed in Table 1. The electrolytic solution was prepared by dissolving reagent-grade ZnSO4·7H2O (1.2 mol/L) and Na2SO4 (0.56 mol/L) in distilled and deionized water. The pH was adjusted to 2.0 using sulfuric acid. Polycrystalline steel sheets of 3 × 3 cm2 conforming to the Japanese Industrial Standard (JISG 3141) were used as cathode substrates. Each substrate was polished with emery papers (No. 320, 600, 1500 and 2000), buffed and electropolished to mirror smoothness before the electrodeposition process. During each process of polishing with emery papers, the substrate was washed in ethanol by ultrasonic cleaning to eliminate abrasive particles and iron powder. Buffing was performed using the solutions suspended by Al2O3 powders of 1, 0.3, and 0.1 μm grain sizes as a polishing agent. Electropolishing was performed at a cell voltage of 4.4 V and at room temperature for 60 minutes in 500 mL of H3PO4 solution containing 1.69 mol of H2CrO4. In this study, i) polishing with emery papers, ii) buffing, and iii) electropolishing are defined as i) only polishing with emery papers; ii) polishing with emery papers and buffing; and iii) polishing with emery papers, buffing, and electropolishing. Zn electrodeposition was performed in solutions agitated at 400 rpm using a stirrer under coulostatic (3.3 × 10³ to 6.6 × 10⁴ C/m2) and galvanostatic (1500 A/m2) conditions at 40°C. Assuming that the current efficiency for Zn deposition is 90%, Zn deposits at coating mass of 0.304 mg/m2 with an amount of charge 1 C/m2. A platinum mesh measuring 8 × 12 cm2 was used as the anode. Cathode potentials were measured using a saturated KCl, Ag/AgCl reference electrode [0.199 V vs. the normal hydrogen electrode (NHE), 25°C]. These potentials were plotted with reference to the NHE.
Table 1. Electrolysis conditions.
| Bath composition | ZnSO4·7H2O | (mol/L) | 1.2 |
| Na2SO4 | (mol/L) | 0.56 |
| pH | | 2 |
| Operating conditions | Current density | (A/m2) | 1500 |
| Amount of charge | (C/m2) | 3.3×10³~6.6×10⁴ |
| Temperature | (°C) | 40 |
| Cathode | | Fe(3×3 cm2) |
| Anode | | Pt(8×12 cm2) |
| Stirrer | (rpm) | 400 |
The surface morphologies of steel sheets and deposited Zn was observed by SEM. The crystal orientation of Fe and deposited Zn was determined using the method of Wilson and Rogers33) utilizing an X-ray diffraction intensity of 110 to the 222 and 0002 to the 1122 reflection. The crystallite size for the deposited Zn was calculated by Scherrer’s equation34) using the half-width of the X-ray diffraction peak of the 0002 reflection. The surface roughness of Zn was evaluated by centerline average roughness Ra (JIS B 0601), using a SURFCOM1500DX-3DF (Tokyo Seimitsu Co.). The lightness of Zn was measured by a colorimeter (CM-512 m3; Konica Minolta Co.), using the 0-d method (JIS-Z-8722), for diffuse illumination/0° viewing angle. Both the specular component excluded (SCE) and specular component included (SCI) methods were applied to evaluate lightness. For the SCE method, only diffuse reflectance light, with the exception of regular reflection, was measured to approach human visual estimation. For the SCI method, the total reflectance light, including regular reflection, was measured to evaluate the inherent lightness of the material. The crystal orientations of cross section of steel sheets were investigated by their electron back-scattering diffraction patterns (EBSD). Prior to EBSD, Ni plating of 5 µm thickness was applied to protect the surface of steel sheets, and the cross section of steel sheets was polished to a mirror finish using aluminum powders with grain sizes of 1, 0.3, and 0.1 μm, after which etching was performed by Ar ion milling. To evaluate the strain distribution in the Fe crystal grain, the kernel average misorientation (KAM) maps of cross section of steel sheets, which quantifies local misorientation in the crystal grain, were measured by EBSD.
3. Results
3.1. Effect of Each Polishing on the Surface Textures of Steel Sheets
Figures 1 and 2 show respectively crystal orientation images and KAM maps by EBSD of the cross sections of steel sheets processed by each mode of polishing. In an unpolished steel sheet (Figs. 1(a) and 2(a)), the crystal grain size decreased, and a KAM map shows that some strain remains at the surface of the sheets. In a sheet polished with emery papers (Figs. 1(b) and 2(b)), a large number of deformed fine grains were observed at the surface, and a KAM map indicates that a higher degree of strain remains than in the case of the unpolished steel sheet. After polishing with emery papers, the deformed surface layer was removed, but residual stress was induced by the polishing. Since the strain increased during polishing with emery papers, it can be assumed that the deformed surface layer was small in an unpolished steel sheet. In a steel sheet with buffing (Figs. 1(c) and 2(c)), a large number of deformed fine grains were observed at the surface as with the steel sheet polished with emery papers, and a KAM map indicates that the stronger strain remains. The degree of deformation and decrease in size of crystal grains was somewhat smaller in a steel sheet with buffing than that polished by emery papers, showing that the strain at the surface is somewhat smaller in the steel sheet with buffing. Since the deformed layer of the surface was removed with buffing, the strain introduced by polishing with emery papers seemed to decrease somewhat. However, the strong strain remained after buffing, and it is thus assumed that the strain introduced by polishing with emery papers remains and is increased by buffing. On the contrary, a decrease in the size of crystal grains were not seen at the surface of the electropolished steel sheets (Figs. 1(d) and 2(d)), and a KAM map shows that the strain is small. From the results mentioned above, the strain at the surface of steel sheets and the degree of decrease in size of crystal grain was largest in the steel sheet polished with emery papers and decreased in the following order: buffing, unpolished, and electropolishing.

Figure 3 shows SEM images of the surfaces of steel sheets processed by each type of polishing. Crystal grain boundaries could be observed in unpolished steel sheets (Fig. 3(a)), whereas for sheets polished by emery paper and buffed, these grain boundaries were obscure and instead the concavity resulting from cracks was more obvious (Figs. 3(b)–3(c)). Slight roughness was observed in the area except for concavity in the steel sheets of (a) to (c). On the contrary, the electropolished steel sheets (Fig. 3(d)) exhibited smooth surfaces and grain boundaries.

Figure 4 shows the Fe crystal orientations on the surfaces of steel sheets polished with each method. The preferred crystal orientation of Fe was the {111} plane irrespective of the type of polishing used, and this was strongly expressed by the electropolished steel sheet in particular. The prevalence of the preferred orientation of {111} was somewhat reduced in steel sheets polished by emery papers and buff when compared with unpolished steel sheets.
3.2. Effect of Polishing on the Surface Morphology of Deposited Zn
Figure 5 shows SEM images of the surfaces of Zn deposited with a coating mass of 2 g/m2 on steel sheets after each polishing method. Zn deposits comprising small granular crystals were observed over the entire surface of the unpolished steel sheets (Fig. 5(a)) and after polishing with emery papers (Fig. 5(b)) and buff (Fig. 5(c)). A crack-like concavity resulting from the steel sheet was observed. On the contrary, Zn deposits on the electropolished steel sheet (Fig. 5(d)) were smooth. When the preferred orientation of deposited Zn is the {0001} basal plane of the hcp structure, the platelet crystal of Zn becomes parallel to the steel sheet. After electropolishing, the preferred orientation of deposited Zn seems to be the {0001} plane.

Figure 6 shows SEM images of surfaces of Zn deposited with a coating mass of 10 g/m2 on steel sheets after each polishing method (cf. Fig. 5). Layered hexagonal platelets of Zn grew randomly both on unpolished steel sheets (Fig. 6(a)), after polishing with emery papers (Fig. 6(b)), and after polishing with buff (Fig. 6(c)). The basal plane of the Zn hcp structure was parallel to the steel sheets, indicating that the preferred orientation plane of deposited Zn was {0001}. On the contrary, after electropolishing, Zn platelet crystals mostly grew parallel to steel sheets and were layered regularly in each studied area (Fig. 6(d)). It was found that Zn deposits growing epitaxially comprised layered thin hexagonal platelet crystals and that the direction of layers changed at the grain boundary of steel sheets.12) The regular layers of Zn platelet crystals at every studied area can be attributed to the epitaxial growth of Zn, i.e., after electropolishing, deposited Zn seems to have an orientation preferred to the {0001} plane and grows epitaxially from the viewpoint of the surface morphology.

Figures 7 and 8 show the crystal orientation of Zn deposited on steel sheets after polishing with each method. Deposited Zn showed an orientation preferred to the {0001} plane irrespective of the method of polishing; however, the degree of orientation of the {0001} Zn plane differed between polishing types. Without polishing [Fig. 7(a)], the orientation index of the {0001} Zn plane was high from the initial stage of deposition, and increased further with an increased coating mass of Zn. After polishing with emery papers [Fig. 7(b)] and buff [Fig. 8(c)], the preferred orientation of {0001} Zn plane at the initial stage of deposition was less apparent than that without polishing. Comparing the polishing with emery papers against that by buff, a preferred orientation along the {0001} Zn plane was generally more dominant with polishing by buff. On the contrary, with electropolishing [Fig. 8(d)], the preferred orientation of the {0001} Zn plane was significantly enhanced from the initial stage of deposition comparing with other types of polishing.

Since the crystal orientation of deposited Zn is reported to depend on overpotential for deposition,9,11) the effect of each polishing step on the overpotential for Zn deposition was also investigated. Figure 9 shows changes in cathode potential with time during Zn deposition on steel sheets after each type of polishing. The shift of cathode potential to the less noble direction means an increase in overpotential for Zn deposition. Since the cathode potential was measured five times during each polishing step and a deviation of 5–10 mV was observed, the moderate profiles are shown in Figs. 9(a) and 9(b). Figure 9(b) shows that the difference in potential for Zn deposition during the polishing was within 5 mV, which is within the error in measurement, i.e., a meaningful difference in potential for Zn deposition was not observed.

Figure 10 shows the crystallite size of Zn deposited on steel sheets polished with each method. The crystallite size of deposited Zn increased with coating mass irrespective of the type of polishing. When using a coating mass of 20 g/m3, a difference in Zn crystallite size was observed between polishing types, although this was rarely seen when the coating mass was less than 10 g/m2. The measured Zn crystallite size was approximately 30–80 nm, and the grain size of Zn platelet crystals was several micrometers, as shown in Fig. 6. It was found that hexagonal platelets of deposited Zn comprise many particles with sizes up to several tens of nanometers35) and that crystallite size determined using the half-width of X-ray diffraction peaks appears to correspond to the size of each particle forming the hexagonal platelets of Zn. As shown in Fig. 6, with electropolishing of steel sheets, the grain size of Zn platelet crystals increased, but the size of Zn crystallites did not increase, demonstrating that there is no correlation between the size of platelet crystals and the size of crystallite. An increase in the size of Zn platelet crystals with electropolishing can be attributed to an increase in epitaxial growth of Zn. The size of each particle forming the hexagonal platelets of Zn is rarely found to increase with electropolishing.

Figure 11 shows the surface roughness of Zn deposited after each method of polishing. The surface roughness increased with the coating mass of Zn irrespective of the polishing type. The degree of increase in surface roughness of Zn with coating mass was identical irrespective of the type of polishing, and the surface roughness of Zn primarily depended on the roughness of the steel sheets. The surface roughness of steel sheets is significantly decreased with polishing by emery papers, and further decreased with buffing. With electropolishing after buffing, the surface roughness of steel sheets further decreased, which corresponded with surface SEM images of steel sheets shown in Fig. 3. Although the surface roughness of deposited Zn depends on both the crystal orientation index of the {0001} Zn plane and the size of Zn platelet crystals,9,29,30) it was notably affected by the original surface roughness of steel sheets.
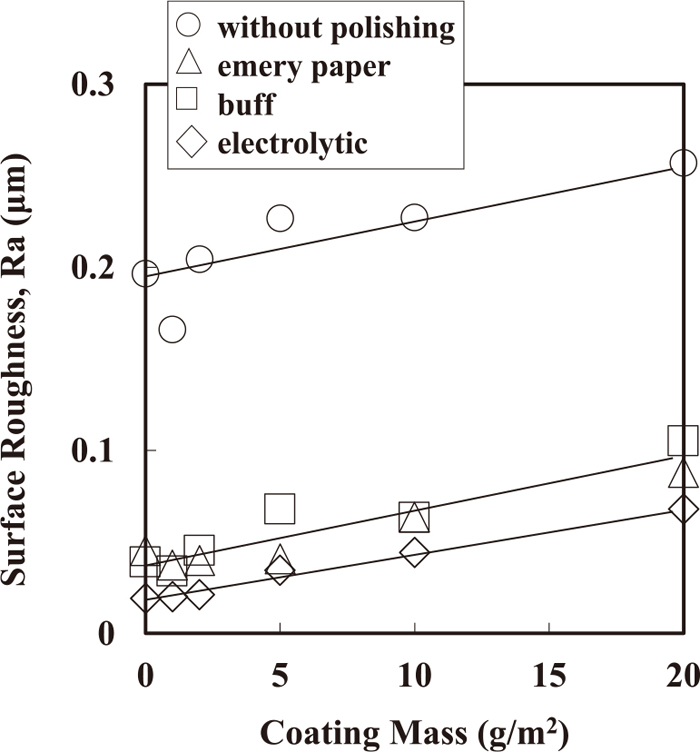
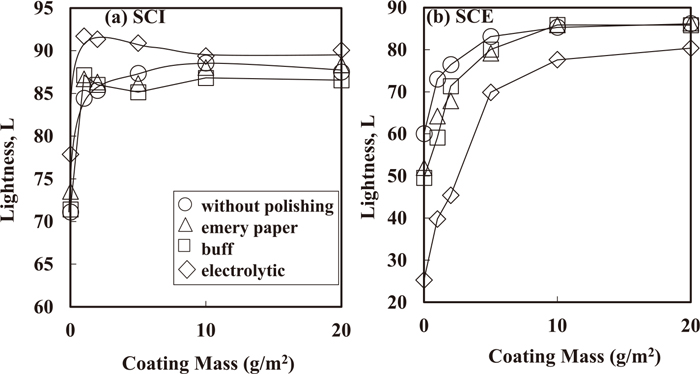
Figure 12 shows the lightness of Zn deposited on steel sheets after each method of polishing. In the SCI method to evaluate the inherent lightness of the material by the total reflectance light, including regular reflection, the lightness of deposited Zn was found to be higher after electropolishing, although the difference in lightness between electropolishing and other polishing treatments became small with increasing coating mass of Zn. In the SCE method—which approaches the visual estimation of a human by considering only diffuse reflectance light, with an exception of regular reflection—the lightness of deposited Zn increased with coating mass of Zn, and the lightness was highest without polishing at coating mass of Zn below 5 g/m2, while the lightness was lowest with electropolishing at all the coating mass of Zn. With electropolishing, the surface roughness decreases, resulting in an increase in intensity of regular reflection. As a result, with electropolishing, the lightness evaluated by the SCI method was highest, and was lowest by the SCE method. Although the lightness of deposited Zn depends on both the crystal orientation index of the {0001} Zn plane and the size of Zn platelet crystals,29,30) the lightness seems to be mostly affected by the surface roughness of steel sheets.
4. Discussion
Since the appearance and press formability of Zn coated steel sheets depend on the crystal orientation index of the {0001} Zn plane,1,2,3,4,5,6,7,8) suggestions can be made regarding the relationship between the orientation of the {0001} plane and surface textures of steel sheets. Table 2 shows the relationship between the surface textures of steel sheets after polishing with the methods used here and the preferred orientation of the{0001} plane of deposited Zn. The strain at the surface of the sheets and the degree of decrease in crystal grains sizes were both largest in the sheet polished by emery papers, and thereafter decreased in the following order: buffed, unpolished, and then electropolished sheets. The preferred orientation of the {0001} plane of deposited Zn was most present in steel sheets after electropolishing, and then decreased in the order of unpolished, buffed, and polished by emery papers. This indicates that the orientation index of the {0001} plane increases with decreasing strain at the steel surface and with increasing grain size. SEM images of the surfaces of deposited Zn (Fig. 6) show that deposited Zn grows epitaxially with the greatest efficiency on steel sheets that have undergone electropolishing. Cases wherein the epitaxy between deposited Zn and steel sheets decreases, the orientation index of the {0001} Zn plane is reported to decrease.11) This indicates that when the inclination of Zn basal plane to steel sheet surface is small or the orientation index of {0001} Zn plane is large, deposited Zn is more likely to grow epitaxially. In other words, Zn is likely to grow epitaxially when its preferred orientation is the {0001} plane. During Zn deposition on an α-Fe substrate, the initial deposits are known to grow epitaxially according to Burgers’ orientation relationship, which is described as {110}Fe//{0001}Zn, [111]Fe//[1120]Zn.13,36,37,38,39) In addition, Zn deposits have been reported to grow epitaxially according to the relationship of {111}Fe//{0001}Zn.40) The misfit ratio of {110}Fe and {0001}Zn is 10.4%, while that of {111}Fe and {0001}Zn is 13.9% (both misfit ratios are small). Since the preferred orientation of steel sheets in this study is {111}, the initial Zn deposits seem to grow epitaxially according to the relationship of {111}Fe//{0001}Zn. After polishing steel sheets with emery papers and buff, a strain is introduced at the surface and the grain size of steel decreases. As a result, epitaxial growth seems to be suppressed. The epitaxial growth of Zn is expected to be most suppressed on steel sheets polished with emery papers, and decreasingly suppressed in the following order: buffed, unpolished and electropolished. Therefore, when polishing using emery papers and buff, the preferred orientation of the {0001} plane of deposited Zn seems to decrease. The orientation index of {111} Fe plane was largest after electropolishing, and decreased in the following order: without polishing, polishing with buff and emery papers. (Fig. 4) This order corresponds to that of the preferred orientation of the {0001} Zn plane, indicating that the orientation index of {111} Fe plane also affects the orientation of the {0001} Zn plane.
Table 2. Relationship between steel sheet surface textures for unpolished sheets and sheets after polishing with emery paper, buff and electropolishing. Preferred orientations of the {0001} plane of deposited Zn are indicated.
| Fe | Strain | Electrolytic < Polishing-free < Buff < Emery |
| Grain size | Electrolytic > Polishing-free > Buff > Emery |
| Roughness | Electrolytic < Buff ≦ Emery < Polishing-free |
| {111} | Electrolytic > Polishing-free > Emery ≒ Buff |
| Zn | {0001} | Electrolytic > Polishing-free > Buff > Emery |
| Epitaxy of Zn/Fe | Electrolytic > Polishing-free Buff Emery |
| Overpotential | Electrolytic ≒ Polishing-free ≒ Buff ≒ Emery |
The surface roughness of the studied steel sheets was smallest after electropolishing, and increased in the following order: polishing with buff, polishing with emery papers, and without polishing. This order does not correspond to that of the prevalence of the preferred orientation of the {0001} plane, which indicates that the effect of surface roughness on the orientation of {0001} Zn is small. It has been reported that the crystal orientation of Zn deposited on the steel sheets depends on the deposition overpotential, and the orientation index of {0001} Zn decreases with increasing deposition overpotential according to Pangarov’s theory.41,42,43) However, since an effect from the polishing process on the overpotential for Zn deposition was not observed in this study, the effect of deposition overpotential on the relationship between the orientation of {0001} Zn and the surface textures of steel sheets seems to be negligible. When the epitaxy of Zn/steel decreases, the growth direction of Zn becomes random, resulting in decreasing Zn grain size. The increase in the size of Zn platelet crystals after electropolishing can be attributed to the increase in epitaxial Zn growth. At the coating mass of deposited Zn above 10 g/m2, the preferred orientation of {0001} Zn plane significantly increased regardless of kind of polishing. (Figs. 7 and 8) Since Zn deposition was performed at 1500 A/m2, and the deposition potential was small, approximately 0.032 V, the preferred orientation of deposited Zn seems to be {0001} plane from the overpotential theory developed by Pangarov. At the coating mass of deposited Zn above 10 g/m2, the epitaxial growth of Zn decreases, as a result, the orientation of deposited Zn seems to be more affected by the deposition potential than by the surface textures of steel sheets.
5. Conclusion
Prior to electrodeposition, steel sheets were polished with several methods—emery paper, buff, and electrolytic polishing—and the effect of their surface textures on Zn crystal orientation was investigated. The strain of the surface and the degree of decrease in Fe grain size induced by this strain were largest with polishing by emery paper, thereafter decreasing in the following order: polishing with buff, unpolished sheets, and electrolytic polishing. The preferred orientation of the {0001} Zn basal plane of the hcp structure was most prominent with electrolytic polishing, which decreased in the following order: unpolished, buff polishing, and polishing with emery paper. This suggests that the preferred orientation of the {0001} Zn plan increased with decreasing strain and increasing Fe grain size. After electrolytic polishing, since the strain of steel sheets decreased and the grain size of Fe increased, the epitaxial growth of deposited Zn could occur easily. The initial Zn deposits seemed to grow epitaxially according to the orientation relationship {111}Fe//{0001}Zn because the preferred orientation of the steel substrate used in this study was {111} Fe. The preferred orientation of the {0001} Zn seems to increase under conditions where the epitaxial growth of deposited Zn occurs readily.
References
- 1) H. Nakano, S. Oue, M. Iwai, T. Akiyama and H. Fukushima: Tetsu-to-Hagané, 86 (2000), 584.
- 2) H. Nakano, S. Oue, S. Taniguchi, S. Kobayashi and H. Fukushima: Tetsu-to-Hagané, 93 (2007), 763.
- 3) H. Nakano: Trans. Nonferrous Met. Soc. China, 19 (2009), 835.
- 4) K. Ishii, M. Kimoto and A. Yakawa: 4th Int. Conf. on Zinc and Zinc Alloy Coated Steel Sheet (GALVATECH ’98), ISIJ, Tokyo, (1998), 547.
- 5) V. Rangarajan, D. K. Mallock and G. Kraus: Zinc-based Steel Coating Systems, Metallurgy and Performance, TMS, Pennsylvania, (1990), 263.
- 6) V. Rangarajan, N. Giallourakis, D. K. Matlock and G. Krauss: J. Mater. Shaping Technol., 6 (1989), 217.
- 7) T. Ono and M. Yoshida: CAMP-ISIJ, 4 (1991), 1626.
- 8) G. J. Wenzloff, C. J. Van Tyne and D. K. Matlock: The Physical Metallurgy of Zinc Coated Steel, TMS, Pennsylvania, (1993), 275.
- 9) M. Sagiyama, M. Kawabe and T. Watanabe: Tetsu-to-Hagané, 76 (1990),1301.
- 10) H. Nakano, H. Fukushima, T. Akiyama and R. Kammel: Metall, 58 (2004), 722.
- 11) H. Nakano, K. Araga, M. Iwai and J. Kawafuku: Tetsu-to-Hagané, 83 (1997), 785.
- 12) H. Nakano, K. Araga, M. Iwai and J. Kawafuku: Tetsu-to-Hagané, 83 (1997), 635.
- 13) H. Ohtsubo, T. Matsumoto, K. Nakai and Y. Ohmori: ISIJ Int., 34 (1994), 1002.
- 14) Y. B. Yim, W. S. Hwang and S. K. Hwang: J. Electrochem. Soc., 142 (1995), 2604.
- 15) C. Alley, P. Drillet, J. C. Charbonnier, M. Guttmann, A. Takahashi, M. Nakazawa and Y. Miyoshi: 3rd Int. Conf. on Zinc and Zinc Alloy Coated Steel Sheet (GALVATECH ’95), ISIJ, Tokyo, (1995), 371.
- 16) T. Yamashita and N. Haga: J. Met. Finish. Soc. Jpn., 40 (1989), 343.
- 17) H. Nakano, K. Araga, M. Iwai and K. Miki: Tetsu-to-Hagané, 85 (1999), 806.
- 18) A. R. Ault and E. J. Frazer: J. Appl. Electrochem., 18 (1988), 583.
- 19) H. Nakano, S. Oue, S. Taniguchi, S. Kobayashi and H. Fukushima: ISIJ Int., 48 (2008), 634.
- 20) M. M. Jaksic: Surf. Technol., 24 (1985), 193.
- 21) M. Maja, N. Penazzi, R. Fratesi and G. Roventi: J. Electrochem. Soc., 129 (1982), 2695.
- 22) H. Nakano, K. Araga, M. Iwai and J. Kawafuku: Tetsu-to-Hagané, 84 (1998), 339.
- 23) D. J. Mackinnon, J. M. Brannen and R. M. Morrison: J. Appl. Electrochem., 18 (1988), 252.
- 24) H. Nakano, S. Oue, T. Miki, S. Kobayashi and H. Fukushima: ISIJ Int., 46 (2006), 106.
- 25) H. Nakano, S. Oue, T. Miki, S. Kobayashi and H. Fukushima: Tetsu-to-Hagané, 92 (2006), 501.
- 26) U. Lindborg, S. Ramsin, L. Lind and L. Revay: Plating, 61 (1974), 1111.
- 27) P. A. Adcock, A. R. Ault and O. M. G. Newman: J. Appl. Electrochem., 15 (1985), 865.
- 28) C. Beshore, B. J. Flori, G. Schade and T. J. O’Keefe: J. Appl. Electrochem., 17 (1987), 765.
- 29) H. Nakano, T. Ura, S. Oue and S. Kobayashi: ISIJ Int., 54 (2014), 1653.
- 30) H. Nakano, S. Oue, Y. Hamaguchi, S. Kobayashi and H. Fukushima: ISIJ Int., 49 (2009), 1769.
- 31) H. Nakano, T. Ura, S. Oue and S. Kobayashi: Tetsu-to-Hagané, 99 (2013), 700.
- 32) H. Nakano, S. Oue, Y. Hamaguchi, S. Kobayashi and H. Fukushima: Tetsu-to-Hagané, 96 (2010), 371.
- 33) K. S. Willson and J. A. Rogers: Tech. Proc. Am. Electroplat. Soc., 51 (1964), 92.
- 34) T. Watanabe: J. Surf. Finish. Soc. Jpn., 40 (1989), 280.
- 35) K. Kondo, T. Murakami, F. Cerwinski and K. Shinohara: ISIJ Int., 37 (1997), 140.
- 36) Y. Ohmori, K. Nakai, H. Ohtsubo, T. Yagi and T. Matsumoto: ISIJ Int., 33 (1993), 1196.
- 37) K. Kamei and Y. Ohmori: J. Appl. Electrochem., 17 (1987), 821.
- 38) K. Nakai, H. Ohtsubo and Y. Ohmori: Materia Jpn., 33 (1994), 1467.
- 39) T. Furuhara, N. Sugita and T. Maki: ISIJ Int., 36 (1996), 584.
- 40) M. Kurosaki: Dr. thesis, Kyoto University, (2009), https://repository.kulib.kyoto-u.ac.jp/dspace/bitstream/2433/77994/1/D_Kurosaki_Masao.pdf, (accessed 2009-03-23).
- 41) N. A. Pangarov: J. Electroanal. Chem., 9 (1965), 70.
- 42) N. A. Pangarov: Electrochim. Acta, 9 (1964), 721.
- 43) H. Nakano and H. Fukushima: Tetsu-to-Hagané, 88 (2002), 236.


