Abstract
Pre-oxidation in air at 750°C for 10 min, the plain carbon steels without Cr and containing 0.4 wt.% Cr tended to rapidly form oxide scale composed of outer Fe3O4 layer and inner FeO layer. Moreover, a FeCr2O4 layer was observed at the FeO/substrate interface on the steel containing Cr. A comparative study was carried out between the scales on the two steels in inert gas cooled from 350–600°C to room temperature at the cooling rate range of 1–40°C/min, to determine the effect of low concentration Cr addition on the phase transformation of FeO. Based on the cross-sectional morphologies of oxide scale during various cooling conditions, the relationship between cooling rate and start cooling temperature were constructed, and the area fraction of eutectoid structure was analyzed. The result shows that the transformation rate and area fraction of eutectoid structure in oxide scale on steel containing Cr were greater than that on steel without Cr, and then the nucleation, growth and 100% transformation region of eutectoid structure in oxide scale on steel without Cr were delayed. This study proposed two mechanisms to discuss the experimental results. Firstly, the formation of FeCr2O4 layer reduced the consumption of O, and then prevented short-range uphill diffusion of Fe from FeO to substrate. Secondly, combined with the lamellar spacing in eutectoid structure and the Fe–Cr–O equilibrium phase diagram, the Cr addition increased the formation temperature of FeO in oxide scale, which provided sufficient driving force for eutectoid transformation during continuous cooling.
1. Introduction
Recently, the surface quality of hot rolled steel strip has been considered as an important qualification to determine the product quality with the general increasing requirement of commercial steel strip. The fine control of oxide scale is essential to maintain the high surface quality of products during the hot rolled process.1) The formation temperature of oxide scale is above 560°C, and it is comprised of a thin outer hematite (Fe2O3) layer, an intermediate magnetite (Fe3O4) layer, and a thick inner wüstite (FeO) layer. After hot rolled process, as shown in Fig. 1, the steel strips are coiled and stacked, and slowly cooled down to room temperature. The Fe–O binary equilibrium phase diagram in Fig. 2 indicates the FeO in oxide scale will start to decompose below 560°C. In the cooling stage of steel strip, the significant differences appear in the microstructure of oxide scale due to the different start cooling temperatures and cooling rates.2,3) The different phase composition can affect the properties of oxide scale, such as tribological properties,4) spallation and adhesion model,5,6,7) mechanical descaling,8,9) pickling descaling,10,11) and gaseous reduction descaling.12,13,14,15)


Therefore, the research of phase transformation behavior of FeO in oxide scale has become a hotspot in recent years.16,17,18,19,20,21,22,23) Based on the previous studies, it is worth noting that the chemical composition of steel also affects the phase transformation of FeO besides start cooling temperature, isothermal time and cooling rate. Shizukawa and Yoneda21,24) proposed the effect of Mn, Au addition to steel on eutectoid transformation of FeO in oxide scale. Mn addition decreases the driving force for the FeO decomposition via eutectoid reaction, and extends the FeO phase region to lower temperature. Au addition suppresses the precipitation of magnetite seam, and accelerates the eutectoid reaction. Additionally, with the development of low alloy high strength steels, a small amount of Cr below 1.5 wt.% is added to stabilize the under-cooled austenite and then decreases the hot-rolled temperature to ensure that the dynamically transformed nano-grained ferrite is thermally stable.25) In hot rolled process of steel containing Cr, the Cr-oxides can form on the steel surface even if the Cr concentration in steel is low,26,27) these oxides will affect the surface quality of low alloy steel. So far, a lot of previous studies28,29,30,31) focused on the effect of Cr addition on the corrosion resistance of high Cr steel at high temperatures and complex atmospheres of working, such as for using in furnace parts, steam lines and exhaust gas systems, etc. However, these research results of high Cr concentration at high temperature oxidation behavior cannot be completely applied to analyze the growth of oxide scale on steel containing low Cr concentration because the mass percent of Cr in high Cr steel is always above 5%. The appropriate addition of Cr in the composition design of structural steel can help increase oxidation resistance in the process of hot rolling, which reduces the thickness of oxide scale on the products. Additionally, the surface quality of hot-rolled steel plate and pickling steel strip were improved by grasping the phase transformation law of oxide scale on the steel containing Cr under different cooling conditions.
In the present paper, the phase transformation behavior of FeO in oxide scale on the steel containing 0.4 wt.% Cr under continuous cooling condition is investigated. The cross-sectional morphologies of oxide scale at different start cooling temperatures and cooling rates are observed, and then the relation diagram of cooling rate and start cooling temperature of FeO is constructed. In comparison to the steel without Cr, the Cr addition can significantly modify the thickness of oxide scale, phase transformation mechanism of FeO and chemical composition of the interface between oxide scale and steel substrate.
2. Experimental Procedure
Two experimental steels were melted in a vacuum induction furnace, and the chemical composition of the steels was shown in Table 1. The ingots were homogenized, forged, hot rolled to a thickness of 2 mm and annealed. The specimens were cut from the hot rolled steel strip, and then machined to the dimension of 6 mm width and 15 mm length. The surfaces of specimens were ground to a 1500-grit finish with SiC paper, and ultrasonically cleaned with alcohol prior to tests.
Table 1. Chemical composition of the two experimental steels (wt.%).
| C | Si | Cr | Mn | P | S | Fe |
|---|
| Experimental steel without Cr | 0.030 | 0.013 | 0 | 0.020 | 0.015 | 0.006 | Bal. |
| Experimental steel containing 0.4 wt.% Cr | 0.028 | 0.018 | 0.42 | 0.022 | 0.020 | 0.004 | Bal. |
The continuous cooling transformation of FeO in oxide scale was performed by using thermal gravimetric analysis (TGA). The specimen was suspended in the furnace chamber, and then heated to pre-oxidation temperature (750°C) at a rate of 30°C/min in the inert gas (Ar). When the temperature reached 750°C, the atmosphere in the furnace chamber was replaced by dry air, and the passing rate of air was 50 mL/min. The specimen was exposed in dry air for 10 min. Subsequently, the specimen in Ar was cooled to the similar coiling temperature (600, 550, 500, 450, 400 and 350°C) at the cooling rate of 90°C/min, and then cooled to room temperature in the cooling rates range of 1–40°C/min. For convenience in the present study, the similar coiling temperature was denoted as “the start cooling temperature”. After tests, electron probe microanalysis (EPMA) and X-ray diffraction (XRD) by using Cu-Kα radiation were applied to observe and characterize the cross-sectional morphologies, element distribution and phase composition of oxide scale.
3. Results
3.1. Initial Oxide Scale
Figure 3 shows the cross-sectional morphologies and elements distribution of Fe, O, and Cr in the initial oxide scales formed on both the steels without Cr and containing 0.4 wt.% Cr after pre-oxidation at 750°C for 10 min in air, respectively. The oxide scale all consisted of outer Fe3O4 layer and inner FeO layer. The higher magnification on the element distribution of oxide/substrate interface of the steel containing Cr is given in Fig. 3(c), it can be found that the oxide/substrate interface was almost completely covered by Cr-enrich layer, and the mass percent of Cr was measured 4.1% at this layer which was higher than that in the chemical composition of steel. As shown in Fig. 3(d), the element distribution across the initial oxide scale formed on the steel without Cr reveals that the content of Fe increased and the content of O decreased toward the steel substrate. Moreover, as shown in Fig. 3(e), the concentration profile of O, Fe, and Cr was observed in the initial oxide scale formed on the steel containing Cr. The Cr concentration increased at the oxide/substrate interface, and the variation trend of Fe and O concentration basically agreed with that in the initial oxide scale of steel without Cr. The thickness of initial oxide scale on the steel without Cr was measured about 26 μm, while the thickness of Fe3O4 and FeO were 4 μm and 22 μm, respectively. On the other hand, the thickness of initial oxide scale on the steel containing Cr was about 21 μm, and then the thickness of Fe3O4, FeO, and Cr-enrich layer were 3 μm, 17.5 μm, and 0.5 μm, respectively. It can be clearly seen that the thickness of oxide scale on steel without Cr was thicker than that on steel containing Cr.

The relationship diagrams for the phase transformation of oxide scale on the two steels were obtained based on the cross-sectional morphologies of oxide scales at different start cooling temperatures and cooling rates, for convenience, which were named as the phase transformation curve in the following description. Figures 4, 5, 6, 7 show the phase transformation curve and typical morphologies of oxide scale on the steel without Cr after cooling from the range of 350–600°C to room temperature at different cooling rates. Figure 5(a) shows the morphology of initial oxide scales almost remained unchanged which was composed of outer Fe3O4 layer and inner FeO layer after cooling from 500°C at the rate of 40°C/min to room temperature. As shown in Fig. 5(b), a spot of proeutectoid Fe3O4 appeared on the FeO matrix, and then a small magnetite seam appeared at the oxide/substrate interface when the start cooling temperature was 500°C and the cooling rate was 20°C/min. The content and size of polygon proeutectoid Fe3O4 in FeO matrix increased, and the magnetite seam completely covered the interface between oxide scale and substrate at the cooling rate of 10°C/min, Fig. 5(c) shows a small amount of eutectoids started to form beneath the outer Fe3O4 layer due to the phase transformation from FeO to Fe3O4/α-Fe when the start cooling temperature was 500°C. However, as shown in Fig. 5(d), it cannot be observed the eutectoid structure under the condition of cooling from 450°C with the rate of 10°C/min. Figure 6 shows the cross-sectional morphologies at the cooling rate of 5°C/min, the eutectoid Fe3O4/α-Fe all precipitated beneath the outer Fe3O4 layer in the start cooling temperature range of 400 to 600°C, but the microstructure of oxide scale still hold initial scale at 350°C except for a small amount of proeutectoid Fe3O4 near outer Fe3O4 layer. The cross-sectional morphologies at the cooling rate of 1°C/min are shown in Fig. 7, the entire FeO decomposed to the inward growth of outer Fe3O4 layer, the intermediate eutectoid structure, and magnetite seam at oxide/substrate interface in the start cooling temperature range of 450 to 600°C. Moreover, the thickness of outer Fe3O4 layer and magnetite seam reduced with the decreasing of start cooling temperature. As shown in Fig. 7(e), a small amount of undecomposed FeO and some magnetite seam remained at the oxide/substrate interface when the start cooling temperature dropped to 400°C. Figure 7(f) demonstrates a small number of eutectoid structure formed at the interface between outer Fe3O4 and FeO, and large amounts of polygonal proeutectoid Fe3O4 precipitated inside FeO matrix at the start cooling temperature of 350°C. Additionally, the granular Fe3O4 can be observed in eutectoid structure, the granular Fe3O4 is similar to proeutectoid Fe3O4, which were all the precipitation Fe3O4 due to supersaturation of Fe during continuous cooling. The main difference between proeutectoid Fe3O4 and granular Fe3O4 were formation site and shape. The polygonal proeutectoid Fe3O4 discretely distributed in FeO matrix, and then granular Fe3O4 was surrounded by eutectoid structure.


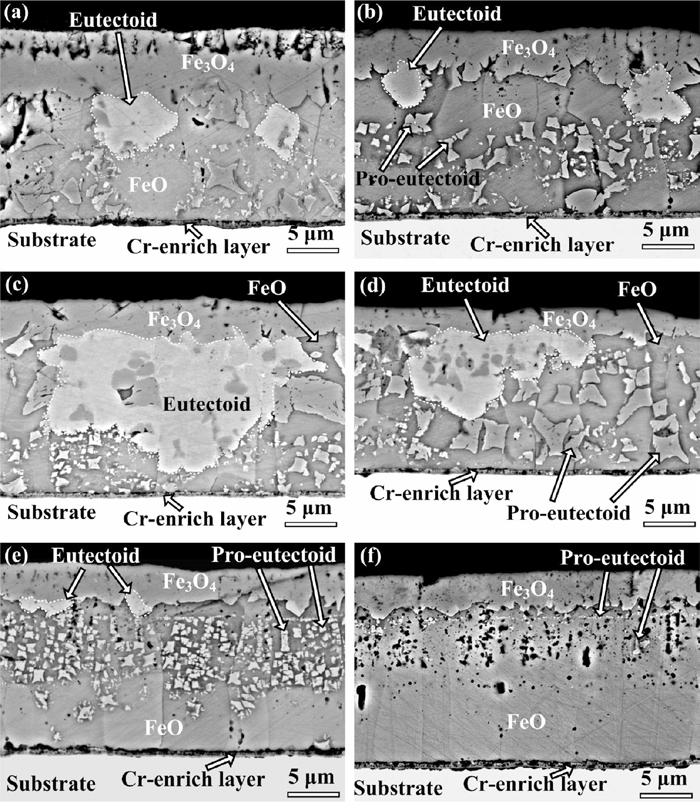
The phase transformation curve and typical morphologies of oxide scale on the steel containing 0.4 wt.% Cr after cooling process from the range of 350–600°C to room temperature at different cooling rates are shown in Figs. 8, 9, 10, 11. When the cooling rate was 40°C/min, the microstructure of oxide scale was similar with initial scale which consisted of outer Fe3O4 layer, inner FeO layer, and a Cr-enrich layer at the oxide/substrate interface, for example, the morphology of oxide scale after cooling from 500°C is shown in Fig. 9(a). At the cooling rate of 20°C/min, the polygon proeutectoid Fe3O4 precipitated on the FeO matrix. At the cooling rate of 10°C/min, the thickness and area fraction of outer Fe3O4 layer and polygonal proeutectoid Fe3O4 significantly increased. Additionally, a small amount of eutectoid structure can be observed beneath the outer Fe3O4 layer at the start cooling temperatures of 500 and 450°C, as shown in Figs. 9(c) and 9(d). Figure 10 shows the cross-sectional morphologies at the cooling rate of 5°C/min, the oxide scale was composed of outer Fe3O4 layer, the eutectoid structure precipitated beneath the outer Fe3O4 layer, a small amount of proeutectoid Fe3O4 and a Cr-enrich layer at the start cooling temperature of range of 400–600°C, while the eutectoid structure cannot be observed in oxide scale after cooling from 350°C. The FeO layer in oxide scale completely transformed into the inward growth of outer Fe3O4 layer and eutectoid structure under the condition of cooling from 400–600°C at the rate of 1°C/min, as shown in Fig. 11. A certain amount of eutectoid structure was observed beneath the outer Fe3O4 layer, and a large amount of polygonal proeutectoid Fe3O4 precipitated within the FeO matrix at the start cooling temperature of 350°C under same cooling rate.

The higher magnification images of oxide/substrate interface on the two steels after cooling from 450°C to room temperature at the rate of 1°C/min, are shown in Fig. 12. It can be seen that the eutectoid structure was mostly a mixture layer structure of magnetite and metallic iron. The white and the dark grey layer were α-Fe and Fe3O4, respectively.15) Figure 12(a) shows that the magnetite seam can be observed at the oxide/substrate interface on the steel without Cr. However, the magnetite seam cannot be observed at the oxide/substrate interface on steel containing Cr, as shown in Fig. 12(b), which was replaced by the Cr-enrich layer. Moreover, the lamellar spacing of eutectoid structure in oxide scale suggested the obvious difference due to the Cr addition. The lamellar spacing of steel without Cr was 0.127 μm, whereas the one containing Cr was 0.094 μm. Table 2 shows the element composition at different positions in Fig. 12, it is worth noting that the mass percent of Fe and O in the granular Fe3O4 and lamellar eutectoid were basically the same. However, the mass percent of O in magnetite seam was twice than that of Cr-enrich layer. Moreover, the mass percent of Cr in Cr-enrich layer after eutectoid transformation was higher than that of initial oxide scale in Fig. 3(c), which indicated that the Cr continuously outward diffuses from substrate, and then react with O atom in FeO matrix under cooling condition.

Table 2. Element composition at different positions in
Fig. 12.
| Position | Phase | Fe/wt.% | O/wt.% | Cr/wt.% |
|---|
| Experimental steel without Cr | Point a-1 | Granular Fe3O4 | 73.26 | 26.74 | – |
| Point a-2 | Lamellar eutectoid | 76.97 | 23.03 | – |
| Point a-3 | Magnetite seam | 72.26 | 27.74 | – |
| Experimental steel containing 0.4 wt.% Cr | Point b-1 | Granular Fe3O4 | 74.55 | 25.45 | – |
| Point b-2 | Lamellar eutectoid | 76.63 | 23.37 | – |
| Point b-3 | Cr-enrich layer | 81.50 | 13.12 | 5.38 |
In order to analyze the effect of Cr addition on the transformation rate of eutectoid structure in oxide scale, Fig. 13 shows the area fraction of eutectoid structure in oxide scale on the two steels after cooling from the temperature range of 350–600°C at the rate of 10, 5, and 1°C/min. The eutectoid structure in oxide scale on steel without Cr can be observed when the start cooling temperature was 500°C and the cooling rate was 10°C/min, whereas the one on steel containing Cr can be found during cooling from 450 and 500°C under same cooling rate condition. The area fraction of eutectoid structure in oxide scale on the steel containing Cr was higher than that on the steel without Cr, which indicated that the Cr addition accelerated the phase transformation rate of eutectoid structure in FeO, and then the area fraction of eutectoid structure increased with the reducing of cooling rate. In the start cooling temperature range of 350–600°C, the variation trend of eutectoids fraction increased first and then decreased, and reached the highest point at 500°C, it can be inferred that the nose temperature of 100% eutectoid transformation of the two steels was 500°C. Moreover, combined with the phase transformation curve of oxide scale on the two steels, the start formation temperature of eutectoid structure of oxide scale on steel without Cr was 500°C, and the one on steel containing Cr was 450–500°C.

4. Discussion
4.1. Phase Analysis and Role of Cr-enrich Layer at Oxide/substrate Interface
The phase diffraction peak of initial oxide scale on the sample containing 0.4 wt.% Cr after pre-oxidation is shown in Fig. 14, which can point at the presence phase of Fe3O4, FeO, and FeCr2O4. Therefore, the phase of Cr-enrich layer can be confirmed as the FeCr2O4 which is a continuous solid solution between Fe-oxides and Cr-oxides. Previous investigations30,32,33) indicated that the equilibrium oxygen partial pressure of Cr is lower than that of Fe at high temperatures, and Cr-oxides form on the surface of substrate firstly. Consequently, Cr is believed to affect the growth of oxide scale by forming a FeCr2O4 layer.

The evolution of oxide scale on the two steels during pre-oxidation stage and cooling stage is shown in Fig. 15, the effect of Cr addition on thickness and microstructure of oxide scale can be divided into two aspects of high temperature oxidation behavior and solid-state phase changes of FeO matrix. The Cr outward diffuses from substrate and reacts with O in the air during the pre-oxidization of the steel containing Cr, and then the Cr-oxides form on the surface of steel. The Cr-oxides completely cover the steel surface, and then the uniform FeCr2O4 layer forms with the increasing of pre-oxidation time. Fe-oxides form on the outer of the Cr-enrich layer, which needs Fe in substrate to pass the Cr-enrich layer and reacts with O in atmosphere. It can be found that the thickness of oxide scale on the steel containing Cr is lower than that of steel without Cr after pre-oxidation, which indicates the FeCr2O4 layer on the surface of steel containing Cr plays a role of barrier for the diffusion of Fe from substrate to the scale.

In the cooling stage of steel without Cr, the magnetite seam can form at the interface between oxide scale and substrate because of decomposition of FeO, Fe precipitation and the interaction of the FeO lattice with O. The decomposition of FeO and Fe precipitation all belong to the diffusion phase transformation. The interaction of the FeO lattice with O suggests O chemisorbs attracts an electron from a Fe site thus forming a Fe3+. The interface of FeO/substrate provides the site for phase transformation, and then the magnetite seam can nucleate and grow during isothermal transformation or continuous cooling. In oxide scale of steel containing Cr, the concentration of O near Cr-enrich layer reduces due to the strong affinity of the Cr element to O, which reduces the amount of the O chemisorbs in the FeO lattice. Additionally, Fe in substrate across the interface between FeCr2O4 layer and substrate becomes extremely difficult. The degree of Fe supersaturation is lower at FeO/Cr-enrich layer interface, which cannot provide sufficient driving force for Fe precipitation at this interface. Therefore, there is few magnetite seam formation on the steel containing Cr.
4.2. Phase Transformation under Different Cooling Rates
The cross-sectional morphologies of oxide scale on the steel without Cr are shown in Figs. 5(a)–5(c), 6(c) and 7(c), which is cooled from 500°C to room temperature at the cooling rate of 1–40°C/min. Meanwhile, it can be seen that the cross-sectional morphologies of oxide scale on the steel containing Cr in Figs. 9(a)–9(c), 10(c) and 11(c) under same cooling condition. The phase transformation process of oxide scale on the both steels is similar including the precipitation of proeutectoid and eutectoid. There is no phase transformation in the oxide scale on the both steels when the cooling rate is 40°C/min, which is comprised of the outer Fe3O4 layer and the inner FeO layer. When the cooling rate decreases from 40°C/min to 20°C/min, the proeutectoid Fe3O4 starts to precipitate in FeO of the two steels. The eutectoid structure nucleates and precipitates at the interface between outer Fe3O4 and FeO when the cooling rate is 10°C/min. When the cooling rate is reduced to 5°C/min, the eutectoid structure has grown inwardly thicker. The FeO layer completely transforms into eutectoid structure at a cooling rate of 1°C/min. It can be found that the structure of oxide scale presents obvious difference at different cooling rates because the precipitation of proeutectoid and eutectoid is a type of diffusion phase transformation, and then the cooling rate can determine the diffusion rates of Fe ions and O ions in oxide scale.
The main difference of the oxide scale on the both steels is the transformation rate of eutectoid structure at same cooling rate. As mentioned previously, the FeCr2O4 layer can take the lead in forming on the surface of steel containing Cr due to the selective oxidation of Cr element. The thickness of oxide scale forms on the steel with Cr after oxidation at 750°C for 10 min is thinner than that on steel without Cr, indicating that the FeCr2O4 layer plays an important role in preventing outward diffusion of Fe during oxidation. It is inferred that the FeCr2O4 layer becomes a chemical activity barrier for the inward diffusion of Fe ions and O ions from oxide scale to substrate during cooling. Therefore, FeO on the steel with Cr become supersaturated with Fe, Figs. 6(c) and 10(c) show the transformation rate of eutectoid structure in FeO on the steel containing Cr is faster than that on the steel without Cr.
4.3. Phase Transformation of Eutectoid Structure
Figure 13 shows the Cr addition can effectively accelerate the eutectoid phase transformation of FeO during cooling stage, and the key mechanism can be given on the kinetics and thermodynamics. On the one hand, the FeCr2O4 as the diffusion barrier reduces the consumption of O at oxide/substrate interface, and then increases the O concentration in FeO matrix. The O can easily enrich at the interface between outer Fe3O4 and inner FeO, and then provide more nucleation points for new phase. Moreover, the O diffuses from the lower concentration region to the higher concentration region, which promotes the super saturation of O in FeO and results in the polarization of concentration of O and Fe. As shown in Fig. 16, it can be found that the eutectoid reaction is initiated by Fe nucleation from the saturation of Fe in FeO and the interaction of the FeO lattice with O. The saturation of Fe in FeO was due to an electron transferring from a Fe2+ to a Fe3+. On the same supercooling, the low cooling rate promotes the activation energy for the diffusion of Fe and O in FeO, and then provides sufficient driving force and time for the decomposition of FeO. Therefore, a new eutectoid phase of O-rich Fe3O4 and Fe-rich α-Fe forms after the lattice reconstruction. On the other hand, Fe–O binary phase diagram in Fig. 2 indicates that FeO is not stable and decomposes at the temperatures below 560°C. However, Fig. 17 is the Fe–Cr–O equilibrium phase diagram, which shows that the stable region of FeO phase is extended above 560°C with the increasing of Cr content. Figures 3 and 12 demonstrate that the Cr/Fe ratio at the interface between oxide scale and substrate in pre-oxidation stage is significantly higher than that at the steel substrate, and then further increases in cooling stage. Meanwhile, outward continuous diffusion of Cr can ensure the stability of FeCr2O4 layer in pre-oxidation and cooling stage. Figure 18 shows the stable temperature of FeO in the oxide scale on the steel containing Cr is higher than that of the steel without Cr under equilibrium condition. Therefore, it can be inferred that the complete Cr-oxide layer forms on the surface of substrate when Cr exceeds the critical concentration at the interface between FeCr2O4 layer and substrate, which suppresses the diffusion of Fe from substrate to scale, leading to few FeO formation in outer scale during oxidation process. Under continuous cooling, the FeCr2O4 layer prevents short-range uphill diffusion of Fe from FeO to substrate, and then reduces the consumption of Fe in FeO. The proeutectoid Fe3O4 and eutectoid structure easily precipitate in FeO on the steel containing Cr due to the saturation of Fe in FeO.

Moreover, the increasing of O and Fe supersaturation in FeO is also confirmed by the lamellar spacing of eutectoid structure.24) The average lamellar spacing is inversely proportional to the degree of super cooling (ΔT). Based on the lamellar spacing measured in Fig. 12, it can be calculated that ΔTFe–Cr is about 1.351 times higher than ΔTFe, which corresponds to super cooling, ΔTFe≈60°C at the nose temperature of 100% eutectoid transformation (500°C). Therefore, the start decomposition temperature of FeO in oxide scale on the steel containing Cr is calculated to be approximately 581°C, which is around 20°C higher than that of the steel without Cr. As shown in Fig. 18, this calculation result is in general agreement with the stable region of FeO in oxide scale on the two steels which is provided by Thermal-Calc software.
5. Conclusions
(1) A Cr-enrich layer formed at the oxide/substrate interface after pre-oxidation of the steel containing 0.4 wt.% Cr at 750°C for 10 min, which was FeCr2O4 phase consisted of Fe, Cr and O.
(2) The FeCr2O4 layer as a diffusion barrier slowed the diffusion rate of O and Fe at the interface between oxide scale and substrate, and then decreased the thickness of oxide scale and prevented the formation of a magnetite seam.
(3) The Cr addition to steel shortened the incubation time for formation of eutectoid structure, and then significantly increased the area fraction of eutectoid structure in oxide scale under same cooling condition compared with the oxide scale on steel without Cr.
(4) The formation of FeCr2O4 layer prevented the consumption of O at oxide/substrate interface and short-range uphill diffusion of Fe from FeO to substrate, which resulted in the acceleration of nucleation and growth of lamellar eutectoid structure (O-rich Fe3O4 and Fe-rich α-Fe) in the FeO matrix.
(5) The stable temperature of FeO increased due to the Cr addition, which can provide higher driving force for the precipitation of eutectoid structure under same cooling condition.
Acknowledgements
The authors would like to thank the National Nature Science Foundation of China (U1660117) for the financial support.
References
- 1) R. Y. Chen and W. Y. D. Yuen: ISIJ Int., 45 (2005), 52.
- 2) R. Y. Chen and W. Y. D. Yuen: Oxid. Met., 53 (2000), 539.
- 3) B. Gleeson, S. M. M. Hadavi and D. J. Young: Mater. High Temp., 17 (2000), 311.
- 4) X. Yu, Z. Jiang, D. Wei, C. Zhou, Q. Huang and D. Yang: Wear, 302 (2013), 1286.
- 5) G. Cao, Z. Li, J. Tang, X. Sun and Z. Liu: High Temp. Mater. Process., 36 (2017), 927.
- 6) S. Chandra-ambhorn, T. Phadungwong and K. Sirivedin: Corros. Sci., 115 (2017), 30.
- 7) E. Ahtoy, M. Picard, G. Leprince, A. Galerie, Y. Wouters, X. Wang and A. Atkinson: Mater. Chem. Phys., 148 (2014), 1157.
- 8) D. Genève, D. Rouxel, P. Pigeat and M. Confente: Corros. Sci., 52 (2010), 1155.
- 9) A. Chattopadhyay, P. Kumar and D. Roy: Surf. Coat. Technol., 203 (2009), 2912.
- 10) J. Ding, B. Tang, M. Li, X. Feng, F. Fu, L. Bin, S. Huang, W. Su, D. Li and L. Zheng: J. Clean. Prod., 142 (2017), 2166.
- 11) L. Péter, O. Sánta, G. Koós, J. Földi, B. Verő, J. Bátonyi, P. Schwarczenbarth, K. Mach, I. Kardos, G. G. Gyerák, B. Vehovszky and R. D. Lerner: Steel Res. Int., 86 (2015), 704.
- 12) Z. F. Li, G. M. Cao, F. Lin, X. Z. Sun, Y. Q. He and Z. Y. Liu: ISIJ Int., 57 (2017), 2034.
- 13) Y. Q. He, T. Jia, Z. F. Li, G. M. Cao, Z. Y. Liu and J. Li: Metall. Mater. Trans. A, 47 (2016), 4845.
- 14) Y. A. Jing, Y. M. Yuan, X. L. Yan, L. Zhang and M. H. Sha: Int. J. Hydrog. Energy, 42 (2017), 10611.
- 15) J. Shi, D. R. Wang, Y. D. He, H. B. Qi and W. Gao: Mater. Lett., 62 (2008), 3500.
- 16) H. Tanei and Y. Kondo: ISIJ Int., 57 (2017), 506.
- 17) S. N. Lin, C. C. Huang, M. T. Wu, W. L. Wang and K. C. Hsieh: Steel Res. Int., 88 (2017), 1700045.
- 18) S. Hayashi, K. Mizumoto, S. Yoneda, Y. Kondo, H. Tanei and S. Ukai: Oxid. Met., 81 (2014), 357.
- 19) C. H. Zhou, H. T. Ma, Y. Li and L. Wang: Oxid. Met., 78 (2012), 145.
- 20) H. Tanei and Y. Kondo: ISIJ Int., 52 (2012), 105.
- 21) Y. Shizukawa, S. Hayashi, S. Yoneda, Y. Kondo, H. Tanei and S. Ukai: Oxid. Met., 86 (2016), 315.
- 22) N. Otsuka, T. Doi, Y. Hidaka, Y. Higashida, Y. Masaki, N. Mizui and M. Sato: ISIJ Int., 53 (2013), 286.
- 23) G. M. Cao, T. Z. Wu, R. Xu, Z. F. Li, F. X. Wang and Z. Y. Liu: J. Iron Steel Res. Int., 22 (2015), 892.
- 24) S. Yoneda, S. Hayashi, Y. Kondo, H. Tanei and S. Ukai: Oxid. Met., 87 (2017), 125.
- 25) J. Hu, L. X. Du, H. Xie, P. Yu and R. D. K. Misra: Mater. Sci. Eng. A, 605 (2014), 186.
- 26) Z. F. Li, G. M. Cao, Y. Q. He, Z. Y. Liu and G. D. Wang: Steel Res. Int., 87 (2016), 1469.
- 27) M. Takeda, H. Kushida, T. Onishi, M. Toyama, F. Koizumi and S. Fujimoto: Oxid. Met., 73 (2010), 1.
- 28) Y. Wang, Y. Liu, H. Tang and W. Li: Mater. Charact., 107 (2015), 283.
- 29) K. Chandra, A. Kranzmann, R. S. Neumann and F. Rizzo: Oxid. Met., 84 (2015), 463.
- 30) C. W. Yang, J. H. Kim, R. E. Triambulo, Y. H. Kang, J. S. Lee and J. W. Park: J. Alloy. Compd., 549 (2013), 6.
- 31) L. L. Wei, L. Q. Chen, M. Y. Ma, H. L. Liu and R. D. K. Misra: Mater. Chem. Phys., 205 (2018), 508.
- 32) M. Ekström, P. Szakalos and S. Jonsson: Oxid. Met., 80 (2013), 455.
- 33) T. Jonsson, S. Karlsson, H. Hooshyar, M. Sattari, J. Liske, J. E. Svensson and L. G. Johansson: Oxid. Met., 85 (2016), 509.