Abstract
Polyethylene terephthalate (PET) film laminated steel sheets with excellent properties are now widely used in beverage cans. In recent years, can weight reduction has been promoted from the viewpoint of resource saving, and deep-drawing and ironing processing has been applied to the laminated steel sheets. Therefore, non-oriented PET films (NO-PET) with excellent formability are required instead of biaxially oriented PET films (BO-PET), but NO-PET films may affect impact resistance and corrosion resistance due to their lack of a crystal structure.
This study investigated the effect of the crystallinity of the PET film on various properties required for food cans. PET films with different crystallinities laminated on steel sheets were formed into a can shape by a stretch-drawing process in order to evaluate formability, adhesion, impact resistance and corrosion resistance.
The results showed that the BO-PET film laminated steel with high crystallinity was inferior in impact resistance and corrosion resistance compared with the BO-PET/IA (copolymerized with isophthalic acid) and the NO-PET/IA film laminated steel. Film cracks parallel to the can height direction were observed only on the surface of the BO-PET film after heat treatment. Heat treatment increased the crystallinity of the PET and oriented (100) crystal face of the PET parallel to the can height direction, which resulted in the film cracks observed on the surface of the BO-PET film.
As a result of this study, it was concluded that the crystal structure change of the PET film in a can making process had significant effects on impact resistance and corrosion resistance, and control of the crystallinity of the PET was the key factor for obtaining excellent properties.
1. Introduction
For can material use, steel sheets are normally coated with a lacquer coating by the can maker. However, the lacquer coating process is considered to be undesirable from the environmental viewpoint, as it generates a large amount of carbon oxide gas. Various film laminated steel sheets have been developed as substitutes for lacquer coated steel sheets, and their production volumes are increasing due to the advantages of reduction of can manufacturing costs by omission of the lacquering process and lower environmental impacts in the form of smaller discharges of waste water and gas.1) PET film laminated sheets have excellent properties, including formability, corrosion resistance and adhesion to steel sheets, and are widely used in beverage cans.2)
The degree of orientation of the PET film after lamination on the steel sheet is known to have an influence on properties including film adhesion and corrosion resistance.3) Therefore, the laminating conditions should be properly controlled to obtain the optimum properties.4) The PET film is thermally pressed onto the heated steel surface with a laminating roll. The part of the film in the vicinity of the interface between the film and the steel is melted and amorphized for good adhesion to the steel, while the film surface retains a crystal structure.
In recent years, can weight reduction has been promoted from the viewpoint of resource saving, and deep-drawing and ironing processing has been applied to the laminated steel sheets. Therefore, non-oriented PET (NO-PET) films with excellent formability are required instead of biaxially oriented PET (BO-PET) films.5) However, the possibility that NO-PET films may affect impact resistance and corrosion resistance due to their lack of a crystal structure was a concern.
This study investigated the effect of changes in the crystal structure of the PET films in a can making process on the properties of the PET film laminated steel sheet. PET films with different crystallinities laminated on steel sheets were formed into a can shape by stretch-drawing processing2) in order to evaluate formability, adhesion, impact resistance and corrosion resistance. The crystal structure of the PET films after lamination was also analyzed by using Raman spectroscopy to clarify its effect on those properties.
2. Experimental
2.1. Materials
The steel sheets used in this experiment were 0.24 mm thick steel sheets coated with 120 mg/m2 of metallic chromium and 15 mg/m2 of hydrated chromium oxide on both sides. Three kinds of films, as shown in Table 1, were the biaxially-oriented PET (BO-PET) film (copolymerization ratio: 0 mol%), the biaxially-oriented PET film copolymerized with 10 mol% of isophthalic acid (BO-PET/IA) and the non-oriented PET film copolymerized with 10 mol% of isophthalic acid (NO-PET/IA). These films were laminated on both sides of the steel sheets by heating above their melting points. The laminated PET films were amorphized by controlling the laminating conditions.
Table 1. PET films used in this study.
| Comonomersubstitution; IAa)/(IA+TAb)) (mol%) | Film thickness (μm) |
|---|
| Biaxially-oriented PET film (BO-PET) | 0 | 25 |
| Biaxially-oriented co-PET film (BO-PET/IA) | 10 | 25 |
| Non-oriented co-PET film (NO-PET/IA) | 10 | 25 |
a) Isophthalic acid b) Terephthalic acid
The film laminated steel sheets described in section 2.1 were coated with a paraffin wax and formed into cans by stretch-drawing processing.2) The reduction ratio in thickness of the thinnest part of the can wall was 40% against the thickness of the steel sheet before can forming. Can making was performed by flange and neck-in forming in preparation for seaming a can lid to the can body.
2.3. Evaluation of Film Adhesion on Can Wall
The film adhesion property of the can in section 2.2 was evaluated. A test piece for the evaluation was cut out from the can wall 90 mm above the bottom, where the reduction ratio in thickness was 35%. The peeling strength of the film was then measured with a tensile tester at a speed of 30 mm/min in the 180° direction.6)
2.4. Evaluation of Impact Resistance at Can Wall
The can in section 2.2 was heated at 220°C for 3 min to remove the paraffin wax remaining on the can body. The can was filled with distilled water and sealed with the can lid, after which it was treated by retort treatment at 125°C for 90 min and then held at 37°C for 1 week.
A Dupont impact test was performed at the can wall from the outside, and ERV (Enamel Rater Value) was measured at the impacted part inside the can.7) A ball with a weight of 1 kg and radius of 1/4 inch was dropped on the test piece from the height of 40 mm. Impacted parts were formed at the can wall 10 mm and 90 mm above the bottom, where the reduction ratios in thickness were 20% and 35%, respectively.
The impacted parts were filled with a 3% NaCl solution, and the corrosion current was measured by applying the constant voltage of 6.3 V.
2.5. Evaluation of Corrosion Resistance
The can in section 2.2 was heated at 220°C for 3 min to remove the paraffin wax remaining on the can body. The can was filled with distilled water and sealed with the can lid, after which it was treated by retort treatment at 125°C for 90 min and then held at 37°C for 1 month. The distilled water packed in the can was collected, and the concentration of iron dissolved in the water was measured using a high-frequency inductively coupled plasma emission spectrometric analysis device (ICPS-7510, Shimadzu Corporation). The corrosion state inside the can was also evaluated by visual observation and electron microscopic observation.
2.6. Analysis of Crystal Structure of Laminated PET Film
The changes in the crystallinity of the laminated PET films in the vertical and horizontal directions to the film surface were analyzed using a confocal microscopic laser Raman spectroscopic analysis device (Almega XR, Thermo Fisher Scientific). In the spectra of the PET film, a wider half-width of the peak around 1730 cm−1 due to C=O stretching vibration indicates lower crystallinity of the PET film.8) Therefore, the crystal structure of the laminated PET film can be analyzed by measuring the half-bandwidth of the C=O peak. Table 2 shows the measurement conditions of confocal Raman spectroscopy. A linearly polarized laser was used to analyze the change of the crystal structure of the PET film in the specified direction.9) In this study, the crystallinities of the PET film in the can height direction and the film surface direction were measured, and the crystal structure change of the PET film was analyzed in each process from can forming to retort treatment.
Table 2. Measurement conditions of confocal Raman spectroscopy.
| Parameter | Condition |
|---|
| Laser wavelength | 532 nm |
| Laser output power | 10 |
| Exposure time | 10 |
| Frequency of exposure | 2 |
| Aperture time | 25 μm |
| Object lens | 100-fold |
| Interval of measurement | 0.5 μm |
3. Results
3.1. Results of Evaluation of PET Film Adhesion Property
Figure 1 shows the results of evaluation of the film adhesion at the can wall 90 mm above the bottom, where the reduction rate in thickness was 35%. The error bars represent the distribution of five repeated measurements. All of the films had almost the same peel strength of between 7 N and 9 N, regardless of comonomer substitution or film orientation. In order to consider why this result was obtained, the change of the crystal structure was investigated before and after can forming.
Figure 2 shows the crystallinity distribution of the PET films in the thickness direction after lamination. As shown in section 2.1, all of the films were amorphized by the laminating condition and had the same structure without crystallinity change in the thickness direction. The half-bandwidth of 25.5 cm−1indicates an amorphous structure.
Figure 3 shows the crystallinity distribution of the PET films in the thickness direction at the can wall 90 mm above the bottom after can forming. As in Fig. 2, all of the films had the amorphous structure in the thickness direction. Despite the large stretching of the PET films in the can height direction during can forming (stretch-drawing processing), the amorphous structure of the film remained unchanged.
The reason why all of the films had almost the same peel strength was that they retained the amorphous structure and had the same physical properties in the vicinity of the interface between the film and the steel.
3.2. Results of Evaluation of Impact Resistance
Figure 4 shows the results of measurement of ERV at the can wall 10 mm above the bottom after the impact test. The error bars represent the distribution of five repeated measurements. All of the films had almost the same current value of less than 0.1 mA, and no significant difference was observed. Figure 5 shows the result of the measurements of ERV at the can wall 90 mm above the bottom after the impact test. A significant difference in the current value was observed between the films. The BO-PET film showed the highest current value and was inferior to the PET/IA film in impact resistance. The NO-PET/IA film showed excellent impact resistance with the lowest current value.

In order to discuss why these results were obtained, SEM observation was performed on the inside film of the can wall before the impact test. Figures 6 and 7 show the results. In Fig. 6, no defect was observed on the surface at the can wall 10 mm above the bottom, whereas in Fig. 7 a significant difference was observed on the film surface at the can wall 90 mm above the bottom. The surface of the BO-PET film displayed many linear cracks in the can height direction. The BO-PET/IA film and NO-PET/IA film had no linear cracks on the surface despite undulations in the can height direction being observed on the surface. From the SEM observation, the reason why the BO-PET film was inferior in impact resistance to the other films was that its barrier function against corrosion was degraded by the cracks on the surface.
3.3. Results of Evaluation of Corrosion Resistance
Figure 8 shows the results of measurement of concentration of iron dissolved in the distilled water. The error bars represent the distribution of five repeated measurements. A significant difference in concentration was observed between the films. The BO-PET film showed the highest concentration and was inferior to the PET/IA films in corrosion resistance. The NO-PET/IA film showed excellent corrosion resistance with the lowest concentration of dissolved iron.
Figure 9 shows the results of observation of the corrosion state of the inner surface of the can wall. Red rust was found at the upper part (80 to 90 mm above the bottom) of the can made of the BO-PET film laminated steel. Figure 10 shows the results of SEM observation around the red rust part. As in Fig. 7, many linear cracks in the can height direction were observed. From these results, the reason why the BO-PET film was inferior in corrosion resistance to the other films was due to the cracks on the film surface.
4. Discussion
From the results of evaluation of impact resistance and corrosion resistance of the films, these properties of the BO-PET film were degraded due to the generation of cracks on the film surface. Differences in these properties were also found between the BO-PET/IA film and the NO-PET/IA film. Here we consider the cause of these differences between the films.
4.1. Process where Film Cracks were Generated
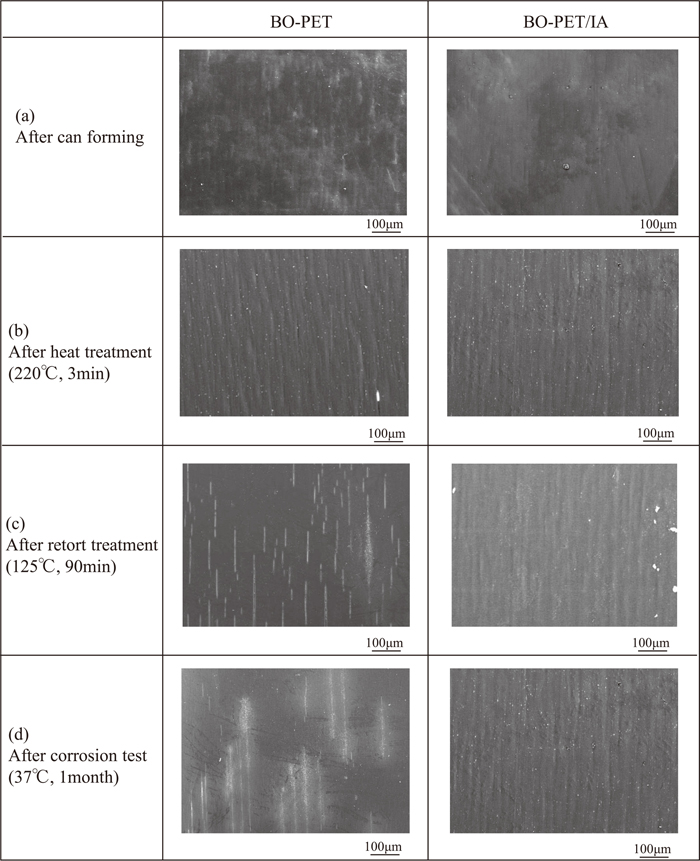
Figure 11 shows the results of SEM observation of the surfaces of the BO-PET film and the BO-PET/IA film at the can wall 90 mm above the bottom in each process from can forming to retort treatment. Although both films had undulations in the can height direction after heat treatment, only the BO-PET film had slight linear cracks on the surface. The number of linear cracks in the can height direction on the surface of the BO-PET film increased after retort treatment, whereas the surface of the BO-PET/IA film remained unchanged. From the results of SEM observation, film cracks were generated primarily in the heat treatment process, and the number of cracks then increased in the retort treatment process, which resulted in the degradation of the impact resistance and corrosion resistance of the BO-PET film.
4.2. Effect of Crystal Structure Change on Film Cracks
Figure 12 shows the results of measurement of the crystallinity distribution of the PET film surface from 0° to 180° to the can circumferential direction at the can wall 90 mm above the bottom. Here, 0° is the can circumferential direction and 90° is the can height direction. After can forming, all of the films had an amorphous structure regardless of the direction, but their crystallinity distribution changed remarkably after heat treatment. The crystallinity of all the films was maximized at 90° (can height direction) and minimized at 0° (can circumferential direction). That is, heat treatment promoted crystallization of the films in the can height direction. The BO-PET film had the highest crystallinity distribution of the film surface, and the NO-PET/IA film had the lowest. The crystallinity distribution of the films increased slightly after retort treatment, but no remarkable change was observed. Retort treatment seemed to have little effect on crystallization of the films because the temperature used in retort treatment was lower than that in heat treatment.

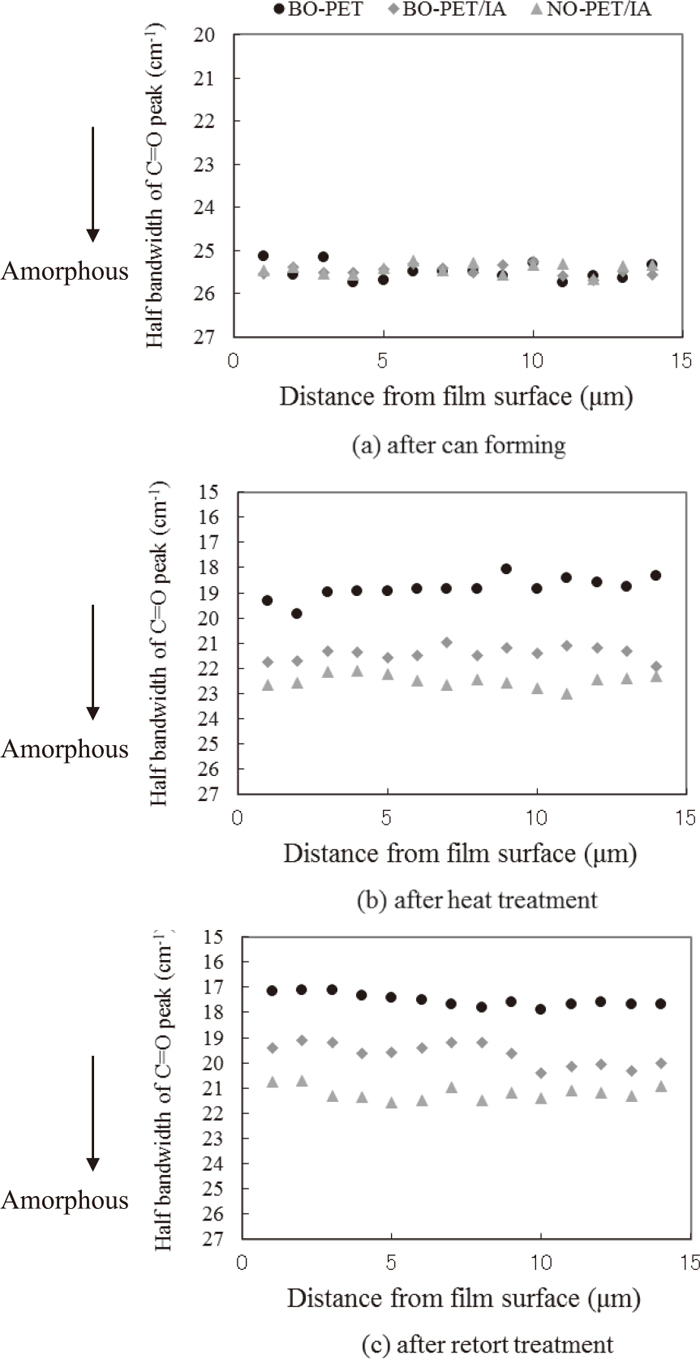
Figure 13 shows the results of measurement of the crystallinity distribution of the film thickness cross section at the can wall 90 mm above the bottom in each process from can forming to retort treatment. The plane of the polarized laser was set parallel to the can height direction in order to measure the crystallinity of the films only in the can height direction. The results showed that all of the films had the same amorphous structure in the cross section. However, as with the film surface, the crystallinity distribution of the cross sections changed remarkably after heat treatment and increased uniformly across the whole cross section. The BO-PET film had the highest crystallinity distribution of the cross section in the can height direction, and the NO-PET/IA film had the lowest because crystallization in the can height direction was inhibited.
4.3. Mechanism of Film Crack Generation
The measurement of the crystal structure of the PET films shown in section 2.6 was carried out based on the fact that a PET film has structure with a PET (100) crystal face orientation to the film surface and a carbonyl group (C=O) is positioned parallel to the (100) crystal face.10) Thus, crystallization of the PET film can be expressed by the orientation of the molecular chains of the PET to the molecular axis direction.
The bonding between molecular chains of the PET mainly depends on an intermolecular force which is much weaker than the covalent bond constituting the molecular chain of the PET itself. This can explain the fact that a uniaxially-stretched PET film has high tensile strength in the direction of stretching because of the molecular chains of the PET oriented to the stretching direction, but has extremely low tensile strength in the direction perpendicular to the stretching direction.11,12)
Figure 14 shows the estimated mechanism of the crystal structure change caused by heat treatment. The PET films retain the amorphous structure after can forming, even though they are stretched largely in the can height direction. However, tensile stress in the can height direction is induced in the films. Figure 15 shows the result of Raman spectroscopy measurements of the stress induced in the film after can forming. The Raman band attributed to C-C stretching vibration shifts linearly with the stress induced in the film. The band position obtained from a standard sample of PET is 1614 cm−1. The band shifts to a lower wavenumber than 1614 cm−1 as compressive stress is induced13) and shifts to a higher wavenumber than 1614 cm−1 as tensile stress is induced.13,14) The error bars represent the standard deviation of the Raman shift measured at a pitch of 1 μm in the film thickness direction.

The band obtained from the film at the can wall 90 mm above the bottom after can forming, shifted to a lower wavenumber than 1614 cm−1, showing that tensile stress was induced in the film. The tensile stress in the can height direction was considered to orient the molecular chains of PET to the can height direction by heat treatment.
As shown in Figs. 12 and 13, the molecular chains of the PET were oriented three-dimensionally in the can height direction, and the BO-PET film showed the strongest orientation in that direction. Therefore, the BO-PET film had the lowest tensile strength in the can circumference direction due to the weak bonds between the molecular chains. The reason why the BO-PET film displayed many linear cracks in the can height direction after retort treatment was that volume contraction of the film due to crystallization of the PET or hydrolysis of the film by the water in the can caused separation of the molecular chains of the PET.
A PET/IA film can inhibit thermal crystallization more effectively than a PET film due to its lower crystallization temperature.5,15) The NO-PET/IA film has a higher crystallization temperature and lower crystallization rate than the BO-PET/IA film.16) Therefore, the NO-PET/IA film can prevent film cracks by inhibiting thermal crystallization in the can height direction during heat treatment.
5. Conclusions
PET films with different crystallinity were laminated on steel sheets and formed into cans in order to evaluate formability, adhesion, impact resistance and corrosion resistance. The crystal structure of the PET films after lamination was then analyzed using Raman spectroscopy to clarify the effect of the crystal structure on those properties. The following conclusions were obtained:
(1) All of the PET films showed almost the same film adhesion of between 7 N and 9 N regardless of comonomer substitution or film orientation because the films retained the amorphous structure and had the same physical properties in the vicinity of the interface between the film and the steel.
(2) Differences in impact resistance and corrosion resistance were observed between the films. The BO-PET film was inferior to the other films because its barrier function against corrosion was degraded by film cracks in the can height direction.
(3) Film cracks occurred in the BO-PET film during heat treatment because heat treatment increased the crystallinity of the film and oriented the PET (100) crystal face to the can height direction.
(4) The crystallization behavior of the PET film in a can making process had a significant impact on impact resistance and corrosion resistance of the can. The NO-PET/IA film showed excellent impact and corrosion properties because crystallization in the can height direction was effectively inhibited.
References
- 1) A. Tanaka, T. Hanabusa, H. Kojyo and T. Inui: Tetsu-to-Hagané, 71 (1985), S1252.
- 2) K. Imazu: J. Jpn. Inst. Light Met., 44 (1994), 110.
- 3) A. Tanaka and T. Okumura: CAMP-ISIJ, 6 (1993), 536.
- 4) K. Yoshimura and S. Taya: Toyo Kohan, 37 (2013), 1.
- 5) N. Maida, S. Takahashi, L. Hu and M. Itoh: Toyo Kohan, 34 (2004), 1.
- 6) M. Kai, S. Taya and H. Tomaru: Tetsu-to-Hagané, 99 (2013), No. 8, 1.
- 7) T. Isogai and H. Uchida: Rev. Fac. Marit. Sci. Kobe Univ., 05 (2008), 41.
- 8) A. J. Melveger: J. Polym. Sci. A-2, 10 (1972), 317.
- 9) D. Terada, Y. Kawahara, M. Iwamoto and T. Kikutani: Sen’i Gakkaishi, 58 (2002), No. 9, 342.
- 10) R. de P. Daubeny, C. W. Bunn and C. J. Brown: Proc. R. Soc. Lond, A, 226 (1954), 531.
- 11) K. Yuki: Houwa Polyester Handbook (Saturated Polyester Handbook), Nikkan Kogyo Shinbun, Tokyo, (1989), 217 (in Japanese).
- 12) K. Matsumoto, Y. Izumi and R. Imamura: Sen’i Gakkaishi, 28 (1972), 179.
- 13) R. J. Young and W. Y. Yeh: Polymer, 35 (1994), 3845.
- 14) T. Hobo: Handbook of High-purification Technology, Fuji Tekuno Sisutemu, Tokyo, (1996), 279.
- 15) Y. Niinami: Eng. Mater., 26 (1978), 45.
- 16) J. Kitagawa, Y. Yamanaka, Y. Yoshida, H. Nakamaru and K. Kojima: Tetsu-to-Hagané, 103 (2017), 11.