Casting and Solidification
Estimation of Lubrication and Heat Transfer by Measurement of Friction Force in Mold
2018 Volume 58 Issue 3 Pages 521-526
Details
2018 Volume 58 Issue 3 Pages 521-526
In the continuous casting process of steels, the mold flux infiltrated in between a mold and solidified shell plays an important role to optimize lubrication and heat transfer to establish not only stable operation but also good surface quality of slabs. Therefore, lubrication and heat transfer was evaluated by measuring friction force attributed to the mold oscillation along with a lubrication model. The friction force was measured with a slab caster equipped with hydraulic oscillators, to understand how the friction force was affected by continuous casting factors such as the mold oscillation conditions, mold flux properties and casting speed.
It was found that the friction force was proportional to the velocity of the slab relative to the mold. The lubrication condition behaved as if it was fluid with the casting speed higher than 1.4 m/min.
In addition, the temperature dependence of viscosity of the molten flux was accounted for to develop a new fluid lubrication model. The present model showed that the lubrication layer thickness was approximately 50 µm.
Further, heat transfer through the mold flux was evaluated by the lubrication model revealing thermal resistance of the solidified flux layer, proving that the resistance caused by the crystallized flux was larger than that by glassy flux.
In the continuous casting process of steels, the mold flux infiltrated in between a mold and solidified shell plays an important role to optimize lubrication and heat transfer to establish not only stable operation but also good surface quality of slabs. Mold flux is known as a key to stable continuous casting process because it controls primary cooling which affects the quality of initial solidified shell. A complex interaction of thermo-mechanical behaviors occurs between the mold and the solidified shell. Heat transfer, solidification, friction and lubrication determine not only the surface quality of the cast slabs, but also the productivity of the continuous casting process.
One of the essential requirements for higher casting productivity is high speed casting. However, high speed casting increases heat flux, by which longitudinal cracks may take place due to uneven solidification, especially for peritectic steels. The unevenness decreases with milder primary cooling in the mold applying a mold flux with a high solidification temperature.1,2,3,4) However, high solidification temperature flux leads to lower mold flux consumption rate causing higher mold friction, which increases the probability of slab surface cracking, mold sticking and even worse breakout. Therefore, it is necessary to clarify the behavior of the mold flux infiltrated in order to avoid slab surface cracking and mold sticking at higher casting speeds.
The thickness of the liquid flux between the solidified shell and the mold (lubrication layer) is able to be calculated by a mold flux consumption model,5) thermal analysis using the mold plate temperature6) and direct sampling from the mold after casting.7) These studies reported that the thickness of the lubrication layer was in the range from 50 to 200 μm. On the other hand, thickness of the lubrication layer can be estimated from the measured load during mold oscillation.8,9,10,11,12,13,14,15) Nakamori et al.8) and Omiya et al.9) have reported the thickness is not more than 20 μm. These values8,9) are smaller than the values estimated by the model analyses of the previous groups.5,6,7)
In this study, lubrication and heat transfer was evaluated by measuring friction force attributed to the mold oscillation along with a lubrication model. The friction force was measured with a slab caster equipped with hydraulic oscillators, to understand how the friction force was affected by continuous casting factors such as the mold oscillation conditions, mold flux properties and casting speed.
Figure 1 shows a schematic diagram of the steel and mold flux components in the mold during the initial stage of the continuous casting process. The mold is in contact with the solidified shell through the lubrication layer of the liquid mold flux. Friction force is generated according to the flow direction with the magnitude of the velocity of the mold relative to the solidified shell. As reported by Nakamori et al.,8) when the mold oscillation system is considered to be a mechanical vibration model, the equation of motion is shown as Eq. (1).
| (1) |

Schematic diagram of steel and mold flux components in mold during continuous casting.
Figure 2 shows a schematic diagram of the mold oscillating system, where the mold is oscillated by a hydraulic cylinder. The displacement of the mold was measured with an inductive sensor, while the pressure of the cylinder was measured with a hydraulic sensor. Fcy is expressed by Eq. (2).
| (2) |

Schematic diagram of mold oscillation system.
Ff can be obtained from Eqs. (1) and (2).
| (3) |
M, k and CD can be determined off-line with the mold oscillation turned on. The condition was that the oscillation stroke was kept constant as 7 mm with the oscillation cycle changed from 50 to 200 count/min. In this case, the FMD curve is identical to the Fcy curve since Ff = 0. Thereby, these constants were determined as M = 60500, k = 0, CD = 400000 by the least squares method.
The difference between the maximum and the minimum values of the friction force Ff, sum of tensile and compressive stresses loaded to the solidified shell, in one cycle was defined as the average friction force. The normalized friction force ff is shown as Eq. (4).
| (4) |
The experimental conditions are listed in Tables 1 and 2. The carbon contents of the steels were in the range from 0.03 to 0.16 wt%. The casting velocity was from 1.0 to 2.2 m/min. The slab sizes were 220/250 mm in thickness and 2100 mm in width. Four types of mold fluxes with various viscosities and solidification temperatures were used to understand the effect of these properties. The oscillation stroke was chosen as 6, 7 or 9 mm with the cycle of 70 to 220 count/min. Negative strip time is defined as the duration with the velocity of the slab relative to the mold below zero, while the duration other than that positive strip time with the relative velocity over zero. During the negative strip time, compressive stress is loaded to the slab, whereas tensile stress is loaded to during the positive strip time. The mold oscillation cycle was controlled so that NSR (Negative Strip Ratio) became constant under all the casting conditions as shown in Fig. 3.
| Steel grade (wt% C) | 0.03–0.16 |
| Casting velocity (m/min) | 1.0–2.2 |
| Slab size (mm) | 220×2100, 250×2100 |
| Oscillation stroke (mm) | 6, 7, 9 |
| Oscillation cycle (counts/min) | 70–220 |
| Flux A | Flux B | Flux C | Flux D | |
|---|---|---|---|---|
| Solidified temperature, Tcs (°C) | 1090 | 1140 | 1120 | 1190 |
| viscosity at 1300°C, μ (Pa·s) | 0.3 | 0.08 | 0.05 | 0.09 |

Schematic diagrams of non-sinusoidal oscillation curves of mold.
Figure 4 shows the relationship between the casting velocity and friction force. As the casting velocity increases, friction force also increases. The difference between the maximum and minimum values of the velocity of the solidified shell relative to the mold was defined as ΔVr. The mold oscillation cycle was controlled for the casting velocity to be proportional to the relative velocity. The friction force became larger as the relative velocity increased. M. Suzuki reported that the mold flux behaved as if it was totally fluid with high casting velocity. Further, the friction force was found to be proportional to the casting velocity.4) When lubrication between the mold and the solidified shell behaves as fluid, the friction force is proportional to the relative velocity, as understood in Eq. (5).
| (5) |

Relationship between friction force and casting velocity.
Therefore, as the casting velocity was 1.4 m/min or higher, lubrication between the mold and the solidified shell in this study was considered to behave as fluid.
Meanwhile, the friction force was constant with the casting velocity in the range from 1.0 to 1.2 m/min. In the case of solid lubrication, the friction force is expressed by Eq. (6).
| (6) |
Therefore, lubrication between the mold and the solidified shell was considered to behave as solid with the casting velocity in the range from 1.0 to 1.2 m/min. It is considered that this condition is caused by the high solid friction of the mold flux due to low throughput, which agrees with the results reported by Omiya et al.9)
3.2. Effect of Properties of Mold Flux on Friction ForceFigure 5 shows the relationship between the friction force and the four types of mold fluxes. In Fig. 5(a), the oscillation stroke was kept constant as 6 mm, applying mold fluxes A and C with the casting velocity from 1.4 to 2.2 m/min. The friction force is proportional to the viscosity of the lubrication layer with the lubrication behaved as fluid. The friction force of flux C is higher than that of flux A in spite of the lower viscosity of flux C. This means that the friction force cannot be determined by the viscosity of the mold flux. Focusing on the solidification temperature, it is seen that the low viscosity flux is relatively high, which would contribute to the increase of the friction force. In Fig. 5(b), mold fluxes B and D with viscosities of 0.08 and 0.09 Pa·s respectively were used with the casting velocity from 1.4 to 2.2 m/min while holding the oscillation stroke constant as 7 mm. Compared with similar viscosity of flux B and D, the friction force was the largest with flux D, whose solidification temperature was the highest. Similarly to the case of the 6 mm stroke, this experiment also has revealed that higher solidification temperature results in higher friction force in the mold of continuous casting process.
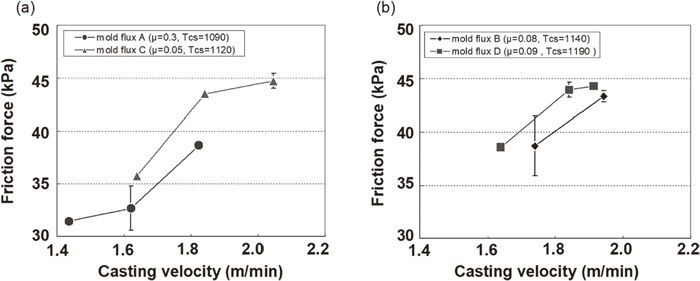
Influence of mold flux on friction force. (a) oscillation stroke: 6 mm, (b) oscillation stroke: 7 mm.
Figure 6 shows the relationship between the friction force and properties of mold flux. The friction force cannot be determined by the viscosity of the mold flux as shown in Fig. 6(a). On the other hand, as the solidification temperature becomes higher, the friction force increases as shown in Fig. 6(b). The fact indicates that the solidification temperature would contribute to the increase in the friction force. In addition, the friction force is higher with the oscillation stroke of 6 mm than of 7 mm. This will be discussed next.

Relationship between mold flux properties and friction force. (a) viscosity, (b) solidified temperature.
Figure 7 shows the relationship between the friction force and the mold oscillation stroke applying mold flux C with the constant casting velocity of 1.8 m/min. Obviously, with increasing the oscillation stroke, the friction force decreases. It is known that mold flux consumption increases when the oscillation stroke is longer.5,17) In other words, the gap between the hook and the solidified flux is larger. Under this condition, a larger amount of the mold flux flows into the gaps to achieve more lubrication.

Influence of oscillation stroke on friction force (mold flux C).
In the case of liquid lubrication, the friction force is proportional not only to the mold flux viscosity but also to the relative velocity between the mold and the solidified shell. Meanwhile, it is inversely proportional to the thickness of the lubrication layer. However, in Fig. 5, the friction force with the lower viscosity flux is higher than that with the higher viscosity one. It should be noted that the values of viscosities at 1300°C are employed as shown in Table 2. It is presumed that the temperature of the lubrication layer is different from 1300°C. It is necessary to estimate the temperature of the lubrication layer, which can be estimated by a one-dimensional heat transfer calculation. Assuming that thickness of each layer in the mold is uniform, a schematic view of the temperature distribution in the mold can be drawn as Fig. 8. Assuming that no air gap exists between the mold and the solid flux layer, heat flux is expressed by Eq. (7).
| (7) |
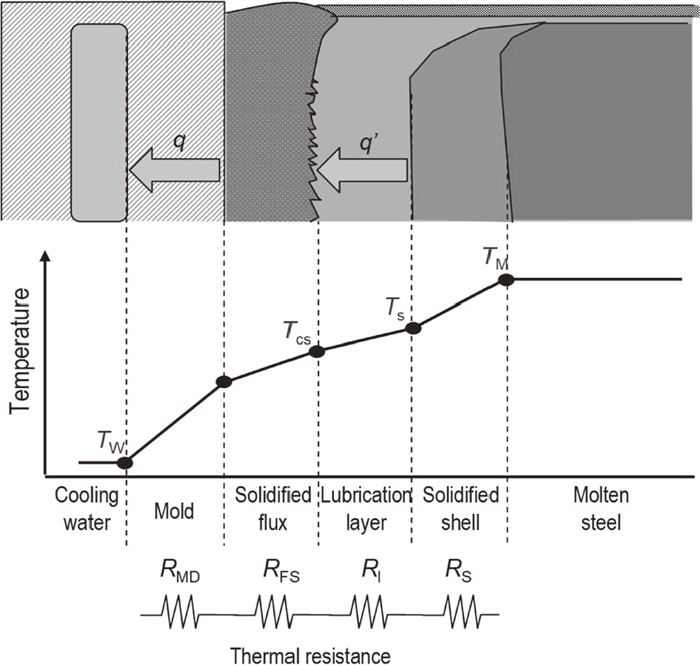
Temperature distribution between molten steel and copper mold.
Applying the temperature increase ΔT of the mold cooling water, heat flux can be obtained by Eq. (8).
| (8) |
Table 3 shows the conditions of the heat transfer calculation. Tcs can be approximated as the solidification temperature of the flux. Here, the thickness of the lubrication layer is once set to be 100 μm. The thermal conductivity K of 1.31 W/mK, has been reported by Yamauchi et al.18) The combination of Eqs. (7) and (8) along with the values in Table 3 shows that the temperatures on the solidified shell side of each flux range from 1200 to 1300°C proving that the average temperature in the lubrication layer is lower than 1300°C.
| Flux A | Flux B | Flux C | Flux D | |
|---|---|---|---|---|
| q (W/m2) | 1.67×10⁶ | 1.38×10⁶ | 1.45×10⁶ | 1.41×10⁶ |
| dl (m) | 100×10–6 | |||
| K (W/m·K) | 1.31 | |||
| Ts (°C) | 1217 | 1245 | 1230 | 1298 |
It is known that the viscosity of the mold flux increases as the temperature of the mold flux decrease. In order to estimate the viscosity of the lubricating layer, viscosity of each flux was measured by using a rotational viscometer in the temperature range from 1150 to 1300°C to have temperature dependence of viscosity. The Ar gas flow rate was set to be 2.5 L/min. Figure 9 shows the temperature dependence of the viscosity of each flux. At 1300°C, flux A has the highest viscosity. However, as the temperature decreases, the viscosities of the fluxes with the higher solidification temperatures increase sharply. One can understand that due to these phenomena, the friction forces with the higher solidification temperature fluxes are higher independently on the viscosity values at 1300°C, usually representing this property. This fact indeed implies that one has to take temperature dependence of viscosity into account.

Temperature dependence of viscosity of mold flux.
The temperature of the lubrication layer is calculated in order to establish a friction force model considering the temperature dependence of the flux viscosity as described above. It is known that the temperature dependence of the viscosity of glass melts is represented by Vogel-Tamman-Fulcher’s rule19,20,21) (VTF rule), which is shown in Eq. (9). Table 4 shows the fitting parameters of each flux.
| (9) |
| Flux A | Flux B | Flux C | Flux D | |
|---|---|---|---|---|
| C0 | 51.3 | 64.1 | 62.9 | 22.2 |
| C1 | 0.15 | −0.84 | −0.70 | −0.51 |
The temperature of the lubrication layer is defined by Eq. (10).
| (10) |
Ts is obtained from Eq. (7), and then the temperature of the lubrication layer is expressed by Eq. (11).
| (11) |
The combination of Eqs. (5), (9) and (11) gives the friction force expressed by Eq. (12) as a function of the lubrication layer thickness dl.
| (12) |
The lubrication layer thickness can be calculated by using the measured friction force and mold heat flux. Figure 10 shows the casting velocity dependence of the lubrication layer thickness for each mold flux indicating that the lubricating layer ranges from about 40 to 50 μm. It can be seen that the thickness decreases as the casting velocity increases, which is similar to the behavior reported by Nagano et al.6) Nakamori et al.,8) and Omiya et al.9) have reported the thickness of the lubrication layer is not more than 20 μm based on the measurements of the friction force. Hanao et al.7) has reported that the thickness of the lubrication layer estimated by direct sampling from the upper part of the mold is from 50 to 200 μm. It is postulated that the results of this study estimated from the averaged friction force in the mold also give the thickness of the lubrication layer averaged as for the casting direction. Therefore, the averaged lubrication layer thickness may be underestimated focusing on the upper part of the mold corresponding to the positions beneath the meniscus. However, the thickness of 40 to 50 μm are closer to the directly measured values7) than the values previously estimated from the friction force.8,9) This indicates that it is quite necessary to consider the temperature dependence of the viscosity of the mold flux to create the lubrication model.

Relationship between thickness of lubrication layer and casting velocity.
Figure 11 shows the relationship between the thickness of the lubrication layer and the heat flux in the mold. The heat flux in the mold was calculated from the temperature difference of the mold cooling water (Eq. (8)). It can be seen that as the lubrication layer thickness decreases, the heat flux increases. One reason for this increase is the decrease in thermal resistance of the lubrication layer. On the other hand, the lubrication layer tends to be thinner with increasing the casting velocity, as shown in Fig. 10. Therefore, another reason for the increase of heat flux is the increased throughput due to higher casting velocity.

Relationship between thickness of lubrication layer and heat flux in mold.
Compared at the same lubrication layer thickness, fluxes B, C and D, which have the higher solidification temperatures obviously show the lower heat fluxes than flux A with the higher viscosity. In general, the heat flux through the mold flux film is influenced by conditions such as heat conduction, radiation and the air gap between the lubrication layer and the solid flux layer. In addition, the thermal conductivity of the mold flux does not vary so much within the actual range of the flux compositins.22) It is considered that the thermal resistances of the lubrication layer exhibit the values similar to each other in all the fluxes tested in this study under the condition of the same lubrication layer thickness. The present result has proven that, in an actual continuous casting machine, mild cooling condition can be accomplished with the flux with higher solidification temperature that brings the higher thermal resistance of the solid flux layer.
Lubrication and heat transfer was evaluated by measuring friction force attributed to the mold oscillation along with a lubrication model. The friction force was measured with a slab caster equipped with hydraulic oscillators, to understand how the friction force was affected by continuous casting factors such as the mold oscillation conditions, mold flux properties and casting speed. The main results are summarized as follows.
(1) The friction force was proportional to the velocity of the slab relative to the mold. The lubrication condition behaved as if it was fluid with the casting speed higher than 1.4 m/min.
(2) Higher solidification temperature of mold flux results in higher friction force in the mold. This was considered to be due to an increase of viscosity near the solidification temperature.
(3) The temperature dependence of viscosity of the molten flux was accounted for to develop a new fluid lubrication model. The present model showed that the lubrication layer thickness was approximately 50 μm.
(4) Heat transfer through the mold flux was evaluated by the lubrication model revealing thermal resistance of the solidified flux layer, providing that the resistance caused by the crystallized flux was larger than that by glassy flux.