Steelmaking
Dissolution Behavior of Mg from MgO–C Refractory in Al-killed Molten Steel
2018 Volume 58 Issue 3 Pages 488-495
Details
2018 Volume 58 Issue 3 Pages 488-495
MgO–C refractory is a widely employed refractory in steel refining and it is considered as a Mg source to form MgO·Al2O3 spinel inclusions in steel melt. In this study, MgO–C refractories with various carbon contents were immersed into Al-killed molten steel to investigate the dissolution behavior of Mg from MgO–C refractory. The result showed that Mg gradually dissolved into the steel melt from the refractory, and spinel inclusions were formed. Al in the steel melt reduced MgO in the refractory and consequently, Mg was dissolved into the steel melt. The dissolved Mg increased with the Al content in the steel melt. Moreover, C in the MgO–C refractory also reduced MgO in the refractory and supplied Mg to the steel melt. However, when the C concentration in the refractory was lower than 10 mass%, Mg was not supplied. The reduction in MgO by Al and C occurred independently, and the Mg content in the steel was the sum of the Mg supplied by these reactions. In some regions at the refractory–steel melt interface, a spinel layer was observed; however, this layer was not formed uniformly.
MgO·Al2O3 spinel inclusions (henceforth referred to as spinel inclusions for simplicity), which have the property of high melting temperature and poor deformability, are harmful to both the surface quality and fatigue resistance of steel.1,2) Moreover, the spinel inclusions are easy to sinter with the Al2O3–C nozzle materials at high temperature and subsequently cause clogging, which leads to problems in continuous casting operations.3,4) Therefore, spinel inclusions have harmful effects on both the steel product and production operations. A significant number of laboratory and field experiments have been performed on this subject.5,6,7,8,9,10,11,12,13,14,15,16,17,18,19,20,21,22,23,24,25)
MgO–C refractory is one of the most widely employed refractories in steel refining, owing to its high resistance to erosion and thermal shock. However, when in contact with steel melt, MgO–C refractory is considered as a source of Mg to form spinel inclusions. Brabie et al.26) investigated the mechanism of the reaction between MgO–C refractory containing 20 mass% of carbon and Al-killed molten steel. They observed that Mg dissolved into the steel melt from the MgO–C refractory and spinel inclusions were formed. For the supply mechanism of Mg from the MgO–C refractory, they identified the generation of Mg vapor by the reaction between carbon and MgO in the refractory. J. Shan et al.27) investigated the carbo-thermic reduction of magnesia. In their study, pellets of magnesia and carbon powders (mole ratio 1:1) were charged to a porous tube made of alumina and immersed into the steel melt in the temperature range of 1853–1923 K. They observed that the reaction rate was slow, and the dissolved Mg concentration in the steel melt was approximately 1–2 ppm. Recently, one of the authors of this study28,29) investigated the effect of MgO–C refractory containing 20 mass% of carbon on the formation rate of spinel inclusions. They concluded that carbon reduction of MgO was the primary mechanism of the Mg supply. However, Harada et al.30) observed that Al in the steel melt reduced the MgO in the refractory and Mg was dissolved into the steel melt. According to this mechanism, MgO in the MgO–C refractory supplies Mg to the steel melt owing to the reduction by Al in the steel. Hence, the dissolution mechanism of Mg in steel from MgO–C refractory should be clarified. Moreover, the knowledge of the effect of C content in the refractory and Al content in the steel melt on the dissolution behavior of Mg from the MgO–C refractory is still limited.
In this study, laboratory experiments were performed to study the reaction mechanism between MgO–C refractory and Al-killed steel. MgO–C refractory rods with various carbon contents were immersed into molten steel with different Al contents. By this investigation, the effect of the C content in the refractory and Al content in the steel melt on the dissolution behavior of Mg from MgO–C refractory was clarified.
In order to investigate the effect of C content in MgO–C refractory on the dissolution behavior of Mg, refractories with different C contents were studied, namely 0.7% (G00), 5.6% (G05), 10.5% (G10), and 20.4% (G20). All the compositions in this paper are indicated in mass percentage, unless otherwise specified. In this experiment, steel melt containing approximately 11% Cr was used because spinel formation has been previously studied in stainless steel.4,9,14,16) In order to investigate the effect of Al content, steel with an extremely high content of Al (0.25%) was studied in addition to steel with typical contents of Al (0.05%–0.08%). A dense Al2O3 crucible was used as the container for the steel, to establish the Al–Al2O3 equilibrium to simulate the Al-killed steel. Under this condition, the dissolution rate of Mg from the refractory into the Al-killed steel melt can be investigated.
A commercial MgO–C refractory rod with a square shape was employed; the refractory was supplied by the Kurosaki-Harima Corporation. Each side of the rod was approximately 6 mm and its length was approximately 80 mm. In order to remove the binder (phenolic resin) and other volatiles in the refractory, heat treatment was performed before the experiment. During the heat treatment, the refractory specimen was embedded in graphite and held at 1273 K for 3 h under a CO atmosphere. The composition and microstructure of the employed refractory are shown in Table 1 and Fig. 1, respectively. The refractory mainly contained three phases: magnesia, C, and impurity. The magnesia phase was divided in two shapes: a large isolated lump, and a small and homogeneously distributed shape in the C phase. The impurities were mainly located in the large-isolated-lump magnesia phase. The main phases and chemical composition of each phase were the same for all the employed MgO–C refractories, regardless of the C contents. The only difference in the microstructure was the interfacial area between the magnesia and C phases.
| Property Sample | Apparent density/ g cm−3 | Bulk density/ g cm−3 | Apparent porosity/% | Chemical composition/% | ||
|---|---|---|---|---|---|---|
| MgO | C | Others | ||||
| G00 | 3.47 | 3.25 | 6.4 | 97.8 | 0.7 | 1.5 |
| G05 | 3.36 | 3.22 | 4.2 | 92.9 | 5.6 | 1.5 |
| G10 | 3.24 | 3.15 | 2.9 | 87.9 | 10.5 | 1.5 |
| G20 | 3.04 | 2.98 | 2.1 | 78.0 | 20.4 | 1.6 |

Microstructure of the MgO–C refractory with different carbon contents.
In order to prepare the master steel, electrolytic Fe together with high-purity Cr (99.9%) and Al (99.999%) metals were melted in an argon arc furnace. The target composition of the master steel was Fe-11%Cr-0.25%Al (high Al) and Fe-11%Cr-0.05–0.08%Al (low Al).
2.2. Experimental ProcedureThe experimental set-up and experimental conditions of the molten steel–refractory reaction are shown in Fig. 2 and Table 2, respectively. The experiment was performed using an induction furnace. Prior to heating, 200 g of the prepared metal was loaded into a dense Al2O3 crucible. Subsequently, the chamber of the furnace was subjected to vacuum conditions, and thereafter purged with purified argon. This process was repeated three times. In order to remove the oxygen, argon (99.9999%) was passed through heated Mg chips (573 K) and flowed into the chamber of the furnace. Subsequently, the metal was heated to 1873 K, and the temperature of the molten steel was measured by immersing a thermocouple into the steel melt; the thermocouple was covered by a dense Al2O3 protection tube. Subsequently, the pre-heated MgO–C square rod was immersed into the molten steel, and this moment was considered as the starting point of the experiment. Prior to immersion, the rod was positioned just above the surface of the steel, and pre-heated for 3 h. Following its immersion for a pre-determined time, the rod was removed and air-cooled, and the molten steel was rapidly quenched with water. The rod was immersed for 5, 30, 60, or 120 min.

Schematic of experimental apparatus.
| MgO–C refractory | Name | Al content/ % | Immersion time/min | Temperature/ K | Crucible type |
|---|---|---|---|---|---|
| G00 | G00 - Low Al | 0.08 | 5, 30, 60, 120 | 1873 | Al2O3 |
| G00 - High Al | 0.25 | 5, 30, 60, 120 | 1873 | Al2O3 | |
| G05 | G05 - High Al | 0.25 | 5, 30, 60, 120 | 1873 | Al2O3 |
| G10 | G10 - High Al | 0.25 | 5, 30 60 | 1873 | Al2O3 |
| G20 | G20 - Low Al | 0.05 | 5, 30, 60 | 1873 | Al2O3 |
| G20 - High Al | 0.25 | 5, 30, 60, 120 | 1873 | Al2O3 |
After quenching, the central portion of the metal was cut for both chemical composition analysis and inclusion observation. For the chemical analysis, the Al and Mg contents were analyzed using inductively coupled plasma atomic emission spectroscopy (ICP-AES). The total oxygen (T.O) and C contents of the steel sample were measured using an infrared X-ray absorption method. The inclusions were analyzed manually using an electron probe microanalyzer with a field emission electron gun (FE-EPMA) and the contents of Mg, Al, Fe, Ca, O, and Cr were analyzed. The inclusions were assumed to consist of MgO, Al2O3, and CaO, and the analyzed values of Mg, Al, and Ca were converted to oxide values using a stoichiometric relationship. The values of Fe and Cr were ignored as it would be caused by the analysis of the metal phase. The value of S was also ignored, owing to its low concentration. Ten to fifteen inclusions were analyzed for each sample and their average composition was used.
The changes in the steel compositions including Mg, Al, T.O, and C with the immersion time of the refractory rod are shown in Figs. 3, 4, 5, 6, respectively. As shown in Fig. 3, the Mg content increased with immersion time and reached a maximum at approximately 60 min. Among these experiments, the highest Mg content was obtained by immersing G20 refractory into high-Al steel melt, and the dissolved Mg content was 3.5 ppm. In the experiments with G00–high-Al, G05–high-Al, G10–high-Al, and G20–low-Al, the highest dissolved Mg content was approximately 2 ppm. In the experiment with G00–low Al, the highest dissolved Mg content was 1 ppm. Therefore, the dissolution of Mg from MgO–C refractory was enhanced when it contacted with steel melt of high-Al content or when its C content was high.

Change in the Mg content in molten steel with immersion time.

Change in the Al content in molten steel with immersion time.

Change in the total oxygen content in molten steel with immersion time.

Change in the C content in molten steel with immersion time.
According to Fig. 4, throughout the immersion period, the Al content remained almost constant under all the experimental conditions, which indicates that the oxidation of Al during the immersion of the refractory rod was negligible. The T.O content decreased gradually with immersion time and finally reached approximately 20 ppm after 60 min, as shown in Fig. 5. Both the T.O content and the change behavior of the T.O content were almost similar in both low- and high-Al experiments, regardless of the C content in the refractory.
As shown in Fig. 6, the increase in the C content in the steel melt, which was attributed to the dissolution from the MgO–C refractory, was rapid within 5 min, and the dissolved C content in the steel melt increased with the initial C content in the refractory.
The average composition of the analyzed inclusions in the steel is shown in Fig. 7. Under every experimental condition, the initially observed Al2O3 inclusions gradually transformed into spinel inclusions. At 5 min, both Al2O3 and spinel inclusions were detected. After 30 min, the Al2O3 inclusions disappeared and the inclusions had changed completely into spinel. The MgO content of these inclusions are close to the saturation in MgO·Al2O3 spinel31) at 1873 K, as shown in Fig. 8. Therefore, the inclusions are recognized as MgO-saturated spinel. Although the dissolved Mg content in the steel melt varied from 1 to 3.5 ppm in this study, depending on the experimental conditions, the transformation behavior of the inclusions was the same. Moreover, the inclusion transformation completed before the Mg content in steel reached the highest value.
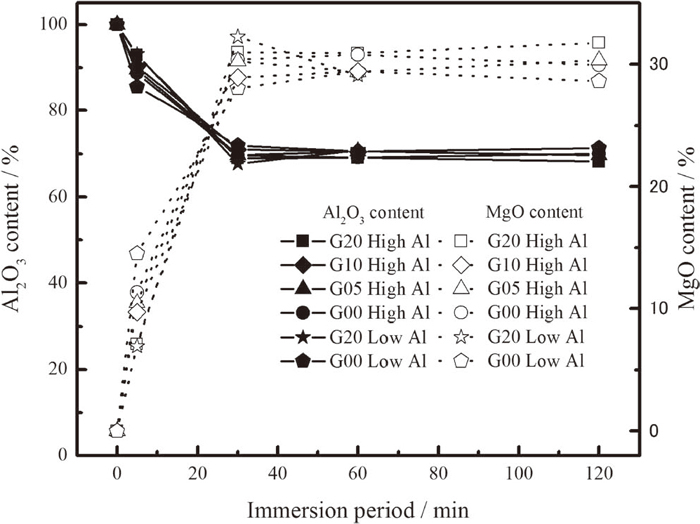
Change in the inclusion composition with immersion time.

Typical morphology of the inclusion in G05 high Al experiments.
Figures 9(a) and 9(b) show the elemental mapping images of Al, Mg, O, Ca, Cr, and C on the cross-section of the G00 rod immersed in low-Al steel melt for 120 min and G20 rod immersed in high-Al steel melt for 120 min, respectively. In Fig. 9(a), an Al-enriched area was observed near the surface of the refractory rod and the MgO content of these Al-enriched products are close to the saturation in MgO·Al2O3 spinel31) at 1873 K. Therefore, the Al-enriched product is recognized as MgO saturated spinel; however, the spinel was detached from the refractory rod bulk and was partially formed at the interface between the refractory and steel. In Fig. 9(b), the spinel was not observed at the interface. Figure 10 shows the elemental mapping images of Mg, Al, O, Cr, and Ca at the interface between the Al2O3 crucible and steel for the G20–high-Al experiments after 120 min. A Mg-enriched area was observed near the surface of the crucible and the Al2O3 content of these Mg-enriched products are close to the saturation in MgO·Al2O3 spinel31) at 1873 K. Therefore, the Mg-enriched product is recognized as Al2O3 saturated spinel. The formed spinel was partially distributed at the interface and did not cover the crucible surface entirely.

Elemental mapping at the MgO–C refractory–steel melt interface: a) G00–low-Al experiment of 120 min immersion b) G20–high-Al experiment of 120 min immersion.

Elemental mapping at the Al2O3 crucible–steel melt interface (G20–high-Al 120 min immersion).
The observed phases at the interface between the refractory and steel after 120 min for all the experiments are summarized in Table 3. In this table, M represents MgO, MS represents MgO-saturated spinel, A represents Al2O3, and AS represents Al2O3-saturated spinel formed at the interface. Because the spinel did not completely cover the refractory rod, both MgO and MgO-saturated spinel were detected at the interface of the refractory. The observed phases at the interface of the Al2O3 crucible and steel after 60 or 120 min are also shown in Table 3. Because the formed spinel was partially distributed at the interface of Al2O3 crucible, both Al2O3 and Al2O3-saturated spinel were detected.
| Refractory type | G00 | G05 | G10 | G20 | ||
|---|---|---|---|---|---|---|
| Al content/% | Low | High | High | Low | Low | High |
| Refractory – steel melt interface | M & MS | M & MS | M & MS | M & MS | M | M |
| Crucible – steel melt interface | A | A & AS | A & AS | A & AS | A & AS | A & AS |
PS: M is MgO; MS is MgO saturated spinel; A is Al2O3; AS is Al2O3 saturated spinel
Both the C reduction and Al reduction may occur as reactions that cause the dissolution of Mg from MgO–C refractory. In the following section, the role of these two reactions is clarified.
The effect of Al content in steel melt on the Mg content after 60 min is shown in Fig. 11. From the results, it was observed that the Al in the steel had a positive effect on the Mg dissolution from the MgO–C refractories. The effect of C content in the refractory on the dissolved Mg content after 60 min is shown in Fig. 12. When the C content in the refractory was less than 10%, its effect on the Mg dissolution was negligible, whereas more Mg was dissolved in the steel melt when the refractory with 20% C was employed.

Effect of the Al content in steel melt on Mg dissolution behavior from MgO–C refractory.

Effect of the C content in refractory on Mg dissolution behavior from MgO–C refractory.
In the cases of G00–low-Al or G00–high-Al, where the C content in the refractory was almost zero, only the Al reduction reaction occurred and 1–2 ppm of Mg was dissolved in the steel. By comparison of the results between G20–high-Al and G00–high-Al, or between G20–low-Al and G00–low-Al, the Mg content in the steel was approximately 1 ppm higher when G20 was immersed. This result indicates that, in addition to the Al reduction reaction, the C reduction reaction occurred when MgO–C refractory of high C content was in contact with the steel.
By comparing the results of G20–high-Al with G20–low-Al, the Mg content was increased by approximately 1 ppm with the increase in the Al content in the steel. By comparing the results of G00–high-Al with G00–low-Al, the increase in the Mg content with the increase in Al content was also approximately 1 ppm. Therefore, despite the C content in the refractory, the amount of Mg supplied by the Al reduction reaction is the same. On the contrary, the increase of Mg content by the immersion of G20 was approximately 1 ppm despite the Al content, as shown previously. These results indicate that the reduction reactions of MgO by Al in the steel and C in the refractory occurred independently.
The equilibrium Mg content owing to C reduction by the reaction shown in Eq. (1) was calculated. In this calculation, the activities of MgO and C in the refractory were both assumed as unity (solid pure substance reference). The calculation of the C reduction reaction was performed using Eqs. (2) and (3) and the activity coefficient of Mg was calculated by Wagner’s equation using the interaction parameters.32)
| (1) |
| (2) |
| (3) |
The differences in the dissolved Mg content between G20–high-Al and G00–high-Al, and between G20–low-Al and G00–low-Al, increased from 5 to 30 min, but did not increase after 30 min. This shows that the C reduction occurred during the period of 5 to 30 min. On the contrary, the dissolution of C in the refractory into the steel melt mostly occurred before 5 min. Hence, the C reduction started after the dissolution of C at the immersed refractory surface. This indicates that the dissolution of C at the refractory surface did not affect the C reduction reaction. After the dissolution of C, the surface of the immersed refractory became porous and the porosity should increase with the C content in the refractory. The Mg vapor, generated by the C reduction inside the refractory, diffused through the pores and dissolved into the steel melt. Therefore, the concentration of the dissolved Mg content would be influenced by the porosity. However, from the experimental results, Mg dissolution owing to C reduction only occurred for G20 experiments and in order to explain this in detail, further investigation is required.
The equilibrium Mg content owing to Al reduction shown in Eq. (4) was calculated using the equilibrium constants summarized in Table 4.
| (4) |
In a previous study, the authors have conducted a similar experiment using magnesia–chromite refractory.35) In this case, the inclusion composition did not change and remain as Al2O3 and Al2O3-saturated spinel fully covered the surface of the immersion rod and refractory. The steel melt compositions in this study together with the results of the previous study are plotted on an MgO/MgO·Al2O3/Al2O3 stability diagram, as shown in Fig. 13. As the equilibrium constant of the reaction between oxygen and magnesium in molten to form MgO, KMg(1) and KMg(2) are used and the results are shown in Figs. 13(a) and 13(b), respectively. Compared with the result for magnesia–chromite refractory, the Mg content in this study was higher. Therefore, in both cases of KMg, the steel melt composition after immersion for 30 min was located in the MgO·Al2O3 stable region. In the case of magnesia–chromite refractory, as the surface of the refractory is fully covered by Al2O3-saturated spinel, the Mg content did not enter the MgO·Al2O3 stable region and the inclusion composition did not change. Compared to the previous result, by using MgO–C refractory in this study, the MgO-saturated spinel was formed at the refractory surface, but this product only partially covered the surface. Consequently, the magnesia phase in the MgO–C refractory was in direct contact with the steel melt and Mg was continuously supplied to the steel melt owing to Al reduction. In addition, when the carbon content in the refractory was high, Mg supply by C reduction occurred simultaneously. Therefore, the Mg content entered the MgO·Al2O3 stable region and the Al2O3 inclusion transformed into spinel.

Composition of Al and Mg during the experiment on the stability diagram of MgO/MgO·Al2O3/Al2O3 system calculated by (a) KMg(1) and (b) KMg(2), respectively.
Furthermore, Harada et al.30) performed a similar experiment using a dense MgO rod (protection tube for a thermocouple). In their study, the Mg content in the steel did not enter the MgO·Al2O3 stable region and the inclusion composition did not change from Al2O3 to spinel. In this study, even though the C content in the refractory was very low (G00), the Mg content increased and the inclusions were transformed to spinel. The main difference was the morphology of the spinel layer formed at the refractory surface. In the case of using dense MgO, the surface of the rod was fully covered by spinel. Therefore, the inhomogeneous structure of the commercial refractory played an important role in the transformation of the inclusions from Al2O3 to spinel.
In this study, MgO–C refractories with various C contents were immersed into Al-killed molten steel (0.05% and 0.25% Al) to investigate the Mg dissolution behavior from the MgO–C refractory into the steel melt. The composition changes of the steel and inclusions with the immersion time were analyzed and the interface between refractory and steel was observed. The results are summarized as follows:
(1) As the immersion period of the MgO–C refractory rod increased, Mg was gradually dissolved into the steel and spinel inclusions were generated, regardless of the C content in the refractory and the Al content in the steel.
(2) The dissolved Mg increased with the Al content in the steel melt. This result indicates that Al in the steel reduced the MgO in the MgO–C refractory and subsequently supplied Mg to the steel.
(3) The Mg content further increased when the MgO–C refractory containing 20% C was used. This indicates that the C in the MgO–C refractory also reduced the MgO in the refractory and supplied Mg.
(4) The reduction of MgO by Al and C occurred independently, and the Mg content in the steel is the sum of the Mg supplied by these reactions.
(5) In every case, the Al2O3 inclusions changed to spinel and the MgO content in the inclusion was greater than that of the Al2O3-saturated spinel. At the interface between the refractory and steel, the spinel layer was partially formed but at the other interface, the MgO was directly in contact with the steel.
The authors are grateful to the Kurosaki-Harima Corporation for supplying the MgO–C refractory rods. The authors gratefully acknowledge the financial support provided by the Iron and Steel Institute of Japan (ISIJ Research Promotion Grant) and the Technical Association of Refractories of Japan.