Ironmaking
Influence of Temperature Distribution in Combustion Chamber on Coke Cake Discharging Behavior
2018 Volume 58 Issue 4 Pages 633-641
Details
2018 Volume 58 Issue 4 Pages 633-641
To achieve stable operation of coke oven batteries, a numerical model for estimating the clearance between the coke cake and the coke oven wall was developed. The influence of the temperature distribution in the combustion chamber on coke cake contraction was investigated by using the developed model. As a result, the following findings were obtained.
1) A temperature decrease on the coke side (CS) results in a larger clearance decrease at the end of the coke chamber compared with a temperature decrease on the machine side (MS).
2) The clearance decrease at the end of CS causes a higher pushing load of coke cake. Therefore, improvement of the CS flue gas temperature is particularly important for reducing the pushing force of the coke cake.
In recent years, coke ovens in Japan have deteriorated remarkably, and as a result, equipment problems are also remarkable, causing problems such as joint damage, dropping out and overhang of the furnace wall bricks, and insufficient carbonization of the coke cake due to defects in combustion in the combustion chamber (flue). For this reason, it is difficult to discharge the coke cake from the coke chamber, and negative effects such as reduced coke production and increased coke oven damage are concerns. In addition, improvement of coke strength has been pointed out from the viewpoint of low RAR operation of the blast furnace to meet recent CO2 reduction targets.1,2) Generally, however, high strength coke is produced by lowering the content of volatile matter in the blended coal or by increasing the bulk density of the coal at charging. Since these operations cause insufficient contraction of the coke cake and increased swelling pressure during carbonization, the risk of operational trouble is expected to increase further in the future. Therefore, a stable operation technique for aged coke ovens is an urgent issue.
Physical resistance to coke cake discharge (referred to as “pushing”) from the coke chamber after carbonization is affected by various factors. Among these, the effect of the clearance between the coke cake surface and the furnace walls (Fig. 1) is large. Since pushing resistance becomes larger as the clearance decreases,3) clarification and control of the clearance factor are considered to be particularly important. Conventionally, measurement of clearance by a carbonization test and estimation by mathematical models have been attempted. A 1-dimensional mathematical model of the chamber width direction was developed, and the influence of coal blending and carbonization conditions on clearance was studied.4,5,6) Since estimation of clearance by mathematical models can easily deal with blending conditions, it is possible to analyze the influence of the properties of the coal. However, it is necessary to consider operating conditions and chamber conditions in actual furnace. In these, the latter chamber conditions usually has a 3-dimensional distribution. For example, in the combustion chamber, there is a distribution in the combustion gas temperature in each flue, and this tendency is particularly remarkable in aged furnaces. Therefore, a temperature distribution also occurs in the furnace wall that supplies heat to the inside of the coke chamber, which is thought to affect the clearance of the coke cake after carbonization. Since it is practically difficult to treat the influence of these various distributions 1-dimensionally, a 2- or 3-dimensional analysis is required. However, few such examples have been considered.
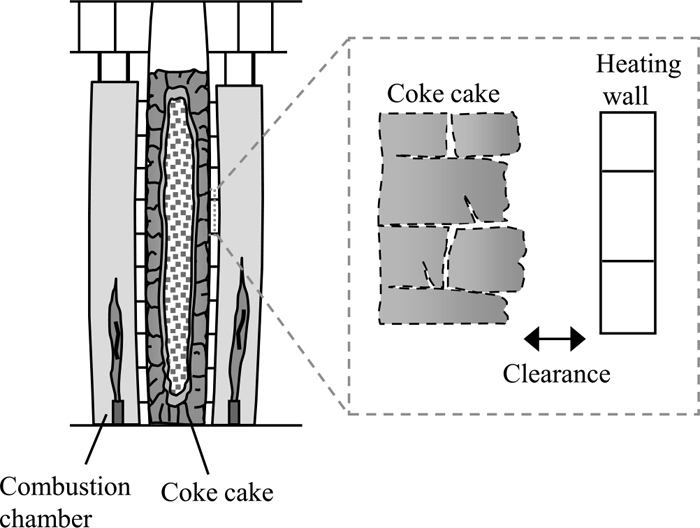
Schematic diagram of clearance in coke chamber.
In this paper, the authors developed a mathematical model to estimate the clearance between the coke cake and the furnace wall. Using the developed model, we evaluated the influence of the furnace body conditions and coal charging conditions on clearance in an aged furnace and investigated guidance for stable operation.
During carbonization, coal changes from a powder layer to a plastic layer and coke layer. Based on these behaviors, in this model, the amount of deformation of the coke was calculated by considering the swelling pressure of the plastic layer due to the generation of pyrolysis gas and the contraction force6) of the semicoke layer in resolidification. Based on the method of Aoki et al.,7) the amount of deformation was calculated by the finite element method assuming the coal/coke layer as a continuum. Figure 2 shows the flow chart of the numerical model. The clearance is calculated through heat transfer, gas pressure and stress analyses of the coal/coke layer. The analysis method of each process will be described below.
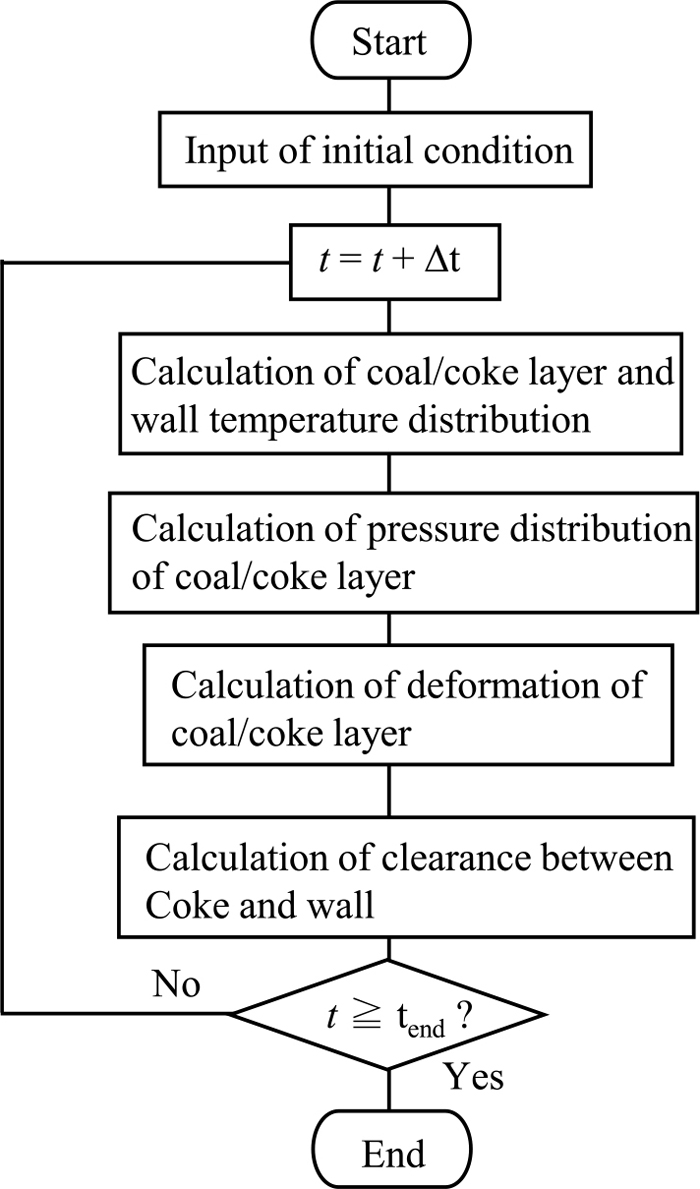
Procedure of calculation of clearance.
Heat transfer to the coal/coke layer in the coke chamber is carried out by combustion of coke oven gas and mixed gas in the combustion chamber. Therefore, in this model, heat transfer from the combustion chamber to the coke chamber was modeled by considering the following processes.
(1) Heat transfer from the combustion gas to the furnace wall in the combustion chamber
(2) Heat conduction in the furnace wall
(3) Heat conduction or heat transfer from the furnace wall (heating wall) to the coal/coke layer in the coke chamber
(4) Heat conduction in the coal/coke layer
In the above, steps (2) and (4) are calculated based on Eq. (1) as follows:
| (1) |
It was assumed that the flow velocity of pyrolysis gas in the coal/coke layer is low, and the pressure distribution is in a quasi-stationary state. The Darcy’s law was applied to the gas flow in the coal/coke layer.7) as following equation:
| (2) |
| (3) |
| (4) |
Assuming that the coal/coke layer is a continuum, the equilibrium equations of the forces in the layer are as follows:
| (5) |
To verify the validity of the developed model, the actual clearance was measured and compared with the calculation results. The experimental conditions are shown in Table 1. A schematic diagram and the calculation domain of the experimental apparatus are shown in Fig. 3. Coal was charged in a carbon vessel having dimensions of 190 mm×114 mm×120 mm and carbonized with small furnaces, three of which were prepared for the same blended coal, and the clearance was measured. The coal was prepared by adjusting
| (6) |
| Temperature | [K] | 1323 |
| Coking time | [min] | 260 |
| Initial bulk density of coal | [kg/m3] | 725–775 |
| [%] | 0.94–1.24 | |
| logMF | [log(ddpm)] | 2.7 |
| Coal size | [mass%] | −3 mm: 100 |

Schematic diagram of experimental apparatus and calculation domain.

Schematic diagram of measurement of clearance.
Figure 5 shows the calculated shape and temperature distribution of the coke cake 6, 120 and 260 minutes after the start of heating. Generally, in the coke cake after carbonization, a warping phenomenon14,15) showing a curved shape with respect to the heating surface can be seen due to a difference in the contraction rate of the semicoke layer in the heat transfer direction from the heating surface. This behavior can be reproduced by the developed model. Figure 6 shows the measured values and calculated values of the clearance with respect to the change in
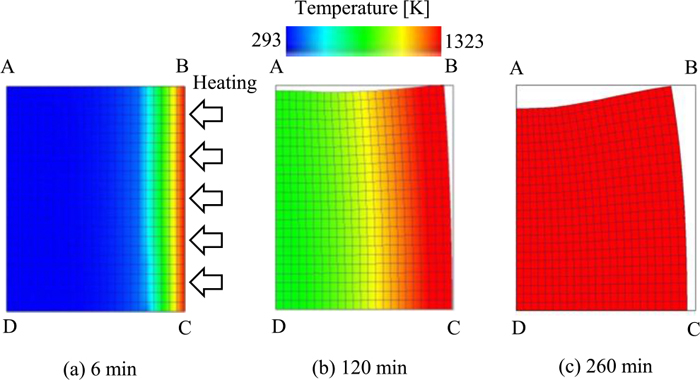
Calculated result of coke deformation. (Online version in color.)

Relationship between reflectance of coal and clearance.
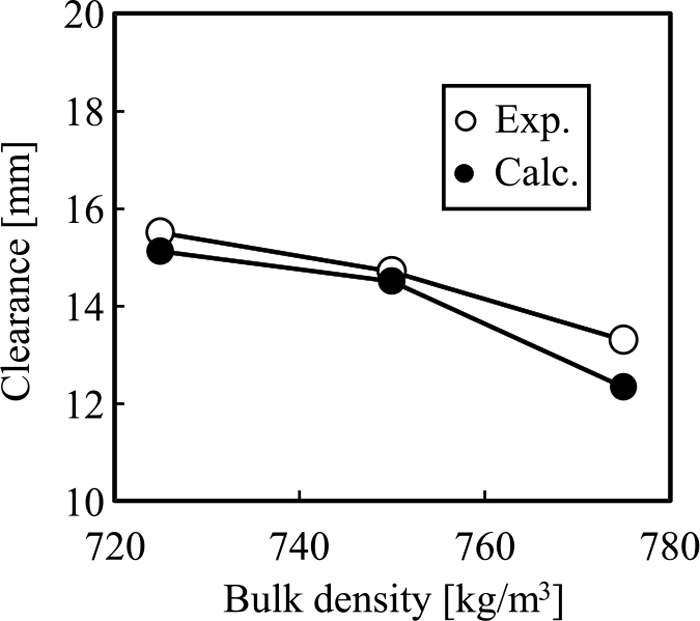
Relationship between bulk density of coal and clearance.
From the above, it was confirmed that the contraction behavior of the coke cake after carbonization can be calculated appropriately by this model.
As described above, the temperature of the combustion chamber has a distribution with respect to the furnace longitudinal direction. In addition, the bulk density of the coal after charging in the coke chamber also has a distribution in the furnace length and furnace height directions in the coke chamber. Therefore, the carbonization phenomenon of coke in the coke chamber shows complicated behavior, and it is insufficient to deal with that behavior 1-dimensionally. Thus, a numerical model capable of comprehensively handling the carbonization in the furnace is required. In the following, a 3-dimensional analysis of the carbonization behavior of the coke cake in the coke chamber was carried out by using the developed clearance estimation model, and the influence of the temperature distribution of the combustion chamber on the clearance distribution of the coke cake after carbonization and the pushing force of the coke cake was investigated.
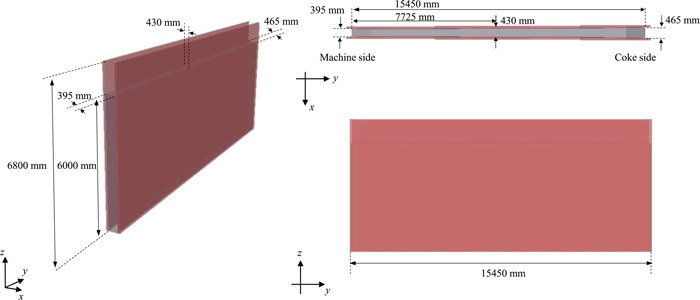
3.1. Analytical Region and Analytical MethodThe analytical domain of this model is shown in Figure 8. In Fig. 8, coordinate axes are set in the furnace width direction (x direction), the furnace longitudinal direction (y direction) and the furnace height direction (z direction), respectively, and the center in the width direction of the coke chamber at the lowermost part of the machine side (MS) is set as the origin. In this model, the coal layer charged in the coke chamber and the 3-dimensional region including the furnace wall brick were analyzed. The inside of the coke chamber has a furnace width of 430 mm × height of 6800 mm × length of 15450 mm, the MS furnace width of 395 mm and the coke side (CS) oven width of 465 mm. From MS to CS, it has a taper of 70 mm. The thickness of the furnace wall brick was assumed to be 100 mm, and the height of coal layer after charging was assumed to be 6000 mm.
Calculation domain of 3-dimensional analysis. (Online version in color.)
In the model relating to the heat transfer analysis in the furnace, the heat transfer from the combustion gas to the furnace wall in the combustion chamber in process (1) above takes into consideration the convection heat transfer of the combustion gas and the furnace wall, and the radiative heat transfer. That is, the heat flux q [W/m2] flowing into the furnace wall from the combustion chamber is expressed by the following equation:
| (7) |
In the heat transfer from the furnace wall to the coal/coke layer in process (3), a virtual calculation element is provided between the furnace wall and the coal/coke layer. Heat transfer occurs when the coal/coke layer and the furnace wall are in contact with each other, and when a clearance is generated between the coke and the furnace wall, radiative heat transfer is taken into consideration. That is, when a clearance does not occur, the same thermophysical property of the coal/coke is given to the virtual calculation element, and heat transfer is calculated as conductive heat transfer. On the other hand, when a clearance is generated, the heat transfer of the coal/coke layer and the furnace wall occurs by radiation, and apparent thermal conductivity λa is defined from the radiative heat flux qcw [W/m2] between parallel plates and then given to the virtual calculation element. The surface temperature of the coal/coke layer is Tc [K], the surface temperature of the furnace wall on the side of the coke chamber is Tw,co [K], the emissivity of the coal/coke layer is εc [-], the generated clearance is ΔL [m] and qcw is expressed as follows:
| (8) |
In addition to the above, 1 kW/m2 was assumed as the amount of heat dissipated to the outside air from the CS and MS of the coke chamber via the furnace door, and was given as the boundary condition of heat removal from the coal/coke layer surface of CS and MS.
3.2. Calculation ConditionsIn the combustion chamber, gas is burned in each flue in the furnace length direction, and heat is supplied into the coke chamber. The operation of the coke oven is controlled by controlling the temperature of each flue, and the flue gas temperature in the direction of the combustion chamber is generally distributed as shown in Fig. 9.

Distribution of ideal flue gas temperature.
Based on this, in this paper, in estimating the clearance of the coke oven, it is assumed that the temperature of the combustion chamber during ordinary operation is distributed as shown in Fig. 9. The flue gas temperature was not changed in the furnace height direction and was fixed. Table 2 shows the calculation conditions. When estimating the clearance by this model, heat transfer calculation, pressure calculation and stress calculation are performed, and the physical property values such as gas permeability coefficient and gas generation amount used for these calculations are influenced by the bulk density of the coal charged in the coke chamber. For this reason, as the distribution of the bulk density of coal in the coke chamber, the distribution shown in Fig. 10, which was measured by Nishioka et al.21) with equipment of actual size, was used. The C/S lowermost part in the coking chamber shown in Fig. 10 was taken as the origin. Next, the coordinates were taken in vertical and horizontal directions in the direction from C/S to M/S and upward from furnace sole. After obtaining the bulk density and coordinates in each contour line in Fig. 10, the vertical and horizontal coordinates are reduced to match the dimensions of the furnace in the calculation. The bulk density distribution in the width direction of the coke chamber is not considered.
| Average bulk density of coal | [kg/m3] | 760 |
| [%] | 1.00 | |
| logMF | [log(ddpm) | 2.5 |
| Moisture content | [mass%] | 7 |
| Coking time | [hr] | 18.5 |

The bulk density measured at the actual scale model oven.21)
Figure 11 shows the cross-sectional temperature distribution of the coke chamber 5, 10 and 18.5 hours after the start of carbonization. The calculation result of the bulk density of the coke cake after carbonization is 450 kg/m3, which was close to the measurement result of the actual coke. Here, the cross-section refers to the yz plane at x = 0 in the calculation domain shown in Fig. 8, that is, the plane at the center in the furnace width direction. From Fig. 11, it can be seen that the coal/coke layer in the coke chamber has a higher temperature rise in the upper part of the layer. This is because the upper part of the coal/coke layer is affected by the radiative heat from the furnace wall, and as shown in Fig. 10, the bulk density of the coal in the upper part decreases after charging. Also, from Fig. 11, the temperatures of the layer at MS and CS are lower than at the central position due to heat removal from the furnace door side, whereas the temperature rise of MS is faster than that of CS. This is because the furnace width (Fig. 8, x direction distance) of the coke chamber is tapered from MS to CS, i.e., CS is wider than MS, which means that heat transfer is delayed at CS. Figure 12 shows the clearance distribution in the furnace longitudinal direction (y direction) and furnace height direction (z direction) 18.5 hours after the start of carbonization. A distribution also occurred in the clearance according to the distribution of the bulk density of the charged coal shown in Fig. 10. The clearance decreased as the bulk density of the coal increased directly under the charging hole of the coke chamber, and increased as the bulk density decreased between the charging holes. Therefore, the clearance showed an uneven distribution along the furnace length direction. The bulk density in Fig. 10 shows its maximum value at the specific height position in the furnace height direction. Therefore, the clearance in the height direction of the coke chamber showed a distribution with a minimum at the position where the bulk density was maximized. As described above, CS and MS have lower temperatures due to heat removal from the furnace door, so the contraction of the coke was insufficient and the clearance decreased.

Distribution of coke temperature in coke oven. (Online version in color.)
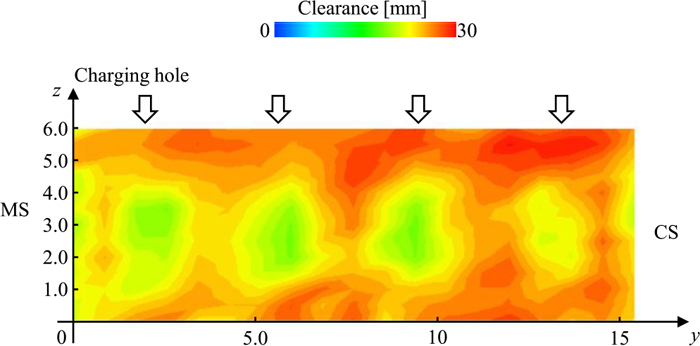
Distribution of clearance for the direction of coke oven length and height. (Online version in color.)
From the results in Fig. 12, it was found that the clearance was minimized at the height position of roughly 2500 mm from the furnace sole. Therefore, in this paper, when evaluating the clearance in the furnace length direction, the clearance calculation result at the same height position will be used hereafter.
From the above, it was confirmed that the distribution of coke temperature and clearance after carbonization can be estimated by the developed model.
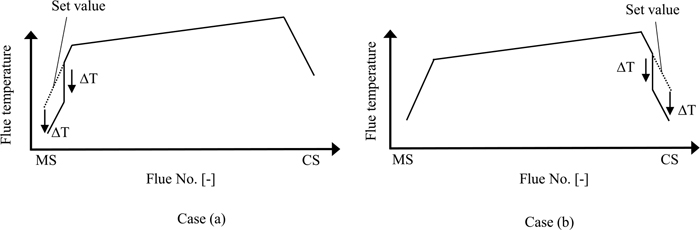
3.4. Influence of Combustion Chamber Temperature on Clearance of Coke CakeUsing the developed model, the influence of the decrease in the combustion chamber temperature on coke carbonization was analyzed. In aged coke ovens, local drops in the flue gas temperature occur frequently due to combustion failure. Therefore, in this paper, the case where the combustion chamber temperature in the furnace longitudinal direction is locally lower than the target temperature distribution was investigated. The temperature of the combustion chamber was assumed to be as shown in Fig. 13. A local drop in temperature in the furnace longitudinal direction with respect to the set temperature was assumed in the area of two of the flues in the combustion chamber of MS (Fig. 13 Case (a)) or CS (Case (b)). In each of these patterns, the temperature drop ΔT from the target temperature distribution was defined, and the influence of each temperature distribution on the coke temperature and clearance was estimated. ΔT was set to 100°C or 200°C. The target flue gas temperature distribution was the pattern shown in Fig. 9.
Distribution of flue gas temperature.
Figure 14 shows the distribution of the coke cake temperature and clearance in the furnace longitudinal direction at the position of 2500 mm in height from the sole of the furnace when the flue gas temperature of MS (Case (a)) or CS (Case (b)) decreased locally. As shown in Case (a), when the flue gas temperature of MS decreased, the coke temperature decreased throughout the entire furnace longitudinal direction including CS. This is because the target value of the flue gas temperature becomes lower from CS to MS and the influence of the temperature drop becomes greater as the temperature of MS becomes lower. In addition, even when the flue gas temperature decreases locally, the heat of the high temperature position of the brick flows to the low temperature position due to the conductive heat transfer in the furnace wall brick, which also affects the temperature of the whole furnace wall brick. Therefore, even if the temperature of the flue decreases locally, it is expected to affect the carbonization of the whole coke layer. For this reason, it is necessary to compensate for the amount of heat by improving the temperature drop of the low temperature flue or by increasing the temperatures of other flues. Similarly, in Case (b), when the flue gas temperature of CS decreased, the coke temperature in the entire furnace longitudinal direction including CS decreased. However, the coke temperature of CS, which is the flue gas temperature decrease position, decreased remarkably as compared with the case where the flue gas temperature of MS decreased, and as a result, the clearance of CS decreased greatly. Since the width of the coke chamber is wider from MS to CS, the temperature of the coal/coke layer is susceptible to the influence of the flue gas temperature, and it is difficult to raise the temperature. Case (b) is a state in which the flue gas temperature decreases in the coke chamber of CS, which is most susceptible to the influence of the flue gas temperature in the furnace longitudinal direction. Therefore, the coal/coke layer temperature of CS also drops greatly. On the other hand, from CS to MS, the coal/coke layer is gradually less affected by the flue gas temperature, and it is easy to raise the temperature. Therefore, the temperature drop of the coal/coke layer as a whole in the furnace longitudinal direction in Case (a) hardly occurs. Figure 15 shows the clearances of MS and CS when the flue gas temperatures at MS and CS decreased. The clearance between MS and CS refers to the value at the position of the edge of the coke chamber. From Fig. 15, the clearance decreases for both MS and CS when the temperature drop ΔT is 100°C, and the difference between the decreases in the clearances of MS and CS is small. On the other hand, when the temperature drop ΔT is 200°C, the difference between the decreases in the clearances of CS and MS expands. This is because the width of the coke chamber of CS is enlarged as compared with MS, as described above, so that heat transfer in the width direction is delayed, and insufficient contraction of the coke is likely to occur due to a temperature decrease of the flue. Therefore, a temperature decrease at CS is expected to have a particularly large effect on the pushing resistance of coke cake after carbonization.

Distribution of coke temperature and clearance for the direction of coke oven length at each flue gas temperature pattern.

Relationship between MS or CS clearance and temperature drop of MS or CS of coke oven.
The required pushing force of the coke cake after carbonization was estimated by using the results of the clearance calculations by the model. To estimate the pushing force, Gibson et al.22) proposed following equation:
| (9) |
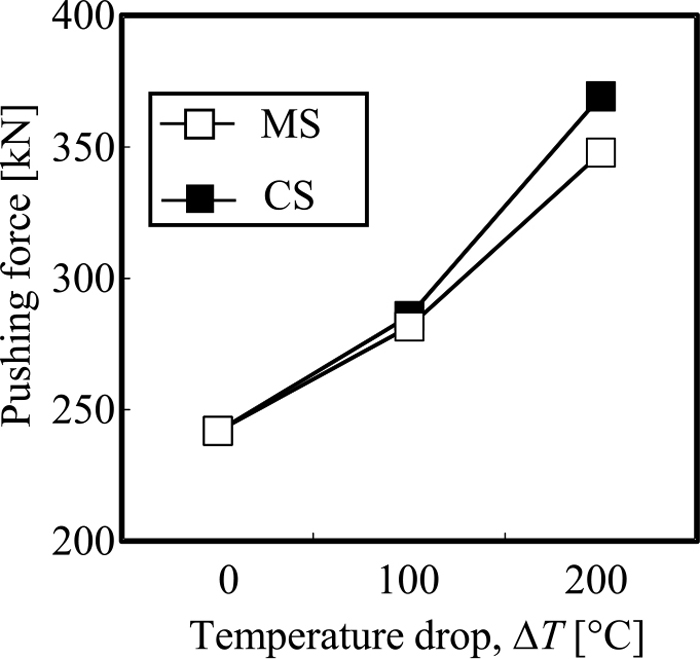
Relationship between coke pushing force and temperature drop of MS or CS of coke oven.
In order to establish stable operation in aging coke ovens, a numerical model was developed to estimate the clearance of the coke cake after carbonization in a coke oven, and the influence of the decrease in furnace temperature on the contraction of the coke cake was examined by numerical simulation. The findings obtained are summarized below.
(1) An estimation model of clearance considering the expansion of coal during carbonization and contraction of the semicoke was developed. The measured value of the clearance of the coke cake was compared with the result of the calculation by the model. The calculation result agreed well with the measurement result, confirming the validity of the model.
(2) Using the developed model, the influence of the flue gas temperature distribution on the contraction of the coke cake was evaluated for an aging furnace. As a result of a calculation of clearance assuming a local reduction of the flue gas temperature of CS or MS, it was shown that the temperature decrease of CS has a greater influence on the decrease of clearance compared with MS.
(3) An estimation of the required pushing force of the coke cake after carbonization by using the clearance obtained by the model confirmed that the reduction of clearance due to a temperature decrease of CS has a greater influence on the pushing force than a temperature decrease of MS.
Therefore, it is considered that management of the CS flue gas temperature is particularly important for decreasing the pushing resistance of the coke cake.