Fundamentals of High Temperature Processes
Flow Characteristics Related to Liquid/liquid Mixing Pattern in an Impeller-stirred Vessel
2018 Volume 58 Issue 4 Pages 620-626
Details
2018 Volume 58 Issue 4 Pages 620-626
Impeller stirring is an important industrial technique which is used in hot metal pretreatment processes in steelmaking. The liquid/liquid flow characteristics of impeller stirring were clarified by a two-dimensional PIV experiment and CFD analysis and a liquid/liquid system consisting of liquid paraffin (oil) and ion-exchanged water (water). The target mixing patterns were Types I, II and III. Here, Type I is defined as the region where the two liquid phases exist separately, Type II is the region where dispersed oil exists in a scattered form in a continuous water phase, and Type III is the region where dispersed air and oil existed in the continuous liquid phase of water. The calculated oil/water and air/water interfaces were in good agreement with the experimental results. The vertical upward flow near the wall resulted in one or two circulation flows, one near the oil/water interface and the other below it, whereas the downward flow formed a single circulation flow near the bottom. The cross-sectional mean water velocity and turbulence energy displayed their peak values at the blade side regardless of the mixing patterns. In addition to the large value at the blade side, turbulence energy displayed a large value near the air/water interface in the type III mixing pattern. In Types I and II, the cross-sectional mean water velocity and turbulence energy near the oil/water interface increased at higher rotation speeds. The turbulence energy at the gap between the water and the side of the paddle blade proceeded toward the vessel wall.
Impeller stirring to promote the slag/metal reaction is one of the most important methods for removing impurities in molten iron1,2) or silicon.3,4,5) When attempting to establish a procedure to accelerate the slag/metal reaction rate, use of a cold model experiment as well as a hot model is a useful approach which makes it possible to set a wide range of experimental conditions and understand the influence of operational factors more easily. Cold model experiments have been used by many researches. For example, cold model experiments have demonstrated that low density particles can be dispersed efficiently in a liquid by setting an impeller at an offset position6,7,8) instead of at the center, immersing a cylinder8,9) or inclining the vessel bottom10) during impeller stirring. Kuroyanagi et al.11) and Ito et al.12) investigated the effect of baffles on bath agitation, and Nakai et al.13) examined the relationship between the characteristics of the liquid vortex and dispersion of solid particles, and the effects of operational factors on the solid/liquid mixing pattern.
Cold model experiments have also been used to examine impeller stirring between different phases such as two liquids (liquid/liquid)14,15) and a solid and a liquid (solid/liquid),16,17) and clarified the transition conditions of the mixing pattern of the different phases14,16) and its effect on the mass transfer rate.15,17) For example, when the rotation speed of an impeller was increased while maintaining a constant impeller height, a vortex was formed, and the lower density liquid or solid was involved in the continuous liquid phase. Horiuchi et al.14) indicated that there were three types of liquid/liquid mixing patterns as shown in Fig. 1. Type I on the left side in Fig. 1 is the region where the two liquid phases exist separately without dispersion, Type II in the center is the region where the liquid/liquid interface reaches the top of the impeller and the dispersed liquid is scattered in the continuous phase, and Type III on the right is the region where the interface between the gas and liquid paraffin or ion-exchanged water as well as the liquid/liquid interface reaches the impeller position and strong dispersion occurs. The mixing pattern transitioned from Type I to II and from Type II to III with increased impeller rotation speed and decreased impeller depth. Moreover, the transition between Types I and II was accelerated by an increase in the volumetric ratio of the dispersed liquid to the continuous one. The liquid/liquid mass transfer rate was significantly affected by the mixing pattern,15) remaining nearly constant at a low level in Type I, increasing monotonously in Type II except near Type III, and displaying a decreased rate of increase in Type II near Type III and in type III. This behavior was also confirmed in a solid (dispersion phase)/liquid (continuous phase) system.16,17)

Schematic diagram of three types of liquid/liquid mixing patterns ((a): Liquid paraffin, (b): Water, (c): Air).
From this perspective, it is important to examine the relationship between local flow characteristics such as the distributions of velocity and turbulence energy and the mixing pattern, as turbulence energy is related to fluid mixing and the mass transfer rate and the fluid velocity affects the transport of turbulence energy. Sato et al.18,19) measured the velocity profiles of a single liquid phase by the PIV (Particle Image Velocimetry) method, but did not indicate the effect of operational factors such as the rotation speed and depth of the impeller on the structure of the liquid flow. Previous studies have investigated the behavior of a solid/liquid20,21,22) system and a liquid/liquid23) system in an impeller-stirred vessel by computational analysis assuming a variable impeller rotation speed, but it was not clear how the solid particles or dispersed liquid affected the liquid flow characteristics. Therefore in this study, a cold model experiment by two-dimensional PIV and a computational fluid analysis with commercial software were done in order to understand the effect of the volumetric ratio of the dispersed liquid on the continuous liquid, in addition to the effects of the rotation speed and depth of the impeller on the liquid/liquid flow characteristics in impeller stirring.
A schematic diagram of an impeller-stirred cylindrical vessel is shown in Fig. 2. Liquid paraffin (density, ρoil: 8.3×10² kg/m3, viscosity, μoil: 9.0×10⁻³ Pa·s) and ion-exchanged water (density, ρw: 1.0×10³ kg/m3, viscosity, μw: 1.0×10⁻³ Pa·s) were introduced into the acrylic vessel. Both the vessel inner diameter, D (m), and the bath depth, Hb (m), were 0.3. An impeller with four paddle blades as shown schematically in Fig. 3 was set at the central axis of the vessel. The impeller diameter, d (m), was 0.116. The rotation speed, R (s−1), of the impeller and the volumetric ratio, Voil/Vw (–), of the liquid paraffin to the ion-exchanged water were varied in the range from 0.83 to 5.00 and from 0 to 0.24, respectively. The impeller depth, H (m), was set to 0.13 or 0.18. As the Reynolds number, Re (–), defined as Eq. (1) was calculated to be 1.11×10⁴ – 4.48×10⁴, the water stirred by the four paddle blade impeller was in a turbulent state.
| (1) |

Schematic diagram of impeller-stirred vessel used for the experiment.

Schematic diagram of impeller with four paddle blades used for the experiment.
A schematic diagram of a two-dimensional PIV system is shown in Fig. 4. Although not shown in Fig. 2, the cylindrical vessel with impeller stirring was placed inside a large cuboidal vessel filled with tap water to prevent reflection of the laser beam and optical strain due to the cylindrical configuration. A neodymium laser (green) with a wavelength of 532 nm was used in the PIV measurement system (Flowtech Research, Inc.). Polystyrene particles (Sekisui Plastics Co. Ltd.) with a diameter of 3.0×10⁻⁵ m and density of 1.06×10³ kg/m3 in density were placed in the ion-exchanged water and a black and white CCD (Charge-Coupled Device) camera was used to record the simultaneous motion of the particles.

Schematic diagram of PIV system used for the experiment.
The radial and axial velocities in the ion-exchanged water at time, ti (s), are defined as ur(ti) (m/s) by Eq. (2) and uz(ti) (m/s) by Eq. (3), respectively. The mean velocity magnitude, <u(r,z)> (m/s), at a certain position (radius, axis = (r,z)) was calculated by Eq. (4) as follows:
| (2) |
| (3) |
| (4) |
| (5) |
The velocity and turbulence energy index profiles in the ion-exchanged water were obtained by analyzing 600 frames of particles motion statistically. The sampling period was 0.01 s at R≦1.33 s−1 and 0.005 s at R≧1.67 s−1.
The three-dimensional unsteady incompressible mixed fluid flow in the impeller-stirred vessel was analyzed numerically by the VOF (Volume of Fluid) method. The equations of continuity and motion which control the fluid flow are expressed by Eqs. (6) and (7), respectively.
| (6) |
| (7) |
| (8) |
| (9) |
| (10) |
ANSYS Fluent 17.0 (ANSYS, Inc.) was used for the calculation. The standard k–ω24) model for the turbulent viscosity and CSF (Continuum Surface Force) model for replacing surface tension with volume force were selected in the implicit and transient method. The calculation conditions are shown in Table 1. The geometric configuration was the same as that in the experimental apparatus. The rotation speed, R, was varied from 0.83 to 5.00 s−1, while the impeller depth, H, and the volumetric ratio, Voil/Vw, were kept to constant at 0.13 m and 0.12 (–), respectively. The MRF (Multiple Reference Frame) model was used for the impeller rotation. A circular cylinder with a diameter of 0.16 m and height of 0.077 m including the impeller paddle blades was set as the rotation region where the rotation speed was given and Coriolis and centrifugal forces were assumed to act on the fluid. The total mesh number was 408656. The residual plot became stable after 45–60 s.
| Vessel inner diameter, D (m) | 0.30 |
| Bath depth, Hb (m) | 0.30 |
| Impeller diameter, d (m) | 0.116 |
| Impeller thickness, b (m) | 0.067 |
| Impeller width, w (m) | 0.031 |
| Rotation speed, R (s−1) | 0.83, 1.67, 2.25, 3.33, 5.00 |
| Impeller depth, H (m) | 0.13 |
| Liquid/liquid ratio, Voil/Vw (–) | 0.12 |
| Dispersion phase | Liquid paraffin |
| Continuous phase | Ion-exchanged water |
| Total mesh number | 408656 |
Figure 5 shows a comparison of the oil/water and air/water interfaces in the experiment and calculations with each mixing pattern. The liquid paraffin (oil) used in the experiment was colored with an oil-based ink, and the air/water interface was measured with a hanging ruler in the upper vessel. The calculated oil/water and air/water interfaces were in good agreement with the experimental results for the different rotation speeds and mixing patterns. As indicated in Types I and II mixing patterns, the bottom of the oil/water interface approached the upper part of the impeller blade when the impeller rotation speed was increased. At the transition from Type I to Type II, the oil arrived at the impeller blade and moved horizontally and outward due to centrifugal force. After that, the oil droplets dispersed into water. However, they did not form at the cone-shaped interface. According to Asai’s study of a slag droplet entrainment into a continuous water phase,25) the critical velocity at the oil-water interface became 24×10−2 m/s. The tangential velocity of the impeller circumference was calculated to be 82×10−2 m/s at the transition between Type I and Type II, which resulted in the oil droplet formation. In the calculations, a dispersed liquid paraffin layer was recognized in the continuous water phase at R=5.00 s−1 in the Type III mixing pattern.

Comparison of interface of different phases between the experiment and calculation.
A schematic diagram of the PIV measurement area is shown in Fig. 6. Because the laser beam caused halation on the upper part of the cylinder and the impeller shaft, the spontaneous cross-sectional mean water velocities were measured in the region which was relatively unaffected by halation.

Schematic diagram of PIV measurement area.
The profile of the cross-sectional mean water velocity at Voil/Vw of 0.12 and H of 0.18 m is shown in Fig. 7 for various rotation speeds. The liquid/liquid (oil/water) mixing pattern for R of 0.83 and 1.67 s−1 was Type I, and that of 2.25 s−1 was the transition state from Type I to Type II. An arrow and its color denote the direction of the mean velocity and <u(r,z)>, respectively. A closed red circle means a circulation flow zone where the velocity vectors forms a closed loop. A higher rotation speed increased the liquid paraffin vortex depth which approached the upper part of the impeller blades. As shown by the changes in color, the cross-sectional mean water velocity had a peak value on the blade side and increased with increasing rotation speed. There were two or three circulation flow zones. The mean water velocity in the circulation flow zones became smaller than that in the other parts of the bath, as indicated by the color blue. As can be seen from the directions of the arrows, the outward and horizontal flows generated by impeller rotation split upward and downward at the vessel wall. The vertical upward flow resulted in circulation flows near the liquid paraffin/water interface and below the interface, although the circulation flow was difficult to be recognized at R=0.83 s−1. On the other hand, the downward flow along the wall impinged on the bottom and caused a swirling flow near the bottom.

Profile of cross-sectional mean water velocity at Voil/Vw of 0.12 and H of 0.18 m.
Figure 8 shows the effect of the volumetric ratio of liquid paraffin to water on the cross-sectional mean velocity profile at R = 1.67 s−1 and H = 0.18 m. The liquid/liquid mixing pattern was Type I. The liquid paraffin vortex depth increased with increased Voil/Vw and approached the impeller blades as reported by Horiuchi et al.14) A slight difference of the flow patterns with Voil/Vw=0, 0.12 and 0.24 was recognized in Fig. 8. The cross-sectional mean water velocity always had a peak value on the blade side, and two or three circulation flow zones were observed, two being observed at Voil/Vw = 0 and three at Voil/Vw = 0.12 and 0.24.

Profile of cross-sectional mean water velocity at R of 1.67 s−1 and H of 0.18 m.
The effect of the impeller depth on the cross-sectional mean velocity profile at R = 1.67 s−1 and Voil/Vw = 0.12 (–) is shown in Fig. 9. Both figures indicate the Type I mixing pattern. When the impeller blade position was changed from H=0.18 to 0.13 m, the clearly-defined circulation flow zone near the liquid paraffin/water interface became indistinct.

Profile of cross-sectional mean water velocity at R of 1.67 s−1 and Voil/Vw of 0.12.
Next, in order to examine the effect of the mixing pattern on the flow characteristics in the PIV experiment, particular attention was paid to the average values of 12 points near the liquid/liquid interface denoted in Fig. 10. Since the position of the liquid paraffin/water interface changes depending on Voil/Vw, the results at the same Voil/Vw value will be discussed later.
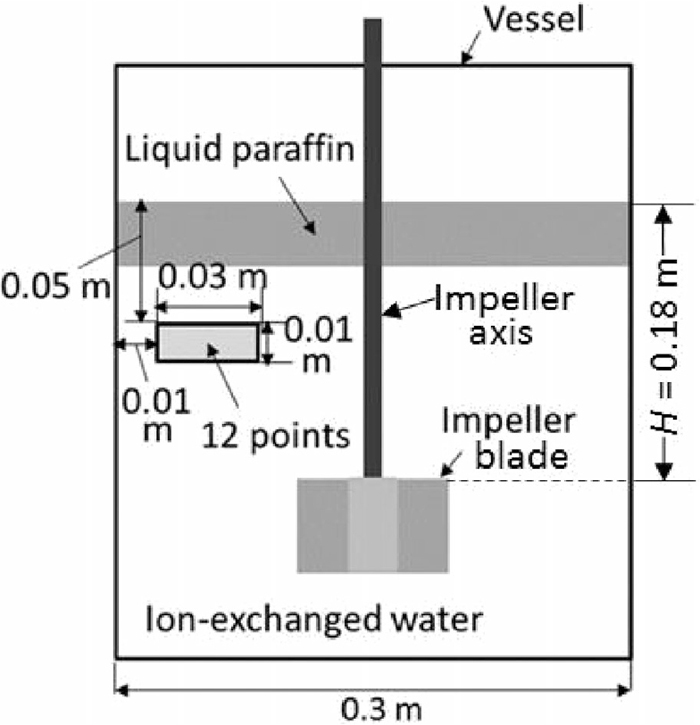
Geometric position for local flow characteristics.
Figure 11 shows the relationship between the local vertical cross-sectional water velocity, uave (m/s), the average of 12 points of <u(r,z)> in Fig. 10 and R normalized by the rotation speed, RI-II (s−1), of the Type I-Type II transition point. In addition to R,14) the RI-II values depending on Voil/Vw were measured, as shown in Table 2. The closed and open marks in Fig. 11 indicate uave with the Type I and Type II mixing patterns, respectively. In Type I, uave increased with increasing R. The uave values of the Type II mixing pattern showed higher values compared with the extrapolation lines of Type I. It is reasonable to think that dispersion of liquid paraffin in water reduces the interfacial resistance between continuous liquid paraffin and water and thereby enlarges the water motion of the measured region near the liquid/liquid interface in Fig. 10.
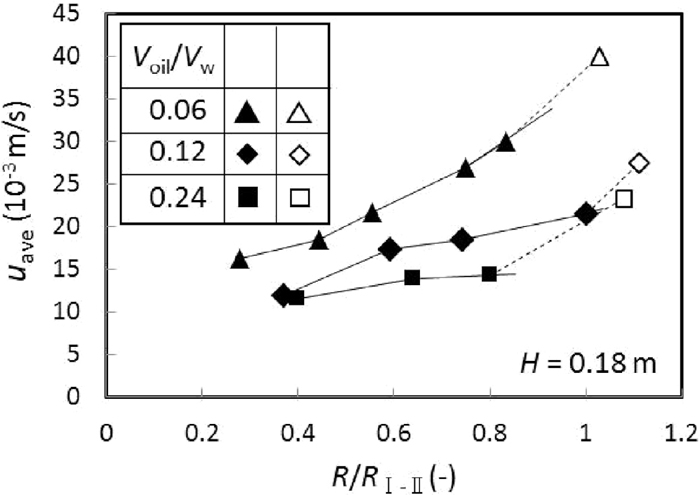
Relationship between local cross-sectional mean water velocity and R/RI-II.
| Voil/Vw (–) | |||
| 0.06 | 0.12 | 0.24 | |
| RI-II (s−1) | 3.00 | 2.25 | 2.08 |
To obtain the flow characteristics of a horizontal plane, a CFD calculation was used instead of the two-dimensional PIV experiment system. The calculated results of the horizontal sectional velocity distribution at each vertical position are shown in Fig. 12. The impeller was rotated in the counterclockwise direction. The mixing pattern was Type I, and R, Voil/Vw and H were 1.67 s−1, 0.12 (–) and 0.13 m, respectively. Here, z means the depth (m) from the free surface (liquid paraffin/air interface). At the horizontal plane at z=0.167 m including the impeller cross-section, tangential and radial directional velocities existed and the water flowed toward the wall. On the other hand, above or below the impeller cross-section as shown by z=0.050, 0.100 and 0.250 m, the radial velocity was negligibly smaller than the tangential velocity and the flow appeared to circulate. At the liquid paraffin/water interface at z=0.050 and 0.100 m, the velocity changed in a discontinuous manner, that is, the liquid paraffin velocity decreased drastically. This is attributed to the fact that the viscosity of liquid paraffin (μoil: 9.0×10⁻³ Pa·s) is greater than that of water (μoil: 1.0×10⁻³ Pa·s), as mentioned in Chapter 2.

Calculated horizontal sectional mean water velocity distribution at each vertical position (R=1.67 s−1, Voil/Vw=0.12, H=0.13 m).
Figure 13 shows the relationship between the local vertical cross-sectional turbulence energy index, k’ave, averaged by the 12 points of k’ in Fig. 10 and R/RI-II. The closed and open marks indicate k’ave with the Type I and Type II mixing patterns, respectively. As in the case of the local cross-sectional velocity in Fig. 11, the k’ave values increased concavely downward with increasing rotation speed, and the extrapolation lines of Type I attained to the k’ave values of Type II.

Relationship between local vertical cross-sectional turbulence energy index and R/RI-II.
The calculated vertical cross-sectional distribution of turbulence energy, k, with the Types I, II and III mixing patterns is shown in Fig. 14. Voil/Vw and H were 0.12 (–) and 0.13 m, respectively. The two-dimensional k’ defined as shown in Eq. (5) at R=1.67 s−1 (Type I) was also compared with the calculated result for the same condition. Although a quantitative comparison between three-dimensional and two-dimensional turbulence energy is difficult, the calculated and experimental results for the Type I mixing pattern displayed the same tendency, that is, the maximum turbulence energy region exists at the border of the blade side. This also corresponds to the maximum velocity region in Figs. 7, 8, 9. The region of larger k values was expanded by increasing the rotation speed, especially near the gas/liquid interface in the Type III mixing pattern.

Comparison of calculated vertical cross-sectional turbulence energy distribution among Types I, II and III of mixing patterns (Voil/Vw=0.12, H=0.13 m).
To investigate the production of turbulence energy, the vertical turbulence energy distribution was calculated. Figure 15 shows the rotation phases used for the calculation of the vertical cross-sectional turbulence energy distribution. The vertical plane of the 0° phase involves the center of the impeller blade, and x (=0°, 30°, 45°, 60°) shows the A–A’ plane in Fig. 15 after the impeller rotates by x degrees.

Rotation phases used for the calculation of turbulence energy distribution.
Figure 16 shows the change in the calculated vertical cross-sectional turbulence energy distribution at each rotation phase in Fig. 15. As under the conditions in Fig. 12, the mixing pattern was Type I, and R, Voil/Vw and H were 1.67 s−1, 0.12 and 0.13 m, respectively. Turbulence energy is produced at the gap between the liquid and the side of the paddle blade in the 0° phase due to shear stress and proceeds horizontally toward the vessel wall as seen from the other phases.

Change in calculated vertical cross-sectional turbulence energy distribution at each rotation phase (R=1.67 s−1, Voil/Vw=0.12, H=0.13 m).
Turbulence energy contributes to fluid mixing and accelerates the mass transfer rate. Therefore, in addition to simply increasing the rotation speed, it is important to enhance the production of turbulence energy by additional design of the blade side, for example, by increasing the roughness of the blade. Study of blade design features is planned as the next step in this research. Moreover, as can be seen in Fig. 14, the turbulence energy of the Type III mixing pattern had a large value near the air/water interface, indicating that the mixing pattern is also an important factor in enhancing the liquid/liquid mass transfer rate. As future work, this knowledge will be applied to solid/liquid systems.
The liquid/liquid flow characteristics of impeller stirring were made clear by a two-dimensional PIV experiment and CFD analysis. The following results were obtained.
(1) The vertical upward flow near the wall resulted in one or two circulation flow zones, one near the oil/water interface and the other is below it, whereas the downward flow formed one circulation flow zone near the bottom.
(2) The cross-sectional mean water velocity and turbulence energy displayed their peak value at the blade side regardless of the mixing patterns.
(3) In addition to the large value at the blade side, turbulence energy displayed a large value near the air/water interface in the Type III mixing pattern.
(4) In Types I and II, the cross-sectional mean water velocity and turbulence energy near the oil/water interface increased at higher rotation speeds.
(5) The turbulence energy at the gap between the water and the side wall of the paddle blade proceeded toward the vessel wall.
This work was supported by JFE 21st Century Foundation and the CFD analysis of this work was partly supported by Mr. Tomomi Nakanishi (JFE Techno-Research Corporation).