Abstract
In this study, the effect of the state of N atoms in a Fe–N alloy, namely, whether N exists as a dissolved atom or as a nitride on void nucleation, growth, and coalescence during tensile testing was examined and the factors dominating local elongation was discussed. Two types of Fe–0.02 mass% N alloy specimens were used; one was heated to the ferritic phase region before water-quenching, while the other was subjected to aging.
The local elongation of the water-quenched specimen was lower than that of the aged specimen. Secondary-ion mass spectrometry and electron backscattering diffraction analyses revealed that N atoms were segregated around grain boundaries similarly in both the water-quenched and the aged specimens, while N atoms precipitated as Fe4N in the aged specimen. Void nucleation, growth, and coalescence were observed using synchrotron radiation X-ray laminography. In the water-quenched specimen, voids suddenly grew and coalesced before fracture, while in the aged specimen sudden growth and coalescence were suppressed. Nano-indentation hardness measurements showed that the difference in hardness between the regions around the grain boundaries and grain centers was smaller in the aged specimen compared to that in the water-quenched specimen. This result indicated a lower plastic strain gradient around the grain boundaries in the aged specimen. This lower plastic strain gradient in the aged specimen was caused by precipitation of N atoms as Fe4N. From these results, it was concluded that the main factor permitting the greater local elongation of the aged specimen was the lower plastic strain gradient around the grain boundaries.
1. Introduction
High-strength steel is required in many industries. However, elongation decreases as strength increases. Therefore, many types of high-strength steels have been developed in order to improve the balance of these mutually contradictory properties. These representative steel types are dual-phase (DP) steels, comprising mixtures of ferritic and martensitic1) or bainitic phases,2) and transformation-induced plasticity (TRIP)3) -assisted steels,4) in which the austenitic–martensitic phase transformation is triggered by deformation. Some studies5,6) have investigated the effects of the microstructures of DP and TRIP steels on the strength and elongation properties of these materials. However, alloying elements such as Mn, Si, Mo, and Ti are often added to these steels for microstructural control; such materials deplete global alloying element resources. To solve this problem, the use of globally abundant N is under investigation for strengthening steels.
N-added steels are strengthened by dissolved N atoms and/or nitride precipitates. The mechanisms of strengthening by solute atoms and precipitates of N have been quantitatively clarified for steels. However, the effect of N on the elongation has not been researched adequately. The elongation is generally evaluated by tensile testing, and the relationship between the elongation and the metallographic structure is discussed based on uniform elongation and local elongation, which are defined as the elongation before reaching the maximum load and the elongation from the point of maximum load until fracture, respectively.7,8) For Fe–N alloys, the decrease in the uniform elongation with increasing N-strengthening can be estimated using dislocation theory. However, in the local elongation region, void nucleation and growth accompanies increasing stress triaxiality.9) These voids eventually coalesce and cause fracture which implies that the local elongation depends on the process of void nucleation, growth, and coalescence; here, “void growth” indicates an increase in the volume of an individual void and does not include the coalescence of multiple voids. The state of N atoms in Fe, i.e., whether N is in the solid-solution state or exists in precipitates, and their distribution at grain boundaries or in grain interiors, critically influences the process of void nucleation, growth, and coalescence. In order to use N atoms as a strengthening element, it is important to clarify the effects of the state of N atoms on this process and the local elongation.
However, a method for measuring the grain-boundary segregation of N atoms has not yet been established. Valle et al. measured the amount of C in the microscale regions of a Fe–Al–Mn–C alloy using a newly developed secondary-ion mass spectrometry (SIMS) method, which can measure the distribution of atoms in microscale regions.10) Similarly, Christien et al. measured the amount of S segregated at the grain boundaries of Ni using the same technique.11) Therefore, this technique may enable measuring grain-boundary segregation of N atoms in Fe. In this research, SIMS was used to analyze the grain-boundary segregation of N atoms in two types of Fe–0.02 mass% N alloy; one was heat treated at a high temperature to form the ferritic phase, followed by quenching in water, and the other was aged. Nitrides in the aged specimen were determined by electron backscattering diffraction (EBSD).
Cyclic loading–unloading tensile testing was then performed under sequential changes in strain until near final fracture. Void nucleation and growth were investigated for these specimens by synchrotron radiation X-ray laminography,12) capturing three-dimensional (3D) images of voids in plate-type tensile test specimens. The void nucleation sites in the fractured specimens were also observed by EBSD. In addition, the factors controlling the local elongation were discussed based on differences in the hardness of the grain boundaries and interiors, as measured by nano-indentation hardness testing.
Based on these results, we clarified the effect of the state of N atoms, as analyzed by SIMS, on the void nucleation, growth and coalescence process observed by synchrotron radiation X-ray laminography. In addition, we discussed the dominant factors governing the local elongation from the perspective of the plastic strain gradient near the grain boundaries, as implicated by the nano-indentation hardness results.
2. Experimental Methods
2.1. Test Specimens
The test material used in this study was a Fe–0.02 mass% N alloy. Specimens were prepared via small-scale vacuum melting under flowing N2 gas blowing, and then casting, hot rolling, cold rolling, and heating in the ferritic phase region (1173 K × 10 s). One set of specimens was water-quenched (hereinafter, WQ); another was subjected to additional aging (hereinafter, AG) at 473 K for 100 ks under vacuum in order to change the state of N atoms in the alloy from being dissolved into being bonded as a nitride. The test specimen preparation process is shown in Fig. 1, and the chemical composition of the WQ specimen in Table 1, which was determined by the infrared absorption method after combustion (C, and S), the gas fusion thermal conductivity method (N), or the spark discharge atomic emission spectroscopy method (Si, Mn, P, and Al). The strengths and the elongations of both AG and WQ specimens as measured during the tensile tests are shown in Table 2. The tensile test specimens were 12.5 mm in width, 30 mm in length in the parallel part, and 2 mm in thickness, with a gage length of 25 mm, as shown in Fig. 2(a). To accurately determine the difference between the elongations of the WQ and the AG specimens, the gage length of the tensile test specimens is longer than that of specimens used for void observation by synchrotron radiation X-ray laminography (Fig. 2(b)). The lower yield points (LYPs) are equivalent in the WQ and AG specimens, and the tensile strength (TS) of the WQ specimen is 92 MPa higher than that of the AG specimen. Meanwhile, although the uniform elongations of the two specimens are not considerably different, the local elongation of the AG specimen is 15% higher than that of the WQ specimen.

Table 1. Chemical composition of Fe–N alloy used (mass%).
| C | Si | Mn | P | S | Al | N |
|---|
| 0.001 | 0.01 | 0.002 | 0.002 | 0.001 | 0.012 | 0.020 |
Table 2. Strength and elongation for water-quenched (WQ) and aged (AG) specimens.
| Specimen | Lower Yield Point (MPa) | Tensile Strength (MPa) | Uniform Elongation (%) | Local Elongation (%) |
|---|
| WQ | 226 | 370 | 23 | 19 |
| AG | 200 | 278 | 26 | 34 |

The microstructures of the test specimens were observed by using an optical microscope for the planes perpendicular to the rolling direction (RD). The test specimens were embedded in resin and polished with emery papers, followed by mirror polishing with alumina buffing. The specimens were then etched with a 10% nitric acid–90% ethanol solution. Furthermore, that specimen was sputtered by Ar for 120 s at an accelerating voltage of 2 kV with a flat milling device (IM-3000, Hitachi High-Technologies, Japan), and precipitates were observed using a field-emission scanning electron microscope (FE-SEM) (SU6600, Hitachi High-Technologies, Japan) at the accelerating voltage of 15 kV. These precipitates were identified by EBSD attached in FE-SEM using Orientation Imaging Microscopy analysis software (OIM™; AMETEK CO., LTD, Mahwah, USA).
2.2. Measurement of N near Grain Boundaries
Test specimens of 10 mm in diameter and 1 mm in thickness were taken from the WQ and AG specimens for SIMS (Nano SIMS 50L, CAMECA, USA) analysis using the plane perpendicular to the normal direction (ND). The surface was polished with emery papers, followed by sequential polishing with α-alumina and colloidal silica solutions to allow elemental mapping. Using a 16 keV Cs+ primary ion beam, Fe–, C–, and CN– were detected with an incident beam current of 1.0–1.5 pA, and a dwell time of 50.00 ms/pixel at 50 × 50 μm2 and 256 × 256 pixels. CN– was selected as the detection species to analyze the N content because of the low secondary ionization efficiency of N–.
2.3. Void Observation by Synchrotron Radiation X-ray Laminography
Plate-type tensile test specimens with the geometry shown in Fig. 2(b), measuring 1.2 mm in thickness, 2.0 mm in width in the parallel part, and 3.0 mm in gage length, were prepared such that the tensile direction was parallel to RD. After the surfaces of the specimens were finished with 1200-grit emery paper, cyclical tensile loading–unloading was performed in six stages. Specifically, the samples were stopped to six different strain values ranging from near the maximum load to near fracture with a hydraulically controlled universal testing machine (Servopulser 4830, Shimadzu Corporation, Japan). The tensile tests were performed at the initial strain rate of 1.0 × 10⁻³ s−1. The tensile tests of the WQ specimen were stopped at the plastic strain εx values of 0.07, 0.14, 0.57, 0.99, 1.08, and 1.42 (near final fracture). Similarly, the tests of the AG specimen were stopped at εx values of 0.05, 0.23, 0.59, 1.04, 1.14, and 1.45 (near final fracture). εx was defined by the following Eq. (1):
where
A0 is the initial cross-sectional area of the test specimen, and
A is the area of the cross-section when the tensile test was stopped, which was calculated from the thickness and the width of the tested specimen.
With the test specimens from each of the above-mentioned stages of strain, 3D image data of the voids was acquired by X-ray laminography at the BL20XU beamline13) of SPring-8, a large-scale synchrotron radiation facility. A visible-light-conversion-type high-resolution X-ray image unit (BM-AA50 and ORCA FLASH 4.0 sCMOS camera, Hamamatsu Photonics, Japan) was used as a detector. The X-ray energy of 37.7 keV was chosen. The voxel size was 0.51 μm and the specimen rotational axis inclination for laminograph measurement was 45°. Considering the chemical composition and the thickness of the test specimen, adequate transmission intensity was obtained under these conditions. The number of projections for laminography scan was 3600/360°, and each projection image was acquired with an exposure time of 600 ms. These conditions were set to match those used by Toda et al. for analyzing voids in duplex stainless steels.14)
After median-filter (2 × 2 pixels) processing of the projection data obtained by X-ray laminography, 2D cross-sectional images were reconstructed by the filtered back-projection method with considering the inclination of the rotational axis.15) 3D images were reconstructed and analyzed by an image analysis program (Avizo 9.1.1, FEI, USA), using 2048 2D tomographic images as layers.
2.4. Analysis of Void Nucleation Sites by EBSD
After tensile tests were performed until final fracture, the test specimens were cut with a fine cutter to examine the void nucleation sites using EBSD. These test specimens were embedded in resin to observe the planes perpendicular to the transverse direction (TD). The surface was polished with emery papers, followed by a sequential polishing with α-alumina and colloidal silica solutions. In addition, the damaged and contaminated layers of the surface were removed by performing Ar sputtering for 180 s at an accelerating voltage of 4 kV with IM-3000 to enable visualizing the void nucleation sites. Secondary electron (SE) images were acquired by FE-SEM, and EBSD images were obtained at the constant accelerating voltage of 15 kV. The void nucleation sites were then analyzed by OIM™.
2.5. Nano-indentation Hardness Test
The hardness distribution from the grain boundaries to the grain interiors in the WQ and AG specimens was investigated before tensile testing. The test specimens were embedded in resin to measure the hardness of the plane perpendicular to TD, with polishing treatments using α-alumina and colloidal silica solutions. The nano-indentation hardness HIT was measured with an instrumented indentation tester (ENT-2100, Elionix, Japan). The hardness was measured at 200 points (20 lines × 10 columns) under a force of 9.8 mN. After the hardness measurements, the specimens were etched with a 3% nitric acid–97% ethanol solution. The closest distance between the grain boundary and the apex of the triangle of the indentation was then obtained, and the relationship between HIT and the distance from the grain boundary was investigated.
3. Experimental Results
3.1. Optical Microstructures and Identification of Precipitates by EBSD
The microstructures of the WQ and AG specimens observed by an optical microscope are shown in Figs. 3(a), 3(b). No precipitates appear in the WQ specimen. In contrast, in the AG specimen, the precipitates are located mainly within approximately 20 μm of the grain boundaries; however, almost no precipitates are located in the center of the grains. In Fig. 3(b), zones with no precipitates are indicated by white circles.
The SE image and inverse pole figure (IPF) maps obtained by EBSD analysis for the AG specimen are shown in Figs. 4(a)–4(c). Figures 4(b) and 4(c) are IPF maps of body-centered cubic (bcc) -iron and face-centered cubic (fcc) crystal structures obtained from database equipped in EBSD. Areas in which the confidence index (CI) is less than 0.2 are colored in black. As the precipitate on the grain boundary has the fcc structure, we identified these precipitates as Fe4N with reference to the binary phase diagram of the Fe–N system.
3.2. Measurement of N in Grain Boundary by SIMS
For the WQ specimen, the Cs+ -induced SE image is shown in Fig. 5(a) and the results of SIMS elemental mapping are shown in Figs. 5(b)–5(d). A grain boundary is observed in Fig. 5(a); a region enclosing the two grains and the boundary between them was selected for elemental mapping as indicated by the yellow rectangle. The Fe– map shows mutually different intensities in the two grains on either side of the grain boundary, although the intensity is uniform in each grain. This difference is attributed to the different crystal orientations of the two grains. In addition, no difference is found in the ionic intensity around the grain boundary. Meanwhile, the C– map exhibits difference in ionic intensity depending on the grain, but no difference is detected at the grain boundary. The CN– map, unlike the cases of Fe– and C–, shows strong contrast along the grain boundary. A SIMS line profile of CN– across the grain boundary is shown in Fig. 6. Here, the line profile was obtained from a width of 38 μm. The C atoms do not appear to segregate at or near the grain boundary in the C– map, as shown in Fig. 5(c), therefore, the observed contrast and peak in the line profile must result from the presence of N atoms, thus confirming the segregation of N atoms around the grain boundary. The results of elemental mapping for the AG specimen are shown in the same manner in Figs. 7(a)–7(d), with a line profile results in Fig. 8. As with the WQ specimen, these results show that N atoms are segregated around the grain boundaries. Furthermore, the SIMS line profiles revealed that in both WQ and AG specimens, N atoms are distributed almost equally in the interior of the grain away from the grain boundary.

The SIMS results show that the N atom distributions are equal in the WQ and AG specimens. Together, the SIMS results and the optical micrographs (Fig. 3) suggest that N atoms accumulate near the grain boundary before aging. However, these N atoms precipitate as Fe4N (Fig. 4) during aging, and they do not significantly diffuse because of the low-temperature aging treatment temperature at 473 K.
Note that no precipitate appears in the SIMS image of the AG specimen in Fig. 7(a), whereas precipitates do appear in the corresponding optical micrograph in Fig. 3(b). This difference is caused by the fact that SE image shown in Fig. 7(a) was obtained by Cs+ primary ion.
3.3. Void Observation by Synchrotron Radiation X-ray Laminography
Test specimens were subjected to cyclical tensile loading–unloading in six stages, stopping to six strain values ranging from near the maximum load to near fracture. The tested specimens were then observed by X-ray laminography. Figure 9 shows the stress–strain curves of the tests stopped at these successive loading stages.

In the WQ specimen, the Lϋders strain is smaller and the amount of strain aging is larger than those in the AG specimen. Furthermore, the work hardening ratio of the WQ specimen is higher than that of the AG specimen. The smaller Lϋders strain in the WQ specimen is attributed to the increase in the density of moving dislocations caused by the thermal strain associated with water quenching. A smaller Lϋders strain and a higher density of moving dislocations are generally accompanied by decreasing yield strength. However, in this experiment the yield strength actually increased which is believed to be caused by the strengthening effect of the dissolved N atoms. Furthermore, the higher strain aging in the WQ specimen is caused by the increase in mobile dislocations. On the other hand, the higher work hardening ratio of the WQ specimen is believed to be caused by the increase in the total dislocation density.
3D images were reconstructed by Avizo Lite 9.0.1 from the projection data obtained by X-ray laminography. Figure 10 shows the 3D reconstructed images of voids that were observed to form in the middle period of local deformation (εx= 0.57–0.59), when a nominal strain of ~0.3% was additionally applied from the maximum loads. In this figure, the voids are independently colored to distinguish them clearly. During this stage, the WQ specimen obviously exhibits more voids than in the AG specimen. Figure 11 shows the relationship between the number of voids per unit volume and the void volume during this strain stage. The WQ specimen exhibits a higher number of voids with volumes exceeding 100 μm3 which is attributed to the differences in void nucleation sites between the specimens, as will be described in Section 3.4.
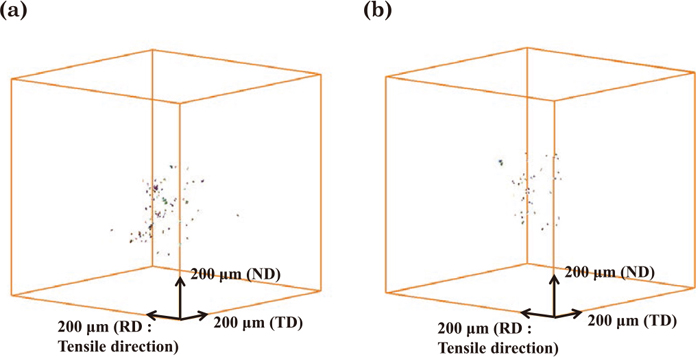
Figure 12 shows the 3D-reconstructed X-ray laminography images of voids in the late period of local deformation (εx= 0.99–1.13). During this stage, the WQ specimen continues to exhibit more voids than the AG specimen. Figure 13 shows the relationship between εx and the number of voids during the middle and late stages of local deformation (εx = 0.57–1.14). The number of voids in both WQ and AG specimens increases with increasing εx. In the WQ specimen, the largest increase in the number of voids occurs in the εx range of approximately 1.1–1.2. In addition, no obvious coalescence of voids is observed in this stage via X-ray laminography; therefore, the increased number of voids is attributed to the nucleation of new voids.

Figure 14 shows the 3D-reconstructed X-ray laminography images of voids from the near-fracture stage of local deformation (εx = 1.45–1.47). In this stage, The WQ specimen shows a sudden growth and coalescence in the voids, while in stark contrast, no sudden void growth and coalescence is observed in the AG specimen.
For each of the WQ and AG specimens, a single void was magnified to show the changes in the shape and volume of these voids with increasing εx as shown in Figs. 15(a)–15(d) and 16(a)–16(d), respectively. Clearly, the void in the WQ specimen increases more significantly in volume before fracturing than that in the AG specimen.
To summarize the results described above, the increasing rate of void nucleation with εx is moderate in the AG specimen, and the sudden void growth and coalescence in the εx region near fracture are suppressed.
3.4. Analysis of Void Nucleation Sites by EBSD
The WQ and AG specimens were tensile tested until final fracture, and the void nucleation sites were then investigated using SE images and Inverse Pole Figure (IPF) maps from the EBSD analysis. The results are shown in Fig. 17. The IPF map (bcc Fe) of the WQ specimen reveals that voids nucleate at the large-angle grain boundaries (the misorientation between grain boundaries is 40° in Fig. 17(b)); all nucleation sites were located at the grain boundaries in the nine other views. In the IPF map (bcc Fe) of the AG specimen (Fig. 17(d)), both precipitates and voids appear in the dotted areas (CI ≦0.10). However, referring to the SE image, voids also nucleated at the grain boundary in the AG specimen. We identified the precipitates or voids by referring to the SE image; voids are black and precipitates are white. Nine other views showed the same results. These results demonstrate that the voids nucleate at the grain boundaries for both the WQ and AG specimens.

The relationship between HIT and the distance from the grain boundary for the WQ and AG specimens before tensile testing is shown in Fig. 18. In the AG specimen, values taken from precipitates are excluded from this plot.

The difference between the HIT values near the grain boundary and in the interior for the WQ specimen is larger than that for the AG specimen. This greater difference in hardness in the WQ specimen is attributed to the distribution of dissolved N atoms around the grain boundaries. Furthermore, the average HIT measured on precipitates within the ferrite phases in the AG specimen is 2183 N/mm2, which is approximately equal to the HIT for the grain boundaries and interior of the AG specimen, demonstrating the weak strengthening effect of Fe4N for the ferrite phase. Moreover, Koga et al. showed that misorientation in the ferrite phase near the Fe4N/ferrite interface is 5° after tensile testing for a nitriding heat-treated ultra-low C steel,16) which is a small misorientation. This result implies that the plastic strain gradient at the Fe4N/ferrite interface is not high.
Meanwhile, N precipitates as nitrides in the AG specimen (here, Fe4N), as shown in Fig. 4; therefore, the HIT in the AG specimen is uniform from the grain boundary to the grain interior. Furthermore, the HIT in the center of grain in the AG specimen is lower than that in the WQ specimen because of the recovery of dislocations during aging.
These nano-indentation test results strongly suggest that the plastic strain gradient around the grain boundary in the WQ specimen is higher than that in the AG specimen.
4. Discussion
4.1. Heterogeneous Plastic Deformation near Grain Boundary
The SIMS results (Figs. 5, 6, 7, 8) demonstrated that N atoms were segregated at and near the grain boundaries for the Fe–0.02 mass% N alloy heated to the high-temperature ferrite region and immediately quenched with water, furthermore, N atoms did not appear to diffuse under low-temperature aging condition in this study.
On the other hand, EBSD (Fig. 4) showed that N atoms precipitated as Fe4N with aging. Therefore, this difference between the state of N atoms in the WQ and AG specimens influences the plastic strain gradient around the grain boundary.
According to the HIT results, the hardness aroud the grain boundary in the WQ specimen was higher than that of the grain interior because of the dissolved N atom segregation. However, in the AG specimen, as N atoms precipitated as Fe4N with aging, the difference in the hardness of the grain boundary and the grain interior diminished, even though the WQ and AG specimens exhibited the same N atomic distribution (Figs. 6 and 8). Thus, the effect of Fe4N precipitates on HIT is weak for the AG specimen, as descrivbed in 3.5.
For the WQ specimen, HIT showed a gradient extending from the grain boundaries of the WQ specimen to approximately 15 μm into the grains (Fig. 18). This distance agreed with the distribution of nitrides shown in the AG specimen in Fig. 3(b). On the other hand, the N atoms were distributed over a distance of ~1 μm, as observed in the SIMS line profiles of both specimens (Figs. 6 and 8). This difference in the extent of the gradient extension may be caused by the quantitative analysis limit of SIMS for N atom contents, which is not a low limit content. In this study, N was analyzed in the region at the grain boundary and within 1–2 μm from the grain boundary, whereas N atoms segregated over the quantitative analysis limit of N atoms by SIMS. In addition, the N distribution from the grain boundary is governed by the law of diffusion.
Despite the deviation between the SIMS line profile and the HIT measurements, the nano-indentation test results showed hardening in the grain boundary regions in the WQ specimen.
As described above, in the WQ specimen, the increasing hardness approaching the grain boundary (Fig. 18) causes plastic strain gradient near the grain boundary under tensile deformation. Using the microgrid method, Ishikawa et al. found that nonuniformity strain occurred at the soft ferritic/hard bainitic interface in DP steel,17) which supports our conclusion that the hardness gradient in the WQ specimen concentrated strain near this interface.
4.2. Effect of Plastic Strain Gradient on Void Nucleation, Growth and Coalescence
Using synchrotron radiation X-ray computed tomography (CT), Toda et al. found that plastic strain gradient was a factor in void nucleation in TRIP steel.14) In a previous study, the authors showed that the hardness gradient from the grain boundary to the interior in commercial-grade pure Fe contributed to void nucleation.18) Therefore, since the strain concentration around the grain boundary was higher in the WQ specimen than that in the AG specimen, more voids nucleated at low strain during tensile testing in the WQ specimen than in the AG specimen (Fig. 13).
This plastic strain gradient also influenced void growth and coalescence. When the critical stress is exceeded, voids coalesce, causing fracture.19) Therefore, the AG specimen reached the critical stress at a higher strain because the strain was less concentrated in the grain boundary region in the AG specimen than that in the WQ specimen.
Together, these results imply that the main factor governing local elongation is void nucleation, growth, and coalescence at the grain boundaries for a Fe–N alloy in which N atoms segregate around the grain boundary. The local elongation increases with decreases in the plastic strain gradient achieved by aging treatments.
5. Conclusions
The segregation of N atoms around the grain boundaries of a Fe–N alloy was analyzed by using SIMS, permitting the measurement of microscale regions for a Fe–0.02 mass% N alloy prepared by hot rolling, cold rolling, and high-temperature heating in the ferritic phase region followed by water quenching (i.e., the WQ specimen). Another specimen of the same material was subjected to aging (i.e., the AG specimen). Furthermore, precipitates in the AG specimen were analyzed by using EBSD. The reason for the larger local elongation in the AG specimen was discussed based on observations of the void growth and coalescence in these specimens by synchrotron radiation X-ray laminography. The nano-indentation hardness was also tested. The main conclusions obtained in this study are as follows:
(1) In the WQ specimen, dissolved N atoms segregated around the grain boundaries. With aging, these N atoms precipitated as Fe4N.
(2) As observed by SEM-EBSD, all void nucleation sites in the WQ and AG specimens were located at the grain boundaries.
(3) Under low-strain local deformation during the tensile test, a 3D reconstruction of X-ray laminography images revealed that the WQ specimen contained more voids than the AG specimen. During the stage of strain approaching fracture, these voids suddenly grew and coalesced in the WQ specimen.
(4) The nano-indentation hardness results showed that the WQ specimen exhibit a larger difference between the hardness values at the grain boundary and the center of grain than the AG specimen; from this result, it was concluded that the plastic strain gradient around the grain boundary was higher in the WQ specimen.
(5) The local elongation of the AG specimen, in which void growth was suppressed until near fracture, was larger than that of the WQ specimen, in which voids suddenly grew and coalesced as the specimen approached fracture. This difference was attributed to the lower plastic strain gradient around the grain boundaries in the AG specimen than that in the WQ specimen.
Based on these results, it was concluded that reducing the plastic strain gradient by providing more uniform hardness between the grain boundary and the grain interior is effective in increasing the local elongation.
Acknowledgements
The synchrotron radiation experiment was conducted as Topic No. 2016A1183 with the approval of the Japan Synchrotron Radiation Research Institute (JASRI). In addition, a portion of this research was performed with the support of the Advanced Characterization Nanotechnology Platform of The University of Tokyo, which is participating in the Nanotechnology Platform Technology Japan (NTPJ) project of the Ministry of Education, Culture, Sports, Science & Technology (MEXT). We wish to take the opportunity to express our deep appreciation to all concerned.
References
- 1) Formable HSLA and Dual-Phase Steels (Symp.on Ferrous Metallurgy Committee of TMS-AIME), ed. by: A. T. Davenport, The Metallurgical Society of AIME, New York.
- 2) S. Endo, M. Kurihara, N. Suzuki, A. Kato and M. Yoshikawa: Materia Jpn., 39 (2000), 166.
- 3) V. F. Zackay, E. R. Parker, D. Fahr and R. Busch: Trans. Am. Soc. Met., 60 (1967), 252.
- 4) T. Nakamura and K. Wasaka: Tetsu-to-Hagané, 61 (1975), 2067.
- 5) Z. Jiang, Z. Guan and J. Lian: Mater. Sci. Eng. A, 190 (1995), 55.
- 6) X. Wei, R. Fu and L. Li: Mater. Sci. Eng. A, 465 (2007), 260.
- 7) O. Furukimi, S. Niigaki, N. Yamada, M. Aramaki, S. Oue and Y. Funakawa: Tetsu-to-Hagané, 99 (2013), 60.
- 8) Y. Takeda, C. Kiattisaksri, M. Aramaki, S. Munetoh and O. Furukimi: Tetsu-to-Hagané, 102 (2016), 599.
- 9) S. H. Goods and L. M. Brown: Acta Metall., 27 (1979), 1.
- 10) N. Valle, J. Drillet, A. Perlade and H. N. Migeon: Appl. Surf. Sci., 255 (2008), 1569.
- 11) F. Christien, C. Downing, K. L. Moore and C. R. M. Grovenor: Surf. Interface Anal., 45 (2013), 305.
- 12) M. Hoshino, K. Uesugi, A. Takeuchi, Y. Suzuki and N. Yagi: J. Jpn. Soc. Synchrotron Radiat. Res., 26 (2013), 257.
- 13) Y. Suzuki, K. Uesugi, N. Takimoto, T. Fukui, K. Aoyama, A. Takeuchi, H. Takano, N. Yagi, T. Mochizuki, S. Goto, K. Takeshita, S. Takahashi, H. Ohashi, Y. Furukawa, T. Ohata, T. Matsushita, Y. Ishizawa, H. Yamazaki, M. Yabashi, T. Tanaka, H. Kitamura and T. Ishikawa: 8th Int. Conf. on Synchrotron Radiation Instrumentation, AIP publishing, New York (2004), 344.
- 14) H. Toda, F. Tomizato, R. Harasaki, D. Seo, M. Kobayashi, A. Takeuchi and K. Uesugi: ISIJ Int., 56 (2016), 883.
- 15) M. Hoshino, K. Uesugi, A. Takeuchi, Y. Suzuki and N. Yagi: AIP Conf. Proc., 1365 (2011), 250.
- 16) N. Koga, O. Umezawa and S. Saito: CAMP-ISIJ, 30 (2017), 959, CD-ROM.
- 17) N. Ishikawa, K. Yasuda, H. Sueyoshi, S. Endo, H. Ikeda, T. Morikawa and K. Higashida: Acta Mater., 97 (2015), 257.
- 18) O. Furukimi, Y. Takeda, M. Yamamoto, M. Aramaki, S. Munetoh, H. Ide and M. Nakasaki: Tetsu-to-Hagané, 103 (2017), 475.
- 19) Y. Bao and T. Wierzbicki: Eng. Fract. Mech., 72 (2005), 1049.


